
Abstract
Objective
To investigate the independent associations, dose-response relationships, and heterogeneity across different populations between eight cholesterol-related indices (WHR, LHR, NHR, MHR, PHR, AIP, CHG, and RCII) and diabetic nephropathy (DN), utilizing data from the National Health and Nutrition Examination Survey (NHANES).
Methods
This cross-sectional analysis included 9421 participants from the NHANES 2015–2020 cycles, including 631 DN patients. Multivariable logistic regression was used to assess associations between each index and DN. Restricted cubic spline (RCS) models were employed to explore nonlinear relationships, and effect modification was assessed across subgroups defined by gender, BMI, glycemic control, and other characteristics.
Results
After adjusting for multiple confounders, WHR, LHR, NHR, AIP, CHG, and RCII were all significantly positively associated with DN risk (all P < 0.001), with RCS analyses indicating nonlinear “threshold effects” for most indices. Subgroup analyses revealed significant heterogeneity in associations: WHR and LHR showed stronger associations in females; AIP and CHG remained robust across BMI and glycemic control subgroups; RCII showed stronger associations among non-hypertensive and non-smoking individuals.
Conclusion
In this cross-sectional study, six cholesterol-inflammation composite indices were independently associated with DN, predominantly exhibiting non-linear dose-response relationships. The variation in association strength across sex, metabolic status, and lifestyle factors suggests a potential pattern of “pathway heterogeneity” in DN risk. These indices warrant further investigation in future studies to explore their value as early clues for risk identification.
Keywords
Introduction
Diabetes and its complications constitute an increasingly severe global health burden. The International Diabetes Federation (IDF) projects that the number of people with diabetes worldwide will rise from 643 million in 2030 to 784 million by 2045.1,2 Against this backdrop, DN, as a major microvascular complication of diabetes, affects approximately 40% of diabetic patients and has become the leading cause of end-stage renal disease (ESRD). 3 The traditional pathological mechanisms of DN involve the combined effects of oxidative stress, overactivation of the renin-angiotensin-aldosterone system (RAAS), and chronic inflammation, with persistent inflammatory responses driven by immune cell infiltration being central to renal fibrosis and functional decline. 4 Furthermore, increasing evidence suggests that lipotoxicity plays a critical role in diabetic kidney injury by directly damaging podocyte and tubular functions. 5 Currently, the clinical diagnosis of DN relies on albuminuria and estimated glomerular filtration rate (eGFR); however, these indicators lack sufficient sensitivity in identifying early renal damage. 6 Given the complexity of DN pathophysiology, the development of novel biomarkers that can reflect its multi-pathway pathogenic mechanisms earlier and more comprehensively is of paramount importance. In recent years, composite indices that integrate multiple pathological pathways—such as NLR and AIP used in the cardiovascular field—have demonstrated superior performance over single markers in risk assessment.7,8 Nevertheless, studies systematically comparing various novel cholesterol-inflammation composite indices with DN in large, representative populations are still lacking, and the heterogeneity of these associations across subgroups with different clinical characteristics remains unclear. Therefore, this study aims to explore the associations between eight cholesterol-related indices (WHR, LHR, NHR, MHR, PHR, AIP, CHG, RCII) and DN using data from the NHANES, and to reveal subgroup differences in these associations through in-depth analyses, with the goal of providing new epidemiological evidence for the early identification and risk stratification of DN.
Materials and methods
Data source
This study was conducted as a population-based, retrospective cross-sectional study using data from the 2015 to 2020 cycles of the NHANES. NHANES is a complex, stratified, multistage probability sampling survey conducted by the National Center for Health Statistics (NCHS), a division of the U.S. Centers for Disease Control and Prevention (CDC). The survey data are nationally representative of the non-institutionalized U.S. population. All participants provided written informed consent, and the survey protocol was approved by the NCHS Ethics Review Board. The data were publicly available at: https://www.cdc.gov/nchs/nhanes/. The analytical procedures of this study comply with the Declaration of Helsinki, and the reporting of this study conforms to STROBE guidelines. 9
Study population
The selection process of the study participants is shown in Figure 1. The initial sample consisted of participants from the 2015 to 2020 NHANES cycles. Inclusion criteria required participants to be aged ≥20 years and have complete data on diabetes status. We then excluded individuals with missing key exposure and outcome variables, including lipid profiles, complete blood count, urine albumin-to-creatinine ratio (ACR), or serum creatinine; and those missing any of the predefined covariates (see “Covariates” section for details). Ultimately, a total of 9421 participants were included in the final analysis, consisting of 631 DN patients and 8790 non-DN participants (including both normoglycemic individuals and diabetic patients without nephropathy).

Flowchart of participant selection.
Outcome variable: diabetic nephropathy
The outcome variable in this study was DN. Diagnosis was based on a two-step process: First, diabetes was defined as meeting any of the following criteria: (1) self-reported diagnosis by a healthcare professional; (2) fasting blood glucose ≥7.0 mmol/L; (3) hemoglobin A1c (HbA1c) ≥ 6.5%; (4) current use of insulin or oral hypoglycemic medications. On this basis, diabetic patients were defined as having DN if their ACR was ≥30 mg/g.
Exposure variables
The exposure variables in this study were eight cholesterol-related composite indices, all calculated based on NHANES laboratory data. The calculation of different indices followed standard units commonly used in the literature: for WHR, LHR, NHR, MHR, PHR, and AIP, lipid concentrations (TC, TG, HDL-C, LDL-C) were measured in millimoles per liter (mmol/L); for CHG and RCII, lipid concentrations were measured in milligrams per deciliter (mg/dL). For the CHG calculation, fasting blood glucose was also converted to mg/dL using the conversion factor: 1 mmol/L = 18 mg/dL.
The formulas for each index are as follows: White blood cell to HDL cholesterol ratio (WHR) = white blood cell count / HDL-C; Lymphocyte to HDL cholesterol ratio (LHR) = lymphocyte count / HDL-C; Neutrophil to HDL cholesterol ratio (NHR) = neutrophil count / HDL-C; Monocyte to HDL cholesterol ratio (MHR) = monocyte count / HDL-C; Platelet to HDL cholesterol ratio (PHR) = platelet count / HDL-C; Atherogenic index of plasma (AIP) = ln (triglycerides / HDL-C); Composite metabolic index (CHG) = ln [total cholesterol × fasting blood glucose / (2 × HDL-C)]; Residual cholesterol inflammation index (RCII) = (total cholesterol − HDL-C − LDL-C) × hsCRP / 10. Units: WHR, LHR, NHR, MHR, PHR are expressed as 109·mmol⁻1; AIP is dimensionless; CHG is in mg/dL; RCII is expressed in mg2·dL⁻1·L⁻1.
Covariates
Based on previous literature and biological plausibility, the following potential confounding factors were adjusted for in this study: Sociodemographic factors: age (continuous variable); sex (male, female); race/ethnicity (Mexican American, other Hispanic, non-Hispanic White, non-Hispanic Black, other races); marital status (married, unmarried); education level (college or above, high school or equivalent, less than high school). Lifestyle factors: smoking status [defined as: smoker (smoked >100 cigarettes in lifetime), never smoker (≤100 cigarettes in lifetime)]; alcohol consumption (whether consumed alcohol in the past year). Anthropometric indicators: body mass index (BMI, continuous variable, kg/m2). Clinical and metabolic indicators: glycated hemoglobin (HbA1c, continuous variable, %); Homeostatic Model Assessment of Insulin Resistance (HOMA-IR, continuous variable); history of hypertension (yes, no); history of cardiovascular disease (yes, no; defined as self-reported diagnosis of any of the following: congestive heart failure, coronary heart disease, angina, or myocardial infarction); history of stroke (yes, no).
Statistical analysis
All statistical analyses were performed using R software (version 4.5.2), and statistical significance was defined as two-sided P < 0.05. Given that the primary aim of this study was to explore association patterns among multiple novel indices and to validate the robustness of positive findings via in-depth dose-response and subgroup analyses—with the main associations yielding P-values far below 0.05—no correction for multiple comparisons was applied, to avoid excessive conservatism and to enhance the ability to detect potential associations.
Descriptive statistics
Categorical variables were presented as counts and percentages (n, %), with comparisons between groups performed using the chi-square test. Continuous variables with normal distribution were described using mean ± standard deviation and compared using the independent samples t-test; non-normally distributed continuous variables were presented as medians (interquartile range) and compared accordingly.
Association analysis
To assess the independent associations between each index and DN, multivariable logistic regression models were used with three levels of adjustment strategies: Model 1 (unadjusted model): no covariates included. Model 2 (demographically adjusted model): adjusted for age, sex, race/ethnicity, education level, and marital status. Model 3 (fully adjusted model): further adjusted for BMI, smoking history, history of cardiovascular disease, history of stroke, history of hypertension, and HOMA-IR on the basis of Model 2. Results were presented as odds ratios (ORs) with 95% confidence intervals (CIs).
Dose-response relationship analysis
To further investigate potential nonlinear relationships between exposure variables and outcome, restricted cubic spline (RCS) models were employed. Six core indices (WHR, LHR, NHR, AIP, CHG, RCII) were analyzed under both Model 1 and Model 3 frameworks. OR = 1 was used as the reference point for plotting curves, and likelihood ratio tests were used to evaluate the overall association (P-overall) and the presence of a nonlinear trend (P-non-linear).
Subgroup analysis and interaction effects
Subgroup analyses were performed based on the fully adjusted model (Model 3), and likelihood ratio tests were used to evaluate effect modification by sex (male, female), history of hypertension (yes, no), BMI (normal: < 25 kg/m2; overweight: ≥ 25 kg/m2 and <30 kg/m2; obese: ≥ 30 kg/m2), glycemic control (well-controlled: HbA1c < 7.0%; poorly controlled: HbA1c ≥ 7.0%), and smoking history (yes, no).
Results
Baseline characteristics of the study population
A total of 9421 participants were included in the final analysis, among whom 631 individuals (6.7%) were diagnosed with DN. As shown in Table 1, compared with the non-DN group, DN patients were older, had a higher proportion of males, higher BMI, and a greater prevalence of stroke and smoking history (all p < 0.001). Regarding metabolic indicators, both HbA1c and HOMA-IR levels were significantly elevated in the DN group (p < 0.001). Notably, the levels of WHR, MHR, LHR, NHR, PHR, AIP, CHG, and RCII—indices of interest in this study—were all significantly higher in the DN group compared to the non-DN group (all p < 0.001).
Baseline characteristics of the study population.
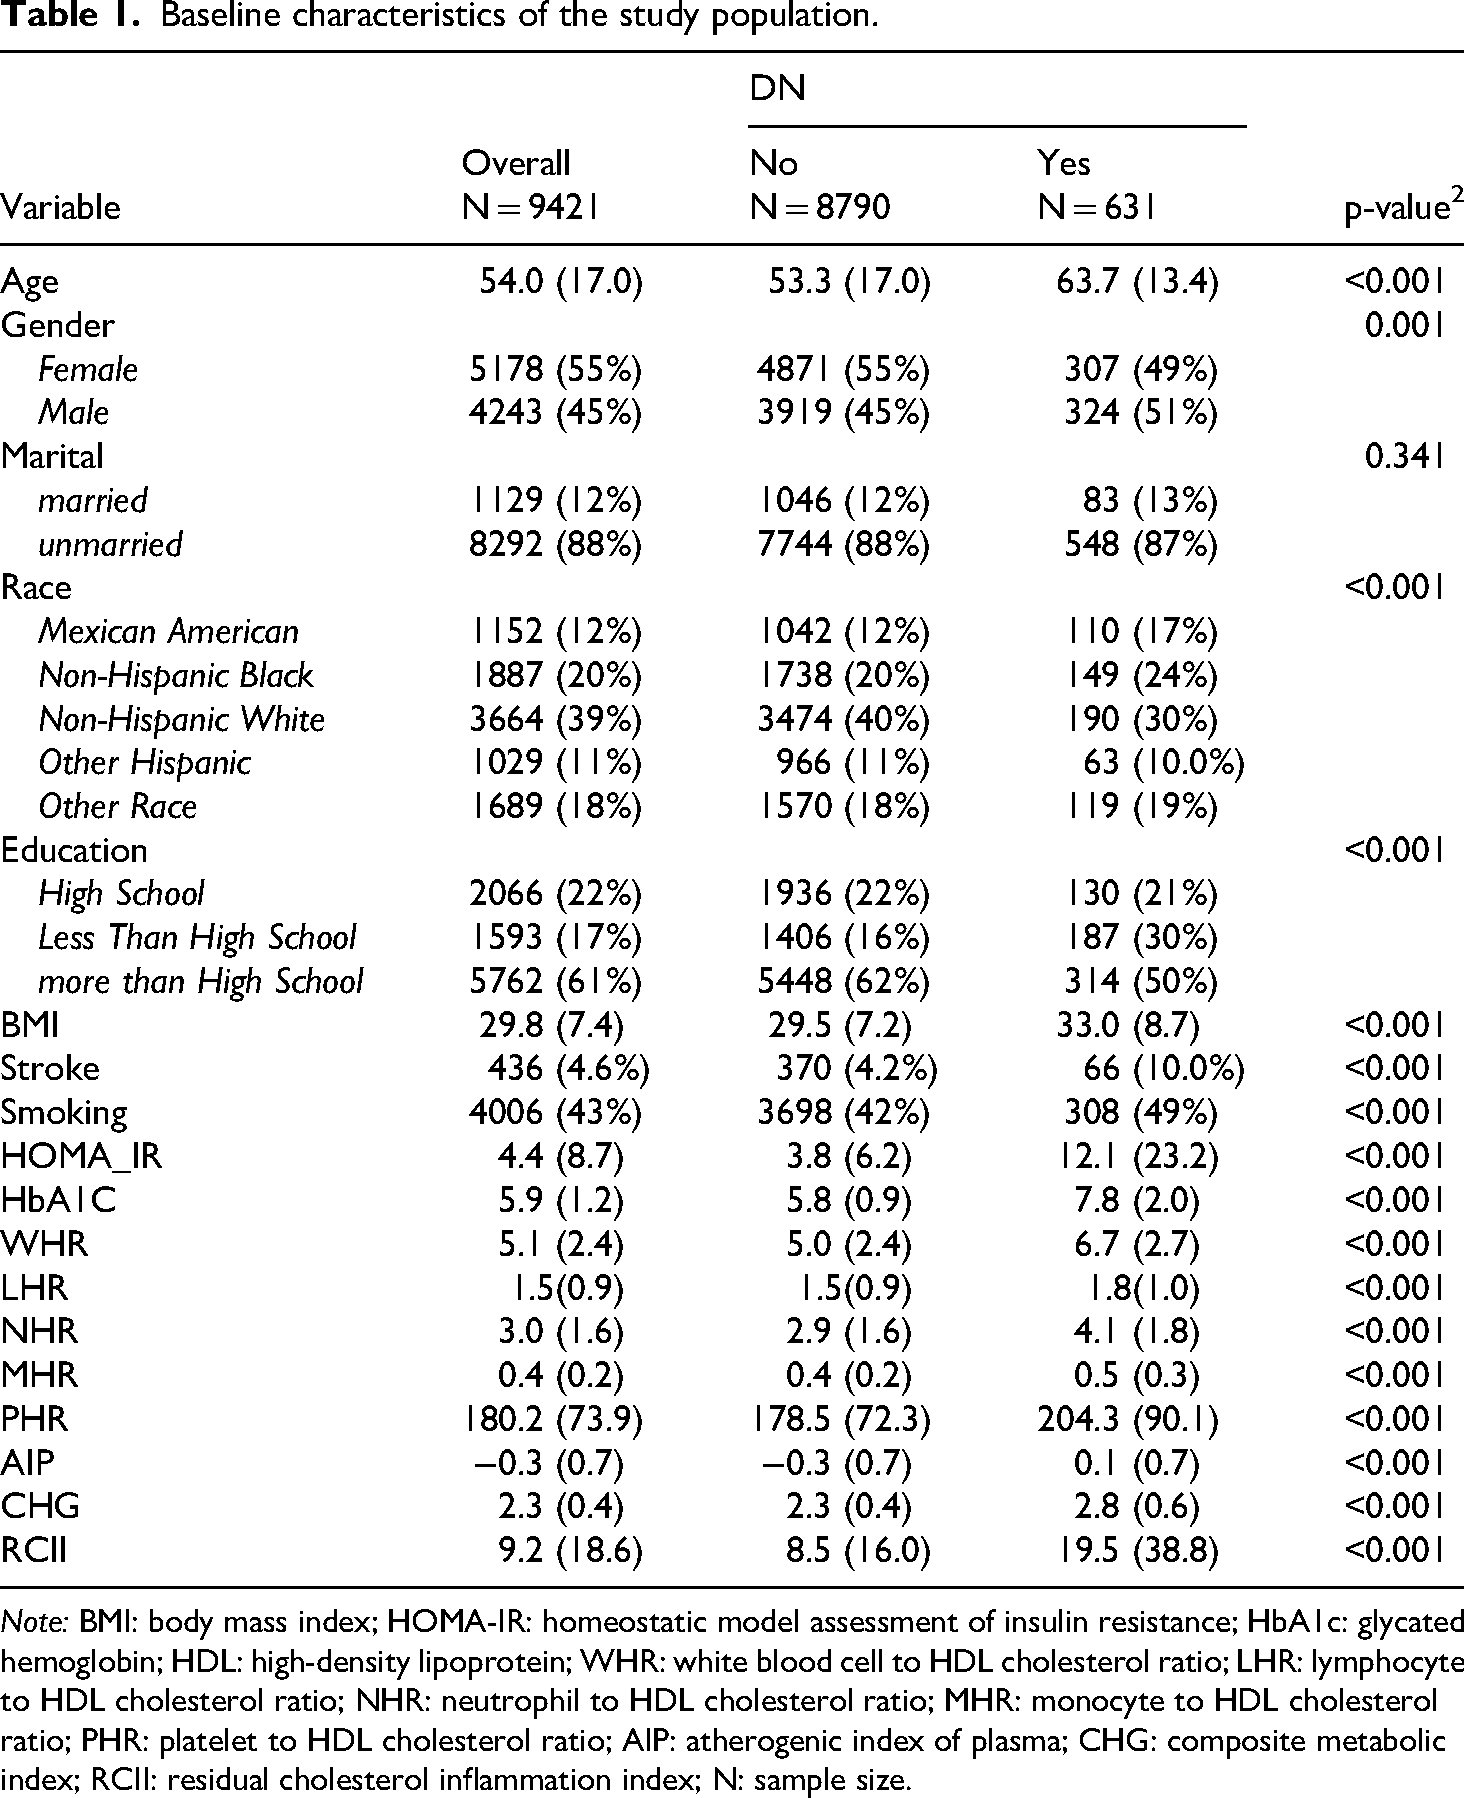
Note: BMI: body mass index; HOMA-IR: homeostatic model assessment of insulin resistance; HbA1c: glycated hemoglobin; HDL: high-density lipoprotein; WHR: white blood cell to HDL cholesterol ratio; LHR: lymphocyte to HDL cholesterol ratio; NHR: neutrophil to HDL cholesterol ratio; MHR: monocyte to HDL cholesterol ratio; PHR: platelet to HDL cholesterol ratio; AIP: atherogenic index of plasma; CHG: composite metabolic index; RCII: residual cholesterol inflammation index; N: sample size.
Independent associations between cholesterol-related indices and DN
As shown in the multivariable logistic regression models (Table 2), all eight indices were significantly positively associated with DN risk in the unadjusted Model 1 (p < 0.001 for all). After stepwise adjustment for demographic factors (Model 2), and further inclusion of BMI, lifestyle, and metabolic indicators (Model 3), the associations remained robust (all p < 0.001). However, it was observed that the OR estimate for MHR was extremely large with an excessively wide confidence interval (Model 3 OR: 5.273, 95% CI: 3.519–7.903), indicating instability in the estimate—likely due to collinearity or influence from outliers. Meanwhile, although PHR showed statistical significance, its effect size was very small (Model 3 OR: 1.004 per unit), implying limited clinical relevance. Therefore, the subsequent in-depth analyses focused on six indices with robust and more interpretable associations: WHR, LHR, NHR, AIP, CHG, and RCII.
Adjusted associations between cholesterol-related composite indices and risk of diabetic nephropathy.
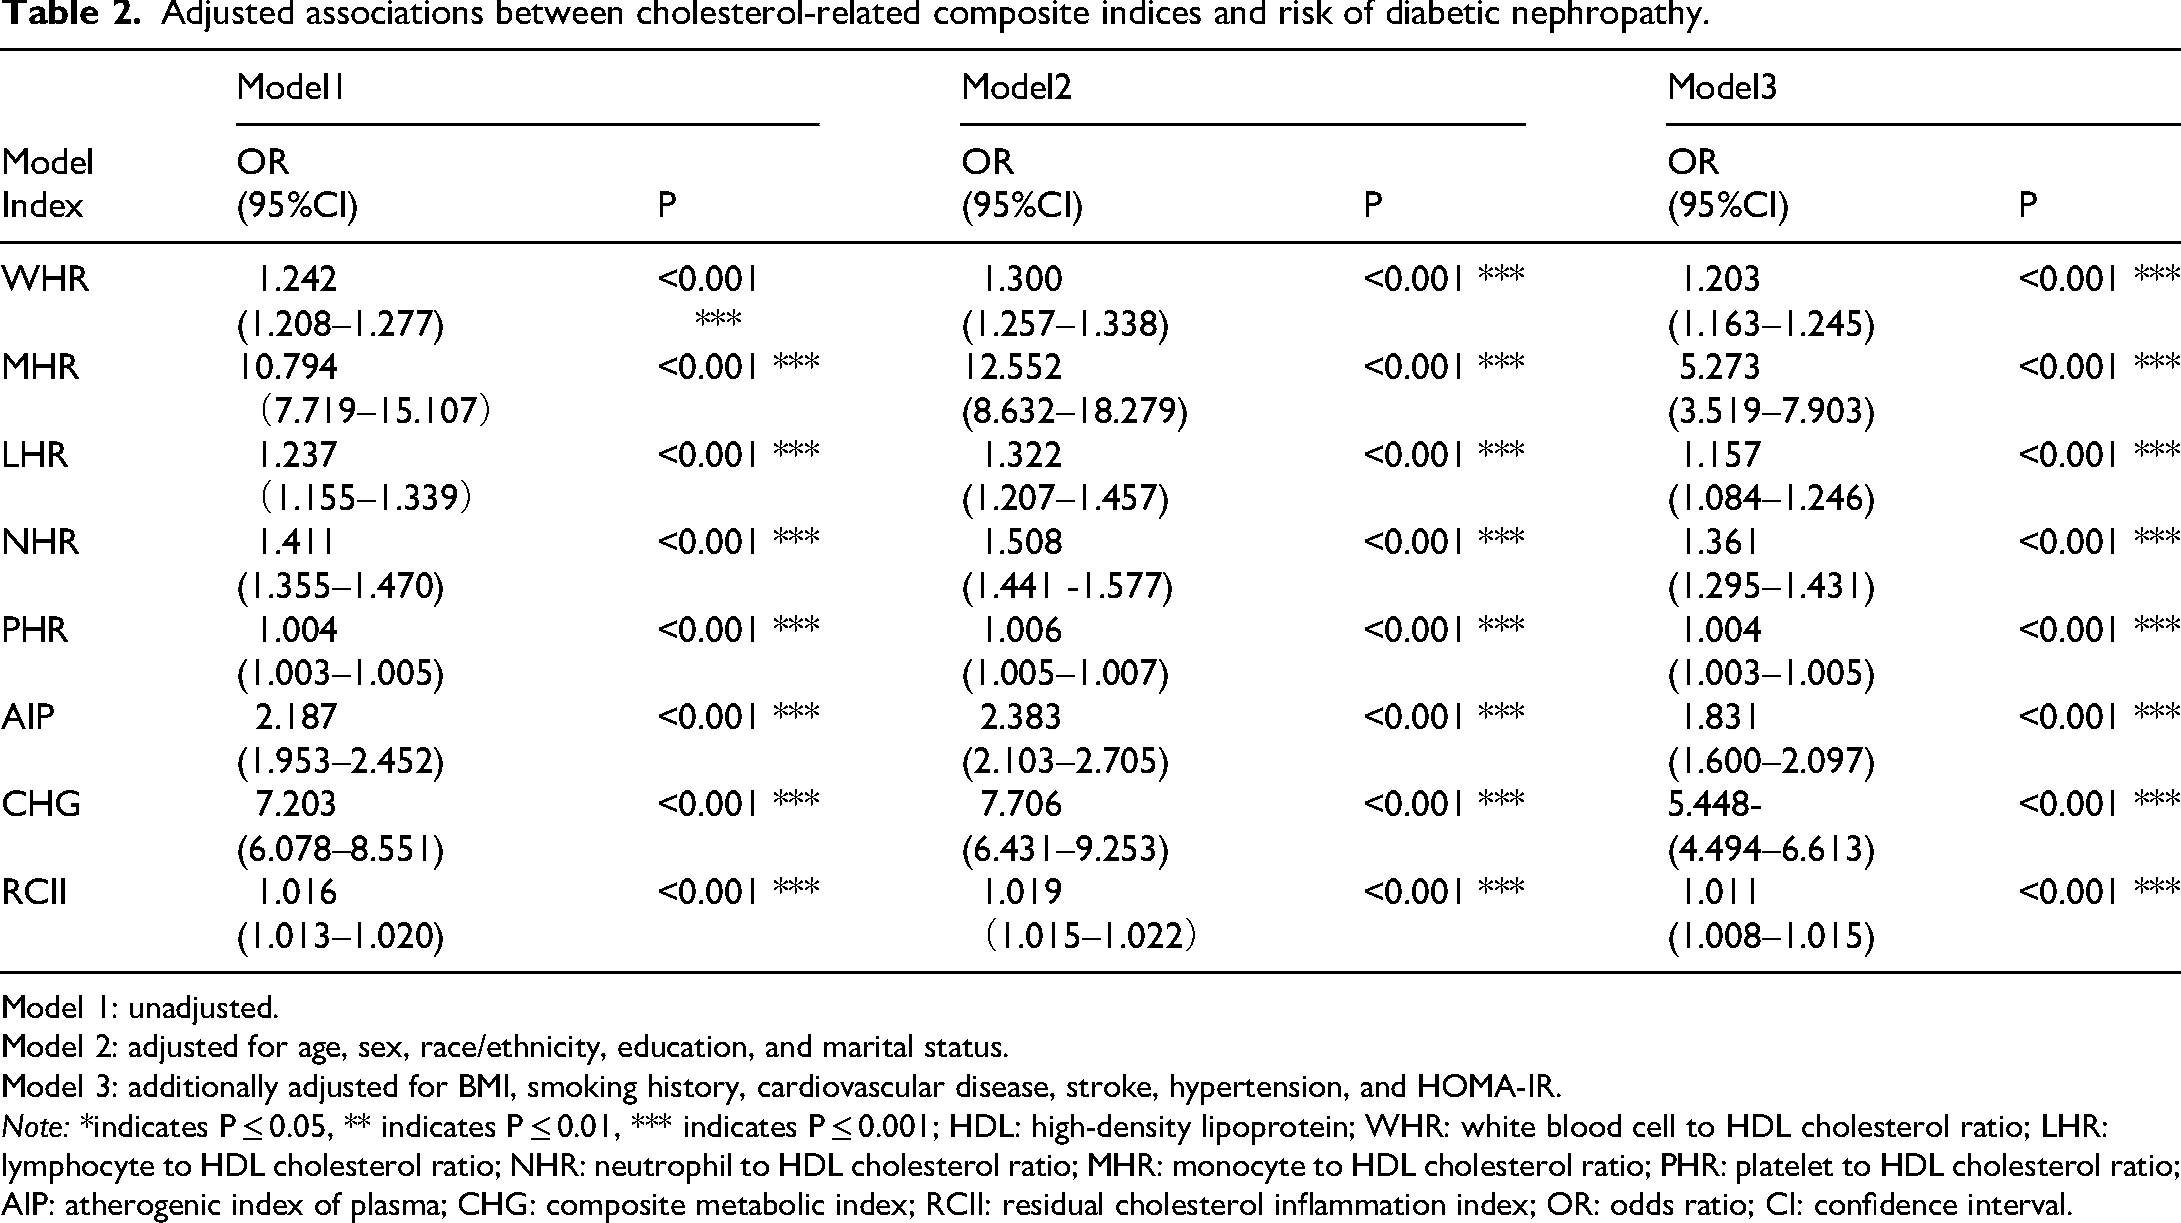
Model 1: unadjusted.
Model 2: adjusted for age, sex, race/ethnicity, education, and marital status.
Model 3: additionally adjusted for BMI, smoking history, cardiovascular disease, stroke, hypertension, and HOMA-IR.
Note: *indicates P ≤ 0.05, ** indicates P ≤ 0.01, *** indicates P ≤ 0.001; HDL: high-density lipoprotein; WHR: white blood cell to HDL cholesterol ratio; LHR: lymphocyte to HDL cholesterol ratio; NHR: neutrophil to HDL cholesterol ratio; MHR: monocyte to HDL cholesterol ratio; PHR: platelet to HDL cholesterol ratio; AIP: atherogenic index of plasma; CHG: composite metabolic index; RCII: residual cholesterol inflammation index; OR: odds ratio; CI: confidence interval.
Dose-response relationship analysis
To further elucidate the patterns of association, RCS models were fitted to examine the dose-response relationships between the six selected indices and DN risk under both Model 1 and Model 3 frameworks (Figure 2). The results showed strong associations between all six indices and DN risk (all P-overall < 0.001). More importantly, with the exception of AIP in Model 1, significant nonlinear associations were detected for all other indices in both models (all P-non-linear < 0.05).

Restricted cubic spline (RCS) curves.
Specifically, WHR, LHR, NHR, CHG, and RCII exhibited stable nonlinear relationships in both Model 1 and Model 3, with highly similar curve patterns between models. All five indices demonstrated an evident “threshold effect,” where the risk of DN increased sharply after surpassing specific inflection points. The approximate inflection points identified in both models were as follows: WHR (5.931), LHR (1.379), NHR (3.529), CHG (2.307), and RCII (8.170).
For AIP, the association pattern was influenced by covariate adjustment. In Model 1, the relationship was nearly linear (P-non-linear = 0.043); however, in Model 3, a pronounced nonlinear relationship emerged (P-non-linear = 0.012), with a distinct inflection point at 0.294. This suggests that after controlling for confounders, the true relationship between AIP and DN is nonlinear, with a clear increase in risk observed when AIP exceeds 0.294.
Subgroup analysis and interaction effects
The core findings can be summarized in two main points: First, all indices maintained significant positive associations with DN risk across the vast majority of subgroups, confirming the robustness of the primary conclusions (see forest plots in Figure 3). Second, interaction analyses revealed complex patterns of effect modification, with the direction and magnitude of interactions varying by index (Table 3):
Patterns of significant effect modification (all P for interaction < 0.05) included: The associations between WHR and LHR and DN were significantly stronger in females than in males. The associations of WHR, LHR, AIP, CHG, and RCII with DN were more pronounced in individuals without a history of hypertension. The associations of WHR and LHR with DN lost statistical significance in the overweight subgroup; CHG showed stronger associations in obese individuals. When glycemic control was poor (HbA1c ≥ 7.0%), the associations of WHR, NHR, AIP, and CHG with DN were no longer statistically significant. WHR, NHR, LHR, and RCII were more strongly associated with DN in non-smokers. Patterns suggesting no significant effect modification (all P for interaction ≥ 0.05) reflected robustness in certain indices: AIP and CHG showed no significant differences by sex or smoking status; AIP also maintained stable associations across BMI groups. LHR was not significantly modified by glycemic status. NHR showed consistent associations across sex, hypertension status, and BMI categories. RCII did not exhibit significant interactions with sex, BMI, or glycemic control.

Subgroup analyses of key indices with forest plots and interaction tests (based on Model 3).
Interaction test results.

Note: BMI: body mass index; HBA1C: glycated hemoglobin; HDL: high-density lipoprotein; WHR: white blood cell to HDL cholesterol ratio; LHR: lymphocyte to HDL cholesterol ratio; NHR: neutrophil to HDL cholesterol ratio; AIP: atherogenic index of plasma; CHG: composite metabolic index; RCII: residual cholesterol inflammation index.
Discussion
Based on a large-scale cross-sectional dataset, this study revealed that multiple novel cholesterol-inflammation composite indices (WHR, LHR, NHR, AIP, CHG, RCII) are independently associated with diabetic nephropathy (DN), with robust associations persisting after multivariable adjustments. Most of these indices exhibited nonlinear dose-response relationships. More importantly, subgroup analyses revealed marked heterogeneity in the strength and pattern of these associations: AIP and CHG showed the most robust relationships across subgroups; the associations of WHR and LHR were stronger in women; while the association of RCII was most pronounced among participants without hypertension or smoking habits. These findings provide a fresh perspective for refined clinical risk stratification.
This study confirmed that several novel cholesterol-inflammation composite indices are independently associated with DN risk, and the underlying mechanisms likely involve three interrelated core pathological pathways: First, ratio indices such as WHR, LHR, and NHR integrate white blood cell subsets with HDL-C, collectively reflecting a state of imbalance between inflammation and protection resulting from innate immune activation and the defective anti-inflammatory functions of HDL.10–12 Second, AIP quantifies the risk associated with an atherogenic lipid profile by assessing the triglyceride-to-HDL-C ratio. Pathologically, this dyslipidemia is initiated by chronic inflammation driven by immunometabolic dysregulation, 13 subsequently fostering a vicious cycle of lipotoxicity and inflammation, 14 which ultimately induces fibrosis characterized by the dysregulation of pathways such as TGF-β. 15 Meanwhile, CHG integrates glycemic and lipid parameters to reflect the synergistic renal damage caused by hyperglycemia and glucolipid disorders. This damage is mediated by hyperglycemia-induced pathway interference and the accumulation of advanced glycation end products (AGEs), which, combined with dyslipidemia, exacerbate oxidative stress and inflammatory responses.16–18 Finally, RCII mathematically quantifies the synergistic interaction between remnant cholesterol and the inflammatory response. This index not only captures the synergistic deleterious effects that single markers fail to reflect but also mechanistically highlights the renal fibrosis process driven by the lipid-inflammation axis. Specifically, oxidized products of remnant cholesterol can induce epithelial-mesenchymal transition (EMT) in renal tubular epithelial cells, thereby contributing to the progression of renal fibrosis.19–21 Notably, the nonlinear dose-response relationships and identified inflection points observed in this study suggest the presence of critical “pathological thresholds” for renal injury—once the levels of these indices exceed their respective thresholds, the corresponding pathological pathways may become fully activated, sharply increasing DN risk.
This study's in-depth subgroup analyses revealed that the associations between these indices and DN exhibit a complex “context-dependent” pattern. Regarding gender differences, WHR and LHR exhibited stronger associations in females, which may be attributed to disparities in sex hormones and immune regulation.22–24 This suggests that monitoring such inflammatory indices may hold additional value for female patients with diabetes. From a metabolic perspective, severe hyperglycemia (HbA1c ≥ 7.0%) creates a toxic metabolic background through the AGE-RAGE signaling pathway and mitochondrial dysfunction.17,25 In this context, CHG exhibited a unique pattern: it maintained strong associations across the majority of subgroups (stratified by sex, BMI, hypertension, and smoking status), reflecting its robustness as an integrated index of glucolipid metabolism. However, in patients with poor glycemic control (HbA1c ≥ 7.0%), the association between CHG and DN lost statistical significance, suggesting that extreme metabolic disturbances might mask this specific pathway signal. Conversely, the association of CHG was particularly pronounced in normotensive patients with well-controlled glycemia (HbA1c < 7.0%). This finding holds significant clinical implications, as the renal risk in such patients may be underestimated due to their seemingly well-managed blood pressure and glucose levels. Recent studies support the predictive value of CHG for diabetic microvascular complications, 26 suggesting its potential as a complementary tool for identifying “occult” renal risk in this specific population. Although the effect size of RCII was more modest compared to AIP and CHG, its association remained significant among non-hypertensive and non-smoking individuals. This implies that RCII may be better suited for assessing “residual” inflammatory-lipid risk in settings of low traditional risk. Recent evidence also corroborates RCII as an independent predictor of prognosis in patients with Cardiovascular-Kidney-Metabolic (CKM) syndrome, 27 supporting its potential as a cost-effective risk marker. In addition, hypertension becomes a dominant driver of renal injury through hemodynamic stress and RAAS activation,4,28 which may attenuate the independent predictive signal of other novel inflammation–lipid indices. Smoking status, meanwhile, may compromise the predictive performance of both inflammatory and metabolic markers via two parallel pathways—triggering non-specific inflammation and disrupting metabolism.29,30
Although MHR reached statistical significance—and prior clinical studies suggest that elevated MHR may serve as a biomarker for DN 31 —the wide OR interval observed in the present study indicates that the association may be unstable. This may be partly attributable to an insufficient sample size, and further validation in larger cohort studies is warranted. In contrast, PHR showed a smaller OR interval in relation to DN, which may reflect the fact that platelet counts do not always change markedly in diabetic complications. 32 Based on these differences, we propose a more targeted clinical monitoring pathway: In female diabetic patients, close monitoring of inflammation-related indices such as WHR and LHR is recommended; For patients with complicated metabolic disorders, indices like AIP and CHG demonstrate more stable predictive value; Among individuals with well-controlled blood glucose and without hypertension, RCII may serve as a critical tool for long-term risk surveillance. As these composite indices are derived from routine laboratory tests, they offer convenient and cost-effective screening tools for use in primary care, especially in resource-limited settings, where their utility becomes even more pronounced.33,34
However, several limitations of this study warrant cautious interpretation. The primary limitation arises from the cross-sectional study design, which—despite revealing associations—does not allow for determination of temporal causality. In other words, it remains unclear whether the abnormalities in biomarkers are causes or consequences of DN. 35 Second, although extensive covariate adjustment was performed, residual confounding cannot be fully ruled out. Controlling for unmeasured or imprecisely measured factors remains a challenge in observational studies, 36 particularly variables such as dietary details or medication adherence, which were not included in the model but may affect outcomes. 37 Furthermore, as the data were derived from a specific U.S. population, caution is needed when generalizing the findings to other ethnicities, regions, or healthcare systems. 38 Lastly, some of the indices used are derived variables, potentially subject to accumulated measurement error. Nonetheless, all components of these indices were obtained through standardized laboratory procedures, ensuring maximum data reliability. Additionally, while the composite indices demonstrated superior predictive capability, their biological interpretation and clinical cut-off values remain to be clearly defined. MHR and PHR were excluded due to statistical instability, suggesting that some composite indices may present challenges in clinical applicability. Future prospective studies are needed to establish reference ranges and clinical thresholds for these indices.
Conclusion
Based on large-scale, population-based cross-sectional data, this study observed independent associations and non-linear trends between six novel cholesterol–inflammation composite indices and DN. Subgroup analyses further indicated that these associations vary across populations. Taken together, the findings support the notion that DN risk may involve “pathway heterogeneity”; however, the precise causal direction and clinical implications remain to be clarified through prospective studies.
Footnotes
Acknowledgements
We sincerely appreciate the NHANES management for providing the publicly available data and reports, which enabled the completion of this manuscript.
Ethical approval
Ethical approval was not provided for this study on human participants because NHANES is a publicly available dataset. The patients provided their written informed consent to participate in this study.
Author contributions
Li Zhang organized the data and wrote the original draft. Xin Yang in-vestigated, organized, and verified the data. Shuiying Hua super-vised the data and data curation. Dehui Liu verified the data, reviewed and edited the draft, monitored progress.
Funding
The authors disclosed receipt of the following financial support for the research, authorship, and/or publication of this article: Supported by the funds for the Medical Academic Leader of Ganzhou City.
Declaration of conflicting interests
The authors declared no potential conflicts of interest with respect to the research, authorship, and/or publication of this article.
Data availability statement
Ethical approval was not provided for this study on human participants because NHANES is a publicly available dataset; this data can be found here: wwwn.cdc.gov/nchs/nhanes/Default.aspx.