
Abstract
Introduction:
In this study, we sought to validate the effectiveness of an automated audiometry system in quiet (AA) and noisy environments (AA-N) by comparing the air pure-tone thresholds obtained by AA to those obtained by traditional manual audiometry (MA).
Methods:
In this cross-sectional study, 150 participants with or without hearing loss were tested (age: 11–84 years; female: 57.3%). Air conduction thresholds were assessed by MA, AA, and AA-N in a quiet or noisy sound booth.
Results:
In participants without hearing loss, 94.5% and 96% of the threshold comparisons differed between MA versus AA and AA versus AA-N within 10 dB HL or less. In participants with hearing loss, there was no statistically significant difference between the three testing conditions at any frequency (p > 0.05). The hearing threshold difference in the poor hearing ear in participants with a bilateral difference ≥40 dB HL was −15 and +15 dB HL; however, this difference was not statistically significant when excluding participants with tinnitus.
Conclusions:
Automatic audiometry can accurately estimate hearing thresholds and screen for hearing loss even in noisy environments. Nevertheless, the algorithm must be corrected when patients experience tinnitus.
Introduction
According to the World Health Organization, over 1.5 billion people experience a decline in their hearing ability throughout their lives, with at least 430 million requiring care, thus reducing patients’ quality of life and placing a considerable economic impact on society.1,2 With careful diagnosis, medical care, and amplification, hearing loss is treatable; however, the insufficient number of hearing health professionals has resulted in the inability to meet the demand for hearing services. The World Health Organization Regional Office for Africa reported that 78% of African countries have fewer than one audiologist per 1 million people. 2 Therefore, recent reports have emphasized the significance of the accessibility and efficiency of automated audiometry (AA) for hearing health.3,4 This approach may optimize services and health resources in areas with limited or insufficient healthcare professionals.
Automated self-test options are important for detecting and diagnosing hearing loss to ensure the provision of timely and appropriate treatments. The onset of the COVID-19 pandemic on societies has further emphasized the importance of self-testing approaches.5,6 Automation on digital devices is a powerful enabler of alternative diagnostic pathways that can include home-based testing, low-touch service models outside traditional clinic settings, and decentralized community-based models that rely on task shifting to minimally trained facilitators. 7 Automated audiometry has been developed over many years and is currently predominantly used in hearing screening.4,8 With the development of software and hardware technologies related to digital signal processing, automatic digital hearing detection technology, characterized by new digital signal processing technology, is gradually emerging. Early studies have reported good correspondence between thresholds and traditional manual audiometry (MA)9–11; however, the use and widespread adoption of AA in hearing screening remain limited due to factors such as a lack of appropriate hearing health professionals and infrastructure.
Hearing loss is a well-recognized risk factor for tinnitus, with most patients with tinnitus showing elevated hearing thresholds in pure-tone audiometry (PTA), particularly in the high-frequency range.11–13 However, the effectiveness of hearing threshold assessments in tinnitus patients with hearing loss, particularly those with asymmetric hearing loss, has not been thoroughly evaluated. This study aimed to compare the reliability, accuracy, and efficiency of MA versus AA under two different conditions: a certified standard hearing room (<30 dBA) and an environment with controlled ambient noise levels (40–45 dBA). Additionally, the preliminary impact of tinnitus on the accuracy of hearing loss detection was explored.
Methods
Ethics approval
The study was conducted in accordance with the Declaration of Helsinki and approved by the institutional ethics committee of Sun Yat-sen University (No[2020]062). All participants provided informed consent before participation.
Study design and participants
This study employed a cross-sectional design to compare hearing threshold results for the three test conditions. Individuals were selected from the outpatient Department of Otorhinolaryngology and Health Checkup Clinic of The First Affiliated Hospital, Sun Yat-sen University. The inclusion criteria were as follows: (1) good degree of cooperation, (2) normal or impaired hearing, and (3) no outer- or middle-ear pathology. All patient details were de-identified.
Sample size was estimated using G*power 3.1 software, with the effect size set to 0.5 and α set to 0.05. The calculation results showed that in order to achieve a statistical test power of 0.95, the study required a total of 54 subjects. Thus, 150 subjects (64 males and 86 females) were actually recruited.
Equipment
Audiometry was conducted with a mobile intelligent audiometry device (sftest330; Foshan Bozhi Medical Technology Co., Ltd), utilizing an optimized version of the Hughson–Westlake ascending-descending method of determining thresholds (equipment algorithm patent number: 202111237394.9).
Procedure
A brief case history was obtained, including age and sex, followed by otoscopy and tympanometry to exclude participants with external and middle ear diseases. Pure-tone air conduction hearing thresholds were obtained under below conditions: (1) professional audiologist testing using the Conera clinical audiometer in a certified standard hearing room (<30 dBA), (2) AA in a certified standard hearing room (<30 dBA), and (3) AA in a room with background noise of 40–45 dBA. According to the noise environmental quality monitoring and evaluation of level 0 functional areas (community convalescent environment) in China, the environmental quality standard for noise (GB 3096–2008) requires the noise limit to be between 40 and 50 dB HL. Thus, we set the background noise to 40–45 dB which was generated using white noise, with decibel levels continuously monitored in real time using a sound-level meter (ling WAVES SPL meter II).
All participants were tested by the same audiologist (MA group) or graduate students (AA and AA-N group). All three hearing measurements included octave and interoctave frequencies between 250 and 8000 Hz per ear. The AA was controlled using a proprietary PC-based software application. Participants were asked to choose whether to hear a sound or not in the headset, and the application subsequently analyzed their choices and provided the results. The participant's test time for each ear and comfort scores for the three test procedures was recorded. After all participants completed the three audiometric test procedures in a random order, they rated their preference for manual or automated threshold operations. At the end of each test, participants were asked to rate the overall comfort separately with three different tests (five-point scale: 1 = extremely uncomfortable, 5 = extremely comfortable). The examiner and audiologist were blinded to the results obtained from the three conditions to reduce tester bias. To achieve this, an independent graduate student assisted in recording the results.
Tinnitus follow-up survey was conducted by phone to check whether the participants had tinnitus, and to ascertain the duration, side, and nature of tinnitus.
Data analysis
Data were analyzed using IBM SPSS statistics, version 22.0 for Windows. Data were analyzed using IBM SPSS statistics version 22.0 for Windows. We performed a descriptive analysis of all hearing threshold data, test time, and preferences. The PTA calculation method involved averaging the hearing thresholds at various frequencies (500 Hz, 1000 Hz, 2000 Hz, and 4000 Hz) to determine the overall average hearing threshold. Statistical differences in threshold, test time, and preference between MM and AA and AA-N, respectively, were analyzed by paired t-test. And the Pearson correlation coefficient (R) between various conditions was determined. Correlation coefficient is interpreted as very weak (0.0–0.19), weak (0.2–0.39), moderate (0.4–0.59), strong (0.6–0.79), and very strong (0.8–1.0). Bland–Altman plot analysis was used to plot the consistency of AA and AA-N with MM detection, respectively. Statistical significance was set at p < 0.05. Reporting of this study conforms to STROBE guidelines. 12
Results
Descriptive statistics
A total of 150 participants were recruited and tested, and 295 ears were included in the analysis. The participant characteristics are summarized in Table 1. The participants were 57.3% female and 42.7% male, with a mean age of 41.03 years (range: 11–84 years). A total of 239 ears had a bilateral difference of <40 dB HL, and 56 ears had a bilateral difference of ≥40 dB HL. In the group with a bilateral difference <40 dB HL, 126 (53%), 46 (19%), 42 (18%), 22 (9%), and 3 (1%) ears had a PTA of ≤25 dB HL, 26–40 dB HL, 41–60 dB HL, 61–80 dB HL, and >80 dB HL hearing loss, respectively (Figure 1).
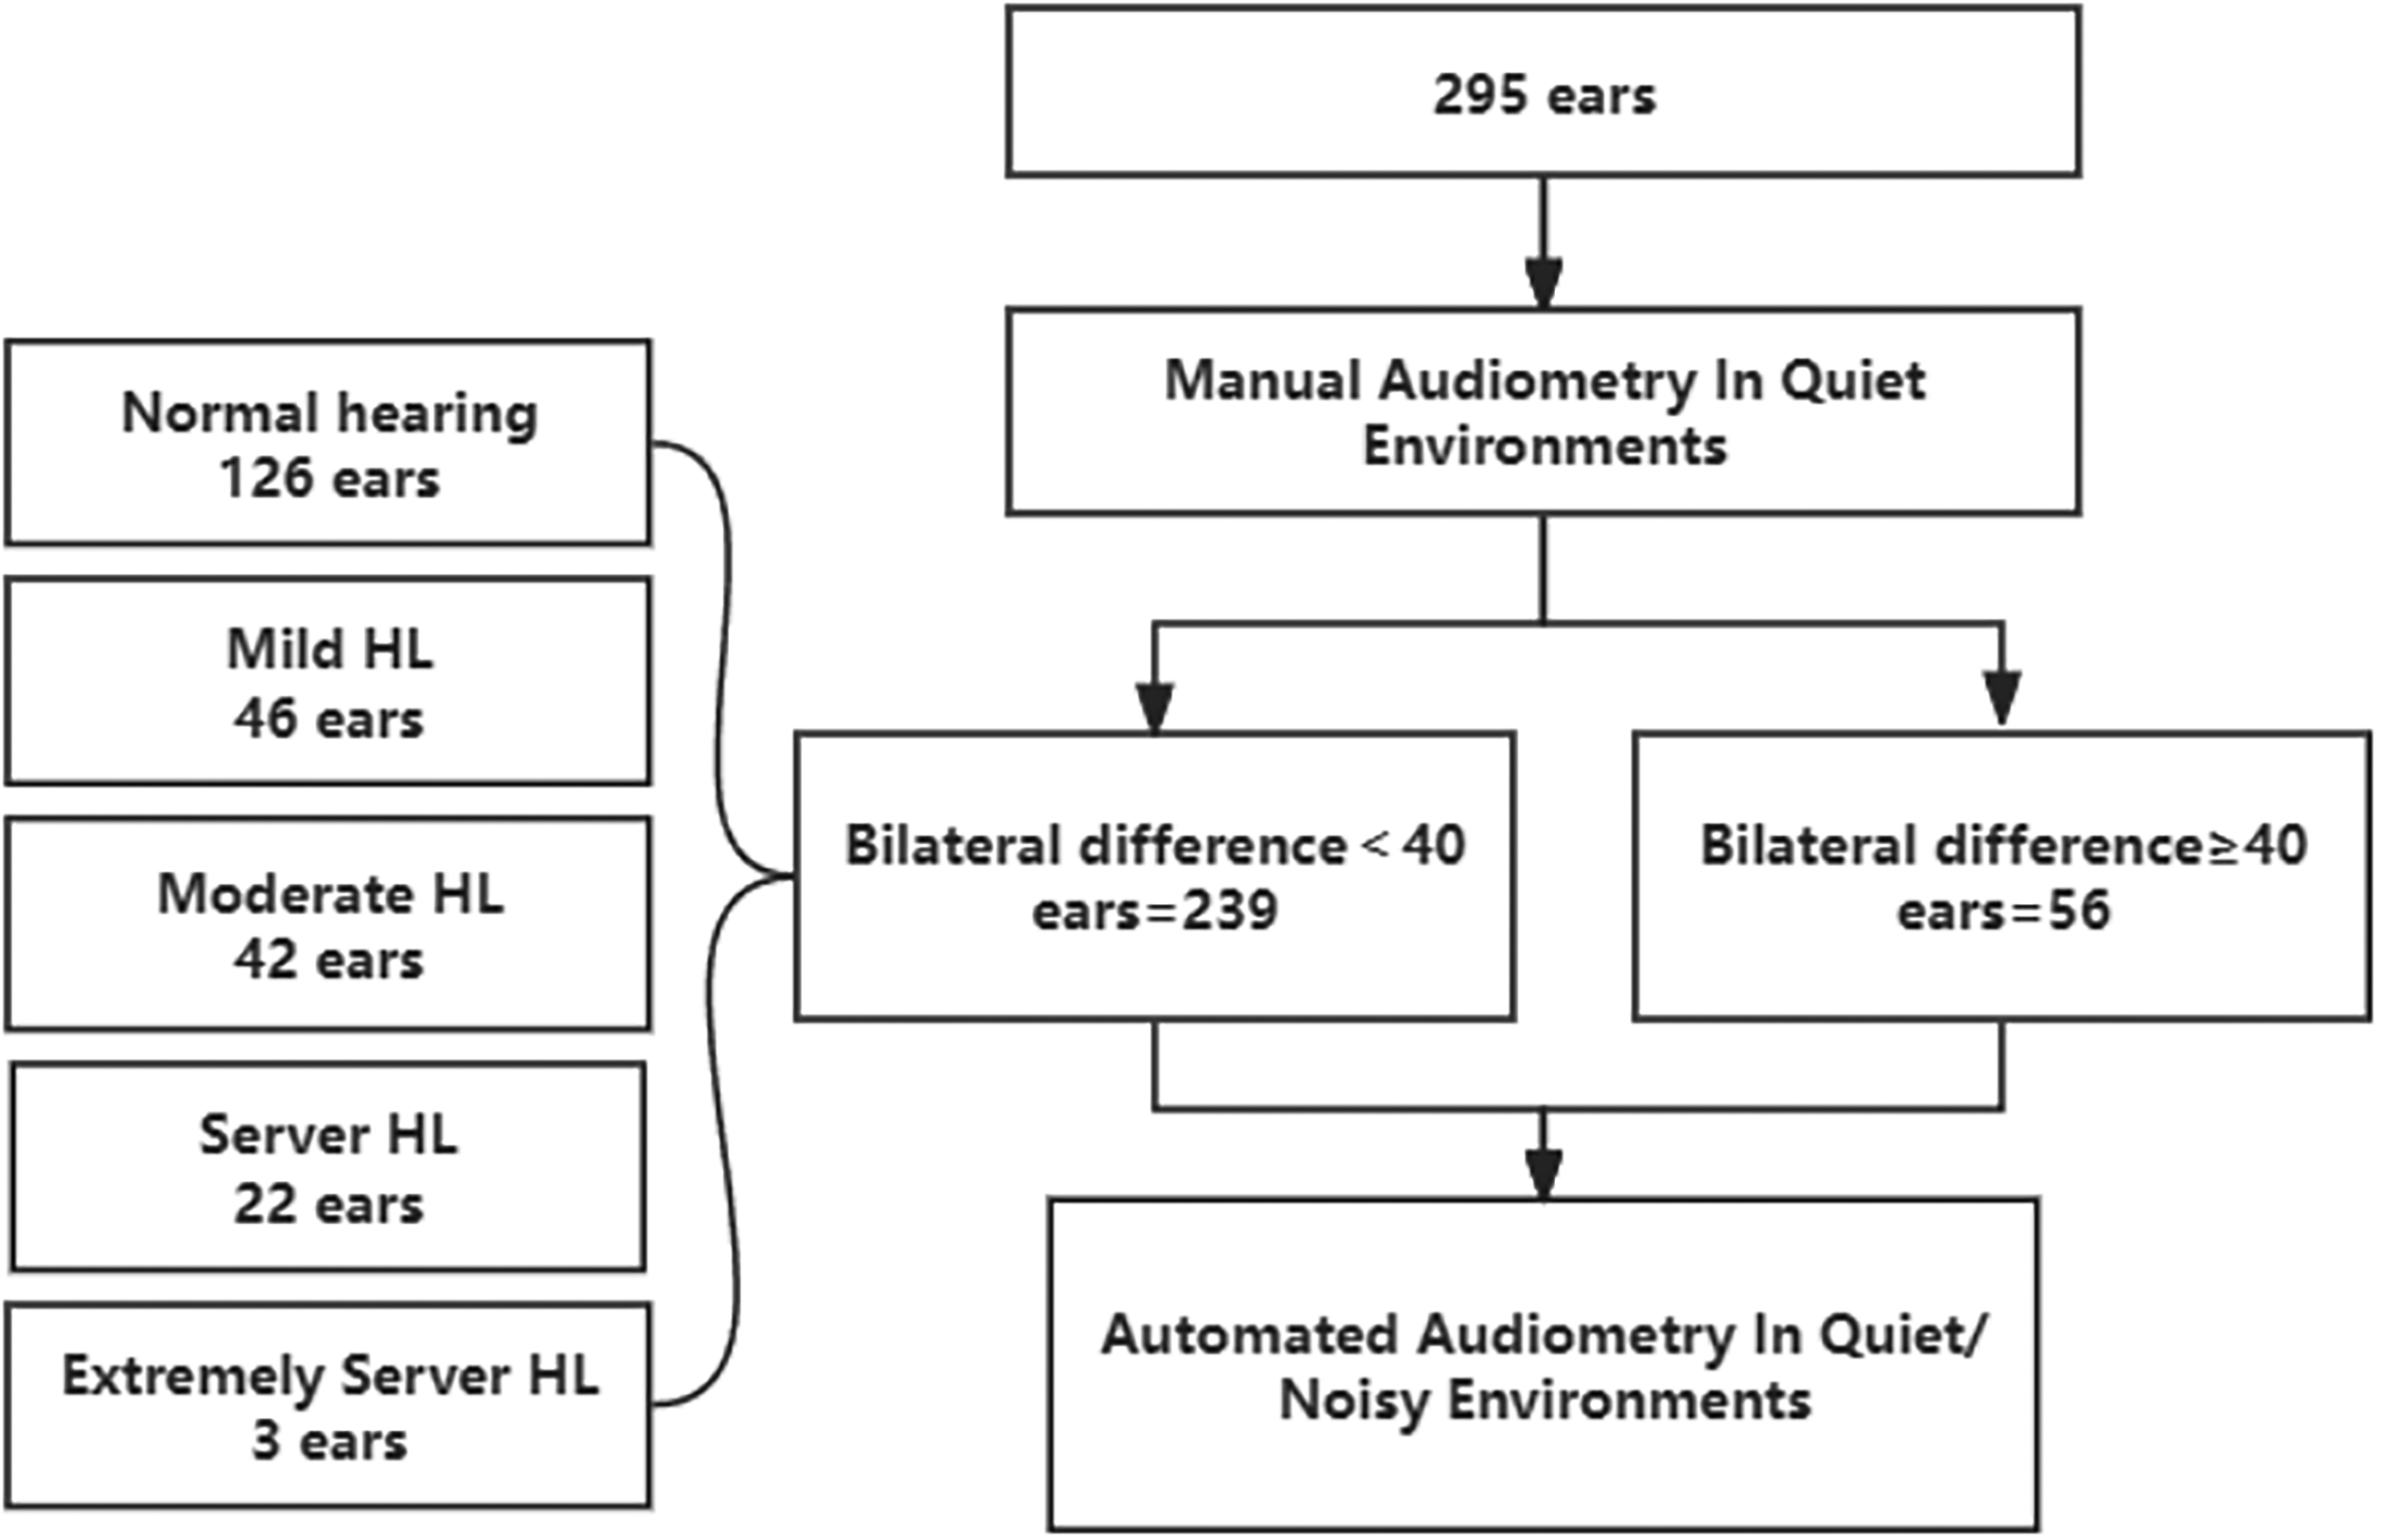
Flow diagram of participants.
Patient characteristics.

Accuracy and test time of hearing thresholds in participants without hearing loss
The hearing thresholds in participants without hearing loss obtained by AA in quiet (AA) and noisy (AA-N) were compared with those obtained by MA. The three testing conditions had a statistically significant difference at 0.25 kHz (p < 0.05), while there was no statistically significant difference at the other frequencies (0.5, 1, 2, 4, and 8 kHz) (Figure 2(a)). The average threshold differences between MA, AA, and AA-N across all frequencies were very small in participants without hearing loss (Table 2). Additionally, based on the Bland–Altman analysis, the AA-N and AA methods showed consistent performance compared to MM across all frequencies in 95% of the data (Figure 2(b) and (c)). The test time required for participants without hearing loss under the MA, AA, and AA-N conditions is shown in Table 2. The average duration of MA and AA was slightly lower; however, this was not statistically significant (p > 0.05). In addition, the average duration of AA-N was longer than that of MA (p < 0.01). Regarding the correlation coefficients, the correlation between MA and AA (0.66) was slightly better than that between MA and AA-N (0.51) among participants without hearing loss. Further, we conducted a paired t-test to perform the following comparisons: MA versus AA, MA versus AA-N, and AA versus AA-N. The results, summarized in Table 3, revealed that all p-values were greater than 0.05, indicating no significant between-group differences. After completing the tests, the score of comfort of three testing conditions showed no preference (Table 2).

Assessment of the consistency among three testing conditions in participants with normal hearing. (a) Threshold at different frequencies of participants without hearing loss under different testing conditions. (b–c) Bland–Altman plots of the difference in pure tone of 0.25, 0.5, 1, 2, 4, and 8 kHz were obtained with MM versus AA and MM versus AA-N. The dashed lines show the upper and lower limits of agreement, that is, the mean difference ±1.96SD, within which 95% of differences are expected to fall. MA: manual audiometry; AA: automated audiometry system in quiet environments; AA-N: automated audiometry system in noisy environments. The data are expressed as mean ± SD. *p < 0.05 analyzed by paired t-test.
Comparison of hearing level, test time, and preference scores according to frequency in participants without hearing loss.

Groups: MA: manual audiometry; AA: automated audiometry system in quiet environments; AA-N: automated audiometry system in noisy environments; dB: decibel; kHz: kilohertz; Preference scores: Five-point scale; 1 = extremely uncomfortable, 5 = extremely comfortable.
Correlations between MA, AA, and AA-N for patients without hearing loss (n = 126 ears).

MA: manual audiometry; AA: audiometry system in quiet environments; AA-N: audiometry system in noisy environments; PTA: pure-tone audiometry.
Accuracy and test time of hearing thresholds in participants with hearing loss
The hearing thresholds in participants with hearing loss obtained by AA in quiet (AA) and noisy (AA-N) were compared with those obtained by MA. No statistically significant difference was observed among the three testing conditions at all frequencies (p > 0.05) (Figure 3). Specific data can be found in Table 4. Regarding the average test time under MA, AA, and AA-N in participants with hearing loss, the average test time was reduced for MA in the mild hearing loss group compared to the AA and AA-N groups (p < 0.05); however, no significant difference was observed in the severe hearing loss and extremely severe hearing loss groups (p > 0.05) (Table 4). The correlation coefficients between MM versus AA, MM versus AA-N, and AA versus AA-N were all above 0.8 (Table 5). Furthermore, after completing the tests, the comfort score of the three testing conditions showed no preference (Table 4).

Hearing thresholds in participants with hearing loss. Threshold at different frequencies of participants with hearing loss under different testing conditions. MA: manual audiometry; AA: automated audiometry system in quiet environments; AA-N: automated audiometry system in noisy environments.
Comparison of hearing level, test time, and preference scores according to frequency in participants with hearing loss.

MA: manual audiometry; AA: audiometry system in quiet environments; AA-N: audiometry system in noisy environments; Preference scores: Five-point scale; 1 = extremely uncomfortable, 5 = extremely comfortable.
Correlations between MA, AA, and AA-N for patients with hearing loss.

MA: manual audiometry; AA: audiometry system in quiet environments; AA-N: audiometry system in noisy environments; r: Pearson's correlation coefficient.
Accuracy of hearing thresholds in participants with a bilateral difference ≥40 db HL
To evaluate the masking function of the audiometric device under the condition of a bilateral difference ≥40 dB HL, we observed that the mean differences between the hearing threshold of the test ear measured by the audiometric devices (AA and AA-N) and MM for bilateral differences ≥40 dB HL, finding that both fall within the 95% confidence interval, indicating good consistency between AA and MM, as well as AA-N and MM. Additionally, the hearing threshold difference between the MM versus AA and MM versus AA-N was within ±15 dB HL (Figure 4(a) and (b)). Furthermore, we found that the hearing thresholds of the poor hearing ear in the MA, AA, and AA-N groups were not statistically significant, except at 4 kHz (Figure 4(c)).

Accuracy of hearing thresholds in participants with a bilateral difference ≥40 dB HL. (a–b) Bland–Altman plot for the variability of MM versus AA and MM versus AA-N under the condition of a bilateral difference ≥40 dB HL. The dashed lines show the upper and lower limits of agreement, that is, the mean difference ±1.96SD. (c) Hearing threshold at different frequencies of poor hearing in participants with a bilateral difference ≥40 dB HL under different testing conditions. (d) The hearing thresholds of the poor ear in MA, AA, and AAN were not statistically significant at a frequency of 4 kHz in participants without tinnitus. MA: manual audiometry; AA: automated audiometry system in quiet environments; AA-N: automated audiometry system in noisy environments.
We further compared the correlation coefficients at 4 kHz and found that the correlation of MA and AA and the correlation of MA and AA-N were 0.90 and 0.86, respectively (Table 6). To further exclude the effect of tinnitus, we gathered data on participants with a bilateral hearing threshold difference of ≥40 dB HL. Our analysis revealed that the hearing thresholds of the poorer ear in the MA, AA, and AA-N groups did not show statistically significant differences at the 4 kHz frequency (Figure 4(d)).
Correlations of 4000 Hz threshold between MA, AA, and AA-N (n = 56 ears).

MA: manual audiometry; AA: audiometry system in quiet environments; AA-N: audiometry system in noisy environments; r: Pearson's correlation coefficient.
Discussion
There is a general lack of appropriate hearing health professionals and infrastructure in low- and middle-income countries; as such AA equipment may provide initial hearing screening for communities lacking professional audiologists and standard hearing examination room. 15 The mobility of hearing equipment allows for a wider penetration of hearing medical services. Our research aimed to compare the pure-air tone threshold obtained by AA with the pure-air tone threshold obtained by traditional MA and verify the accuracy of the AA system in quiet (AA) and noisy (AA-N) environments.
Our current data showed no statistically significant differences in the frequencies of 0.5, 1, 2, 4, and 8 kHz, except at a low frequency (0.25 kHz; p < 0.05). The results indicated that air conduction PTA of AA and AA-N was reliability equivalent to that of MA. Furthermore, >94.5% and 96% of the threshold comparison differences for MA versus AA and AA versus AA-N were within ≤10 dB HL at the other frequencies (0.5, 1, 2, 4, and 8 kHz), respectively. These results are almost identical to the previously reported results. Using the KUDUwave 5000 testing equipment, Swanepoel reported that 97% of participants with normal hearing were within 15 dB HL of the conventional thresholds. 16 Similarly, Bean reported that 95.8% of automated thresholds were within 10 dB HL of the conventional thresholds. In addition, 93.3% of the automated thresholds were within 10 dB HL in a noisy environment using the iOS-based OtoKiosk. 9 In the clinical diagnosis process, a hearing threshold change of 10 dB HL or less between the two hearing assessment methods is considered acceptable. 4 In our study, participants ranged in age from 11 to 84 years, with no children included. In contrast, Margolis has reported that AMTAS produces accurate air-conduction audiograms in a high proportion of children aged 4–8 years, as well as in adults. However, Margolis's study specifically demonstrated that AMTAS is effective for children and adults. 17
Additionally, no significant difference in test duration was found between the MA and AA groups. These findings agree with those reported by Swanepoel et al. 16 However, there was a significant difference in test duration between the MA and AA-N groups. Inconsistent with the literature, participants did not prefer these three test conditions. It is possible that automatic hearing testing equipment ranks behind in the detection process, and older people may have an unclear understanding of the operation of automatic hearing testing equipment. The current research results proved the reliability and accuracy of AA as a diagnostic tool for normal hearing in quiet and noisy environments. Next, we assessed participants with impaired hearing under these three conditions. We found that participants with hearing loss and those without had the same outcomes, which is consistent with the findings of Bean et al., who reported similar accuracy results for participants with hearing loss and those without. 9
This study was the first to compare participants with a bilateral difference ≥40 dB HL. In these participants, we evaluated the threshold differences for the poor hearing ear between MA, AA, and AA-N, respectively. The hearing thresholds of the poor hearing ear in the MA, AA, and AA-N groups were not statistically significant, except at 4 kHz. It has previously been reported that tinnitus affects hearing test results. 14 So we excluded participants with tinnitus, we found that the hearing thresholds of the poor hearing ear in the MA, AA, and AA-N groups were not significantly different at a frequency of 4 kHz. Therefore, the results demonstrate that when participants have hearing loss accompanied by tinnitus, the algorithm for automatic hearing devices needs to be corrected, which is an important issue that needs to be solved in future studies. However, in contrast, a recent report using mobile apps found that AA in patients with tinnitus is consistent, 18 which may be due to the participants wearing a headset and the environment in which the test is performed.
Conclusion
Automated audiometry is a reliable and accurate method of hearing assessment, offering a viable solution in regions with limited access to hearing health professionals. However, this study faces several limitations. Firstly, the absence of bone conduction test results restricts the ability of AA and AA-N to distinguish between different types of hearing loss. Future research should therefore incorporate bone conduction testing and masking techniques to enhance diagnostic accuracy. Additionally, exploring the integration of advanced features such as real-time noise monitoring and improved data management within the application is recommended. Secondly, the relationship between tinnitus-specific quantification and hearing assessment outcomes requires further investigation to better understand the impact of tinnitus on the accuracy of hearing detection accuracy.
Footnotes
Acknowledgments
The authors are grateful to the participants who took part in the study.
Author contribution
YY contributed to the study design, organized the database, and wrote the first draft of the manuscript. XRW performed the statistical analysis. QX collected the participant information of participants. GXX contributed to the study's conception, supervision, project administration, and acquisition of funding.
Consent to participate
All participants provided informed consent prior to participation.
Consent for publication
Written informed consent to publish was obtained, but the written consent itself should be held by the investigators.
Data availability statement
The data from this study will be made available on request.
Declaration of conflicting interests
The author(s) declared no potential conflicts of interest with respect to the research, authorship, and/or publication of this article.
Funding
The author(s) disclosed receipt of the following financial support for the research, authorship, and/or publication of this article: This study was supported by grants from the Science Plan Fund of Guangzhou (grant no. 202103000079), and the National Key Research and Development Program of China (grant no. 2020YFC2005204).
Ethical considerations
This study was conducted in accordance with the Declaration of Helsinki. The studies involving human participants were reviewed and approved by the Ethics Committee of The First Affiliated Hospital of Sun Yat-sen University (No[2020]062). The patients/participants provided their written informed consent to participate in this study.