
Abstract
As urbanization in China continues to rise, an increasing number of cities are constructing subway tunnels. However, due to the complexity and ambiguity of subway tunnel construction, there is a lack of precise methods to assess the impact of these constructions on surrounding buildings. Consequently, this study analyzes and summarizes past experiences and proposes the IVTSFS-CPT-EDAS model based on the CPT-EDAS evaluation method. This model establishes a risk assessment approach specifically for the impact of subway tunnel construction on existing buildings. The model's process was validated through a real-world case study, including a sensitivity analysis to verify its effectiveness and feasibility. The findings of this study indicate: (1) The IVTSFS-CPT-EDAS model can more comprehensively and delicately replicate the actual decision-making environment, enhancing the accuracy of the model. (2) The analysis of expert evaluations indicates that improper material and equipment configuration, inadequate excavation pressure control, and non-compliance of the stratum solubility coefficient with requirements are the primary risk factors affecting the building. (3) The advantages of the proposed model over other approaches and the accuracy enhancement of the assessment results due to the improvements in the evaluation method were demonstrated through sensitivity analysis and comparative evaluation. This research is expected to provide valuable insights for the scientific management of the impacts of subway tunnel construction on nearby structures.
Keywords
Introduction
With the rapid urbanization in China, an increasing number of cities are constructing or planning extensive metro tunnel networks to accommodate growing urban populations. 1 The shield method, known for its advantages over traditional methods, is predominantly employed in these constructions.2–4 However, this method introduces complexities and uncertainties, particularly in the disturbance of surrounding soil layers during construction, leading to surface settlements and potential impacts on nearby buildings.5,6 Therefore, it is critically important for managers to evaluate the risks to existing buildings within the affected area and to develop appropriate risk control measures scientifically and effectively (Table 1).
List of acronyms.

List of acronyms.
Recent research has increasingly focused on the effects of metro tunnel construction on existing buildings. Studies typically employ a range of methodologies, including empirical formulas, 7 analytical theoretical methods, 8 and numerical analyses. 9
The methods, along with their respective advantages and disadvantages, are summarized in Table 2. However, these methods require further improvement in handling ambiguity and do not consider the psychological behaviors of managers during decision-making. Therefore, this paper integrates IVTSFS with Prospect Theory to enhance the accuracy of the evaluation model.
Related studies.

These methodologies provide valuable frameworks for assessing risks associated with metro tunnel construction. However, they also exhibit certain limitations. For example, FS and PyFS may not fully capture the risk perceptions of managers, potentially compromising the accuracy and reliability of the assessments. Additionally, while the extended VIKOR model addresses some uncertainties of the risk assessment process, its methodological constraints can limit the appropriateness of indicator weights. These gaps underscore the need for further refinement in risk assessment models to ensure more accurate and dependable evaluations of the impacts of metro tunnel construction on existing structures.
In summary, the primary challenges in the current risk assessment of tunnel construction on existing buildings are as follows: (1) Most existing methods fail to accurately capture the ambiguity and uncertainty associated with risk factors during metro tunnel construction, often leading to imprecise and unreliable assessments. (2) These methods typically overlook the psychological state of decision-makers, which can result in a significant disconnect between the model outcomes and real-world scenarios. (3) Additionally, the interdependencies among risk indicators are frequently ignored, potentially underestimating the aggregate risk when focusing solely on individual factors.
This paper contributes a novel risk assessment model tailored for evaluating the impacts of tunnel construction on existing buildings. The approach begins by establishing a comprehensive risk evaluation system. Utilizing the improved IVTSFS-CRITIC model, it determines the weights of attributes while accounting for both the evaluation information of each attribute and the correlations among them. Secondly, the IVTSFS-CPT-EDAS model addresses the inherent uncertainty, ambiguity, and randomness in risk analysis, while fully considering the psychological state of decision-makers. This integration harnesses the strengths of each theory to enhance the reliability and accuracy of risk assessments.
The practical application of this model to the risk assessment of metro tunnels impacting existing buildings during actual construction further validates its rationality and feasibility. Based on these assessments, targeted risk control measures are recommended. The results significantly bolster the manager's capability to oversee metro tunnel projects, marking a substantial advancement in the theoretical and practical aspects of risk management.
This study introduces a novel risk assessment model that significantly enhances the management of risks associated with metro tunnel construction impacting existing buildings. The model integrates two innovative approaches: the IVTSFS-CRITIC and IVTSFS-CPT-EDAS. The former effectively captures the interdependencies among risk indicators for more precise attribute weighting, while the latter incorporates the psychological state of decision-makers, ensuring a more accurate reflection of the actual decision-making environment. This dual approach not only improves the accuracy and practicality of the model but also includes an innovative method for determining expert weights based on IVTSFS fuzzy similarity, which retains a broader spectrum of evaluation information.
The structure of the paper is methodically organized into several sections: Theoretical developments in risk and uncertainty decision making section reviews related literature and establishes the study's rationale; Risk analysis methodology section 3 details the analytical methods employed; Risk assessment based on the CPT-IVTSFS-EDAS method section 4 develops the risk assessment model; Analysis example section applies this model to a real case and explores its sensitivity. The final section not only summarizes the key findings of the study but also suggests directions for future research, emphasizing the theoretical and practical significance of the advancements in risk management for metro tunnel projects. The specific procedure for risk assessment of existing structures affected by subway tunnel construction is depicted in Figure 1.

Risk assessment algorithm workflow.
Theoretical developments in risk and uncertainty decision making
CPT
There are two principal theories of risky decision-making in uncertain environments. The first is the expected utility theory (EUT), which posits that individuals are perfectly rational when making decisions under risk, a notion widely accepted in scholarly circles prior to the advent of PT. Developed in 1972 by Tversky and Kahneman,
13
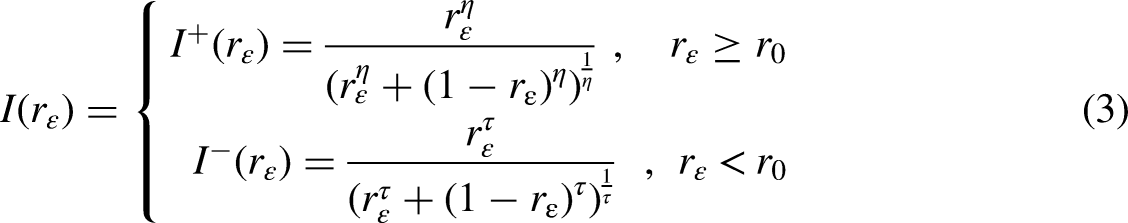
PT builds on the concept of ‘bounded rationality’ and introduces the influence of a decision-maker's risk preferences by comparing reference points. Specifically, it addresses how decision-makers perceive ‘losses’ and ‘gains differently,’ thereby integrating a psychological dimension into risk assessment, which aligns more closely with real-world scenarios. In 1992, Tversky and Kahneman further advanced their theory by proposing the CPT. Enhanced by extensive empirical data, CPT extends PT's applicability to decision-making scenarios involving a wide range of potential outcomes and addresses the issue of stochastic dominance. The prospect function P(z), defined in reference,
14
combines the outputs of a value function V(zɛ), and a weighting function, I(rɛ) and is expressed as

IVTSFS
In 1965, Zadeh introduced the concept of FS, 15 which expanded the traditional eigenfunctions of classical set theory. Unlike classical sets that assign elements either 0 or 1, representing absolute non-membership or membership, fuzzy sets allow for degrees of membership across a continuous spectrum from 0 to 1. This range indicates the degree to which an element X belongs to set A, with values closer to 1 indicating higher degrees of membership. The degree of non-membership is calculated by subtracting the membership value from 1.
In 1986, Atanassov16,17 independently worked on the non-membership in fuzzy sets and extended the FS theory to obtain IFS, for both membership and non-membership values are given by the experts’ independent evaluations, but the given values of membership and non-membership are restricted to be expressed by all real numbers in the closed interval [0,1]. Assuming that μ and ν represent the degree of membership and non-membership, respectively, the sum of membership and non-membership also belongs to real numbers in the closed interval [0,1], i.e.
In the environment of IFS, the sum of μ and ν values is restricted to the interval [0,1]. This restriction limits the freedom of these values within the [0,1] range. For instance, when μ = 0.6 and ν = 0.7, their sum of 1.3 exceeds the permitted range, thus facing constraints. To address this issue, Yager introduced the PyFS in 2013. 23 This model expands the expression range of membership and non-membership by constraining the sum of their squares within the closed interval [0,1], specifically sum (μ², ν²) ∈ [0,1]. This allows for a more flexible representation of data, better accommodating complex and uncertain systems.
In the application of FS to practical cases, the inherent asymmetry and ambiguity of information often render it challenging to precisely express membership, non-membership, and hesitancy of an element to a set using exact values. Building on the principles of FS, researchers have proposed the use of interval numbers instead of precise values to represent these fuzzy set attributes. This approach not only aligns more closely with the expression expectations during expert evaluations but also reduces the loss of information during the decision-making process. Consequently, numerous researchers have extended the original FS framework to include models such as IVFS, 16 IVPyFS, 24 IVq-ROFS, 25 and IVPFS. 26 These enhancements improve the practical application of FS by accommodating the nuanced realities of expert assessments and decision-making complexities.
In 2018, Mahmood et al.
27
proposed the SFS and the TSFS, enhancing the representation of fuzzy decision-making information. In the SFS framework, membership (μ), hesitancy (π), and non-membership (ν) are constrained such that the sum of their squares (
For instance, consider the values μ = 0.6, π = 0.3, and ν = 0.5; their sum equals 1.4, which exceeds the expressive capacity of the standard PFS. However, for SFS, sum (0.62,0.32,0.52) = 0.7 < 1, thus meeting the constraint conditions and being representable. Similarly, for μ = 0.6, π = 0.5, and ν = 0.7, their squares’ sum is 1.1, exceeding SFS's capacity, but under TSFS with q = 3, sum (0.63,0.53,0.73) = 0.684 < 1, satisfying the constraints. Therefore, TSFS demonstrates a more powerful capability for expressing fuzzy decision-making information.
Compared to other FS, TSFS boasts a more robust and flexible range and mode of expressing fuzzy information. They can represent the fuzzy decision-making evaluation information in complex real-world environments more completely and objectively. Moreover, IVTSFS aligns more closely with experts’ cognitive habits when evaluating fuzzy decision-making information, thereby reducing the loss of evaluation data. In practical applications within complex real-world settings, IVTSFS demonstrate greater utility compared to other fuzzy sets.
EDAS
Keshavarz et al. 28 introduced the EDAS method in 2015. It is specifically designed to rank solutions by evaluating their distances from the average solution, effectively highlighting the strengths and weaknesses of each alternative through the calculation of forward and backward distances. This method distinctively characterizes the disparities between alternatives, in contrast to methods like TOPSIS and VIKOR, which depend on calculating distances from the extreme values of solutions for ranking purposes. However, reliance on extreme values can lead to inaccurate outcomes if these extremities are not precisely defined or calculated. 29 EDAS offers a more robust alternative by integrating both qualitative and quantitative data, thus making it adaptable to a wide range of decision-making scenarios of varying types and sizes. By focusing on the relative differences as compared to the average, EDAS adeptly manages uncertainty and ambiguity within the decision-making process, thereby enhancing its utility in situations where exact extremities are difficult to determine.
Risk analysis methodology
IVTSFS
For any non-empty set X, the form of the T-SFS can be defined as

Let 
Let If If If
If
If
IVT-SFS
For any non-empty set X, the form of the IVT-SFS can be defined this way:
Depending on the context, different instances of IVTSFS can be considered as distinct types of FS.
TSFS: If we consider IVTSFS: If we consider SFS: If we consider IVPFS: If we consider: PFS: If we consider IVq-ROPFS: If we consider q-ROPFS: If we consider IVPyFS: If we consider PyFS: If we consider IVFS: If we consider IFS: If we consider IVFS: If we consider FS: If we consider
Let 


Let 

Let A and B be an element of IVTSFS(X), and let D be a mapping defined as D: IVTSFS(X)×IVTSFS(X)→ [0,1]. If it satisfies the following conditions: (1)
Let 
Let 
Let 
After Bonferroni 37 introduced the classic Bonferroni mean (BM) operator, Xu and Yager 38 proposed the BM operator for aggregating intuitionistic fuzzy information, considering the correlation of each attribute during the aggregation process. Yager 39 further introduced the Ordered Weighted BM operator and the Bonferroni Integral operator. The definition of the BM operator is as follows:
For any 
Assume 
The core of the BM operator is the interaction between the parameters; therefore, the WIBM operator focuses on the interaction between weighted parameters rather than the attributes themselves. It is important to note
Risk analysis methodology
Attribute weight determination method based on IVTSFS-CRITIC
The CRITIC method was initially proposed by Diakoulaki et al. 41 This method determines attribute weights while comprehensively considering the evaluation information of each attribute and the degree of correlation between attributes. Wu et al. 42 improved the CRITIC method, using the revised coefficient evaluation method to determine attribute weights. The specific steps are as follows:
Step 1: Assume there are n feasible alternative solutions 


Step 4: Calculate the independence coefficients for all indicators. The independence coefficient is primarily used to measure the degree of correlation among the evaluation indicators. To determine the weights of the evaluation indicators, it is first necessary to obtain the correlation coefficients between the indicators and then use these coefficients to calculate the independence coefficients for each indicator. (1) First, we calculate the Pearson correlation coefficients between the evaluation indicators, resulting in a correlation coefficient matrix.
Secondly, based on the correlation coefficient matrix, the independence coefficient for each attribute can be calculated.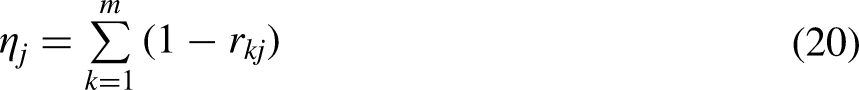
Determining expert weights
To improve the accuracy of expert weight assignment, instead of assigning the same weight to all experts based on subjective assessment or evenly, this section proposes an innovative method to determine expert weights based on the interval value T-spherical fuzzy similarity, and at the same time, make it express more evaluation information.
Problem description: suppose a multi-attribute decision-making problem with 
Linguistic scale for alternative selection. 43

Here the horizontal of the matrix is the programme and the vertical is the experts. The experts are represented by the set
The specific steps of the method are shown below:
Step 1: Calculate the average evaluation values 

Step 3: Calculate the overall similarity for each expert under the attribute C
L
.

Risk assessment based on the CPT-IVTSFS-EDAS method
Establishment of a risk indicator system constructing
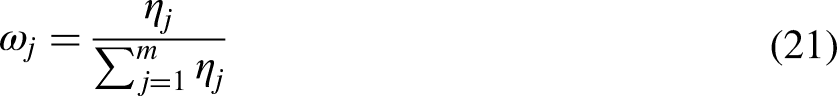
An accurate risk assessment indicator system is a crucial foundation for evaluating the risks posed by subway tunnel construction to existing structures. It is also an essential step in the entire risk management process. During the excavation of subway tunnels, numerous unforeseeable risk factors exist that can lead to tilting and deformation of buildings within the construction impact area, posing a threat to personal safety. This paper analyzes the impact of subway tunnel construction on existing structures from four aspects: natural conditions, tunnel characteristics, construction technology, and construction management. Subsequently, a risk assessment indicator system for the impact of subway tunnel construction on existing structures is established using the aforementioned information, as detailed in Tables 4 and 5.
Summary of risk factors contributing to prefabricated building construction.
Risk Assessment indicator system.

EDAS method steps based on CPT-interval value T-spherical fuzziness
Problem Description: Assume in a multi-attribute decision-making problem, there are

Model calculation steps.
Step 1: If 
Step 3: Compute the weights of experts according to the formula.
Step 4: Aggregate the decision matrix. Use the operator to aggregate the evaluation matrix given by three experts.
Step 5: According to the definition of the EDAS method, it is necessary to determine the average solution for all criteria, as shown in the following equation:

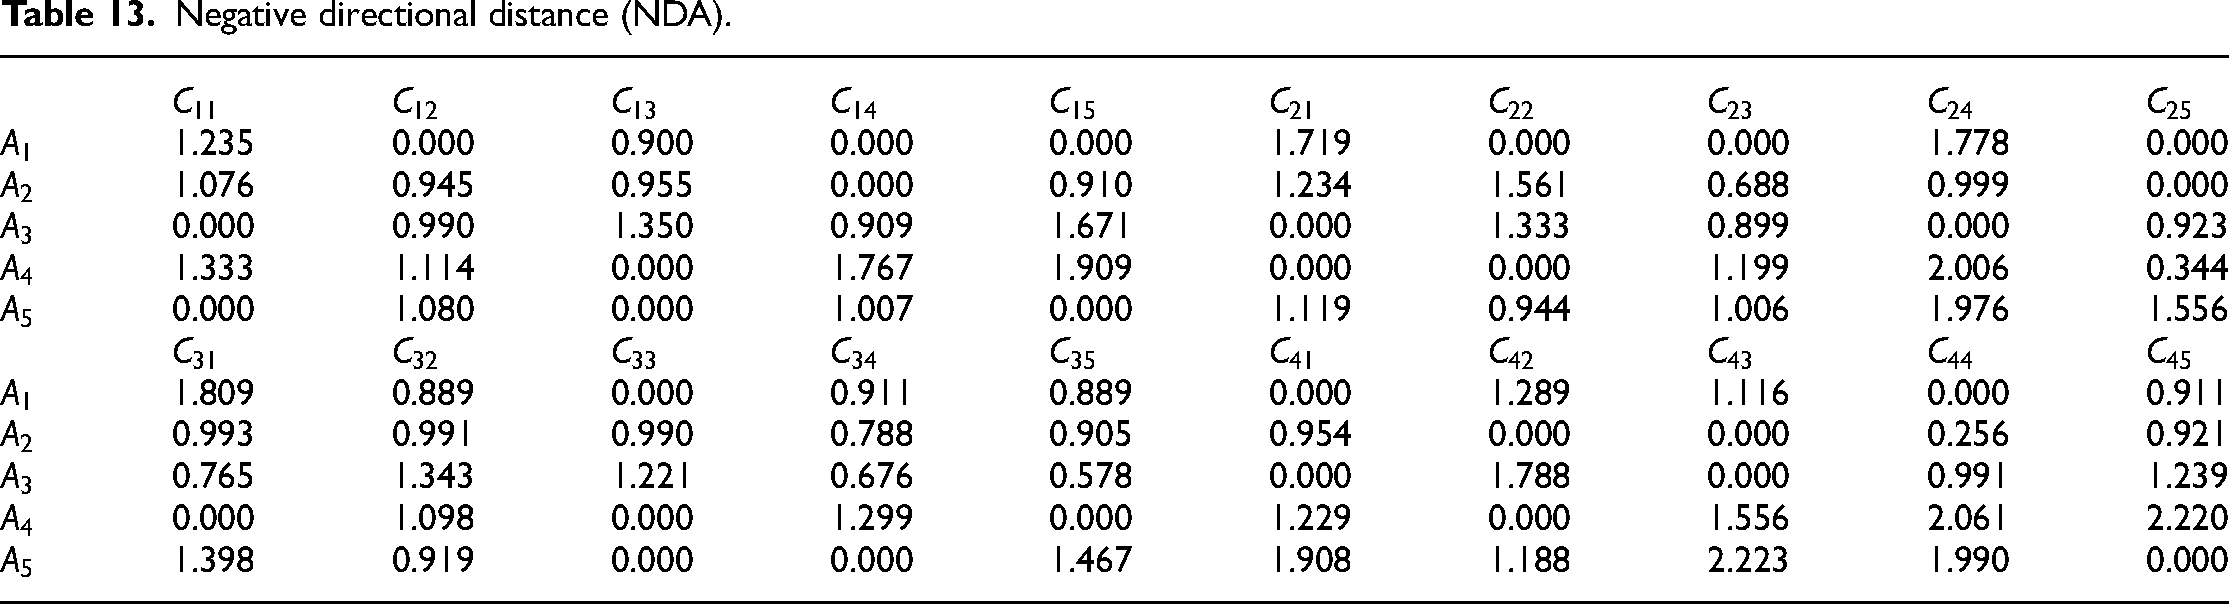
(NDA) Matrix, as shown in the equation below:

Step 8: Obtain the weighted sum of the positive distance and negative distance of the average matrix: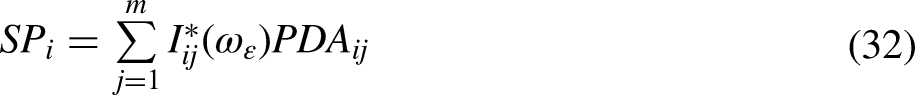


Step 11: Rank the alternative options based on the decreasing values of the evaluation scores
Analysis example
To validate the effectiveness of this method, we will use a practical example based on the actual results of a risk assessment for existing buildings affected by subway tunnel construction and propose corresponding risk control measures.
Project overview
This project is part of the Shanghai Urban Rail Transit Airport Link Line project, which commenced construction on June 28, 2019. Spanning 68.6 kilometers, it passes through three administrative districts. A unique feature of this project is its integration of Shanghai's Metro Lines 2, 9, 10, 15, and 17. However, this also represents the project's greatest challenge: the need to constantly monitor buildings within the engineering impact area, especially the already constructed metro lines, to prevent tilting of buildings and interference with the operation of other metro lines. To mitigate the construction's impact on buildings within the tunnel's vicinity, the managers invited three experts to select the most rational plan from the five alternatives A1, A2, A3, A4, and A5.
Shanghai is situated in the eastern coastal region of China, characterized by flat terrain and soft alluvial deposits formed by the Yangtze River Delta. The region experiences a subtropical monsoon climate with an average annual temperature of approximately 17 °C and average annual precipitation exceeding 1000 mm. The population of Shanghai exceeds 24 million, with dense urban infrastructure and a high concentration of economic activities, including commerce, finance, and manufacturing.
The geological conditions in Shanghai present significant challenges for metro construction. The primary geological feature is the predominance of soft clayey soils and silty sediments, which have low bearing capacity, high compressibility, and are prone to settlement. The region lacks stable bedrock near the surface, and the depth to competent strata can exceed 50 m. Groundwater conditions further complicate construction, as the water table is generally high, with artesian pressures often encountered during excavation. This increases the risk of water ingress and soil instability.
Parameter determination
Step 1: Form a decision matrix.
Step 2: Calculate the weights of each risk factor
Determination of Weights for Risk Factors: Three experts were invited to score the various risk factors, as detailed in Tables 6–8. The experts’ evaluations were collected to form an initial linguistic evaluation matrix.
Linguistic evaluation matrix of the first expert.

Linguistic evaluation matrix of the second expert.

Linguistic evaluation matrix of the third expert.

Based on trademark data, it was determined that 2 = 3. Consequently, this value was substituted into Equations (13)–(21) to continue calculating the weights of various risk factors. The weights of the impact factors for the risk evaluation index system of buildings within the influence range of the subway tunnel are shown in Table 9.
Weights of various risk factors.
Determination of Expert Weights: According to Equations (22) to (26), the expert weights are calculated, as detailed in Table 10.
Expert Weights.

After obtaining the expert weights, the information provided by each expert is aggregated. Following Step 4, the information given by the experts is effectively consolidated.
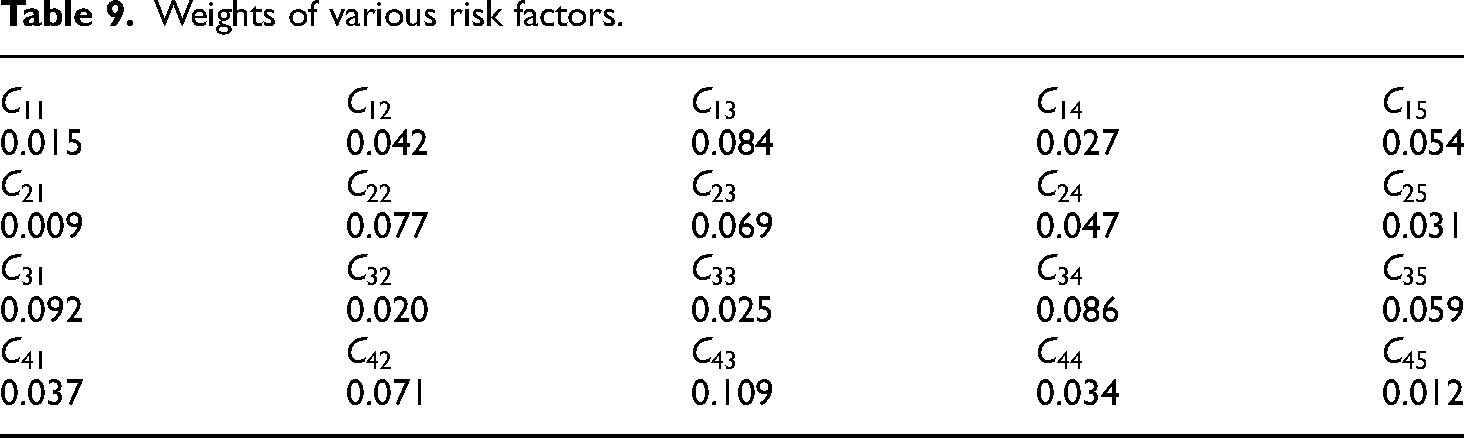
Step 5: According to the definition of the EDAS method, it is necessary to determine the average solution of all criteria. Equation (12) is applied for the calculation. Based on the aggregation results obtained, Equation (28) is used to continue determining the average solution
Average solutions for each influencing factor.
Step 6: Based on the attribute values of each scenario and their relative magnitudes, the relative attribute weights
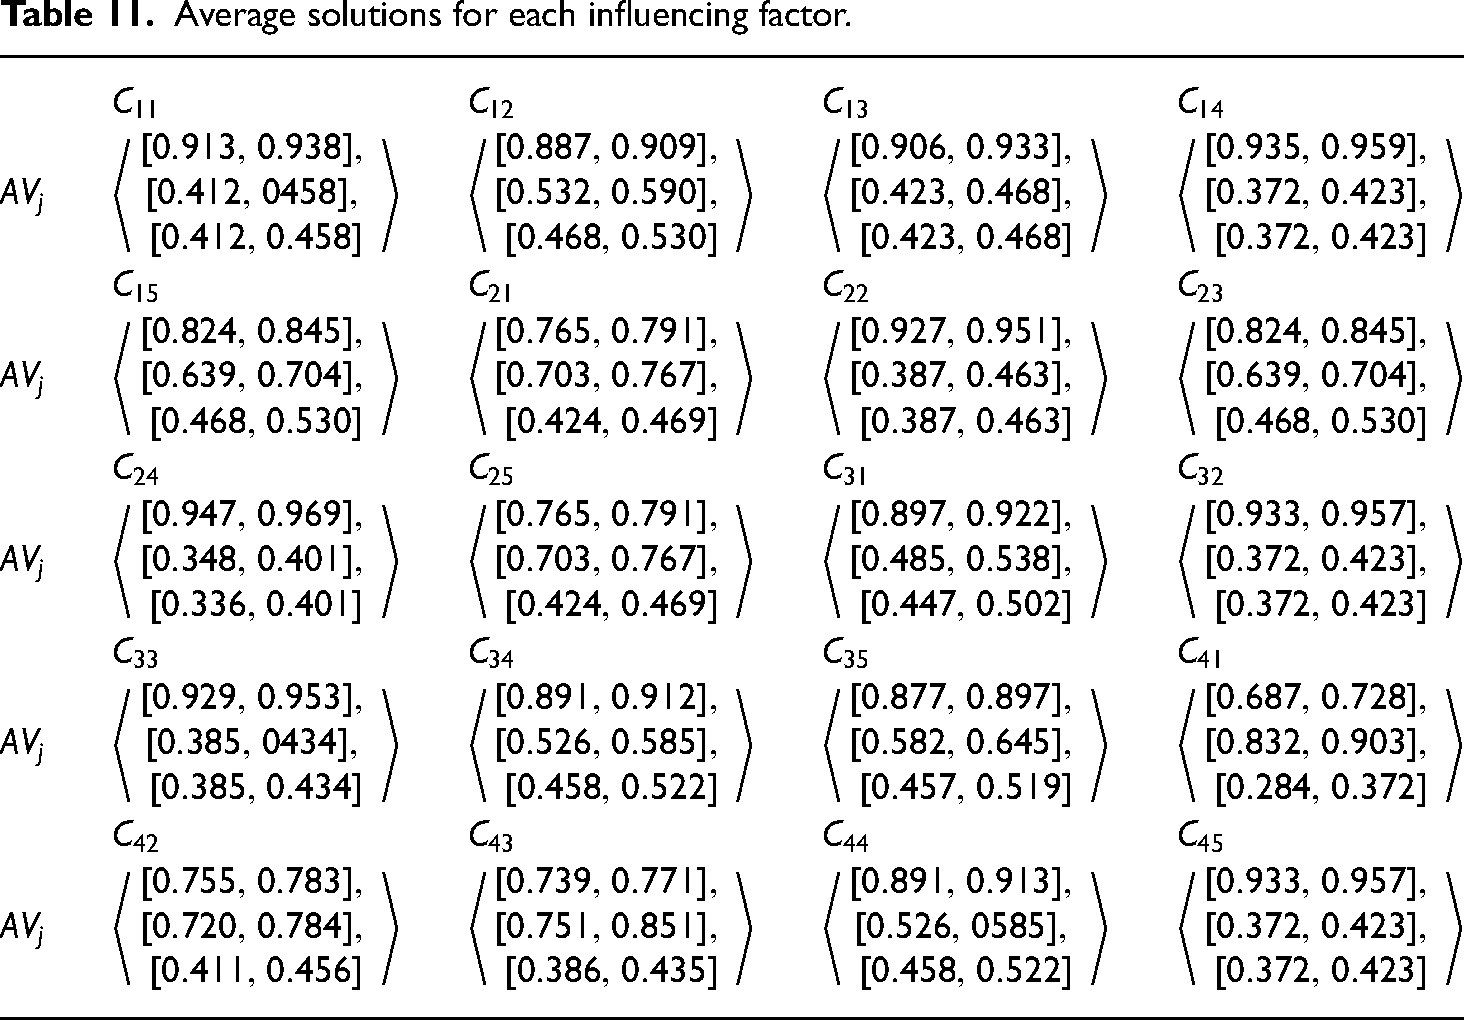
Step 7: Through Equations (30) and (31), PDA and NDA between the average scenario
Positive directional distance (PDA).
Negative directional distance (NDA).
Step 7: Using Equations (32) and (33), calculate the weighted positive distance
Step 8: Normalize the results from Step 7 using Equations (34) and (35) to obtain the standardized weighted positive distance
Summary of NSP, NSN, and AS.

Step 9: Compute the overall evaluation scores
From the table above, it can be observed that
Step 10. Based on the overall assessment score 
This paper integrates Cumulative Prospect Theory into the decision model, adopting the parameter values suggested by Tversky & Kahneman. Specifically, parameters in the weighting function, η = 0.61 and τ = 0.69, and in the value function, α = 0.88, β = 0.88, β = 0.88, and ρ = 2.25, are incorporated into the model constructed in this study. Consequently, Equations (32)–(35) involve a substantial number of parameters. Naturally, it is necessary to discuss how variations in different parameters reflect on decision outcomes. Therefore, to explore the robustness of the IVTSFS-CPT-EDAS model, the following discusses the impact of changes in each parameter on decision results individually.
Sensitivity analysis of the parameter
in the weighting function
With τ = 0.69 and the parameters in the value function held constant, the computational results and the ranking of alternatives based on different values of η are detailed in Table 15.
Calculation results for different parameters
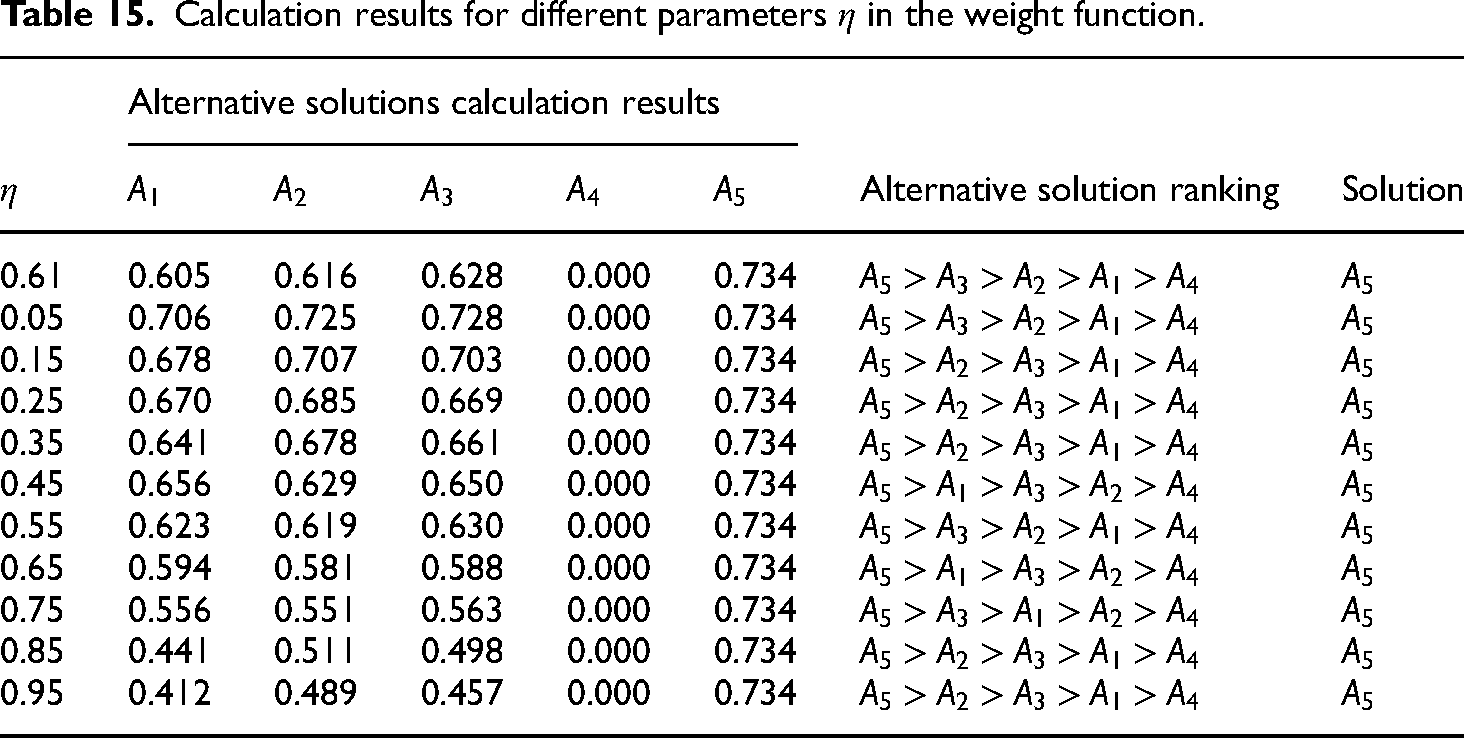
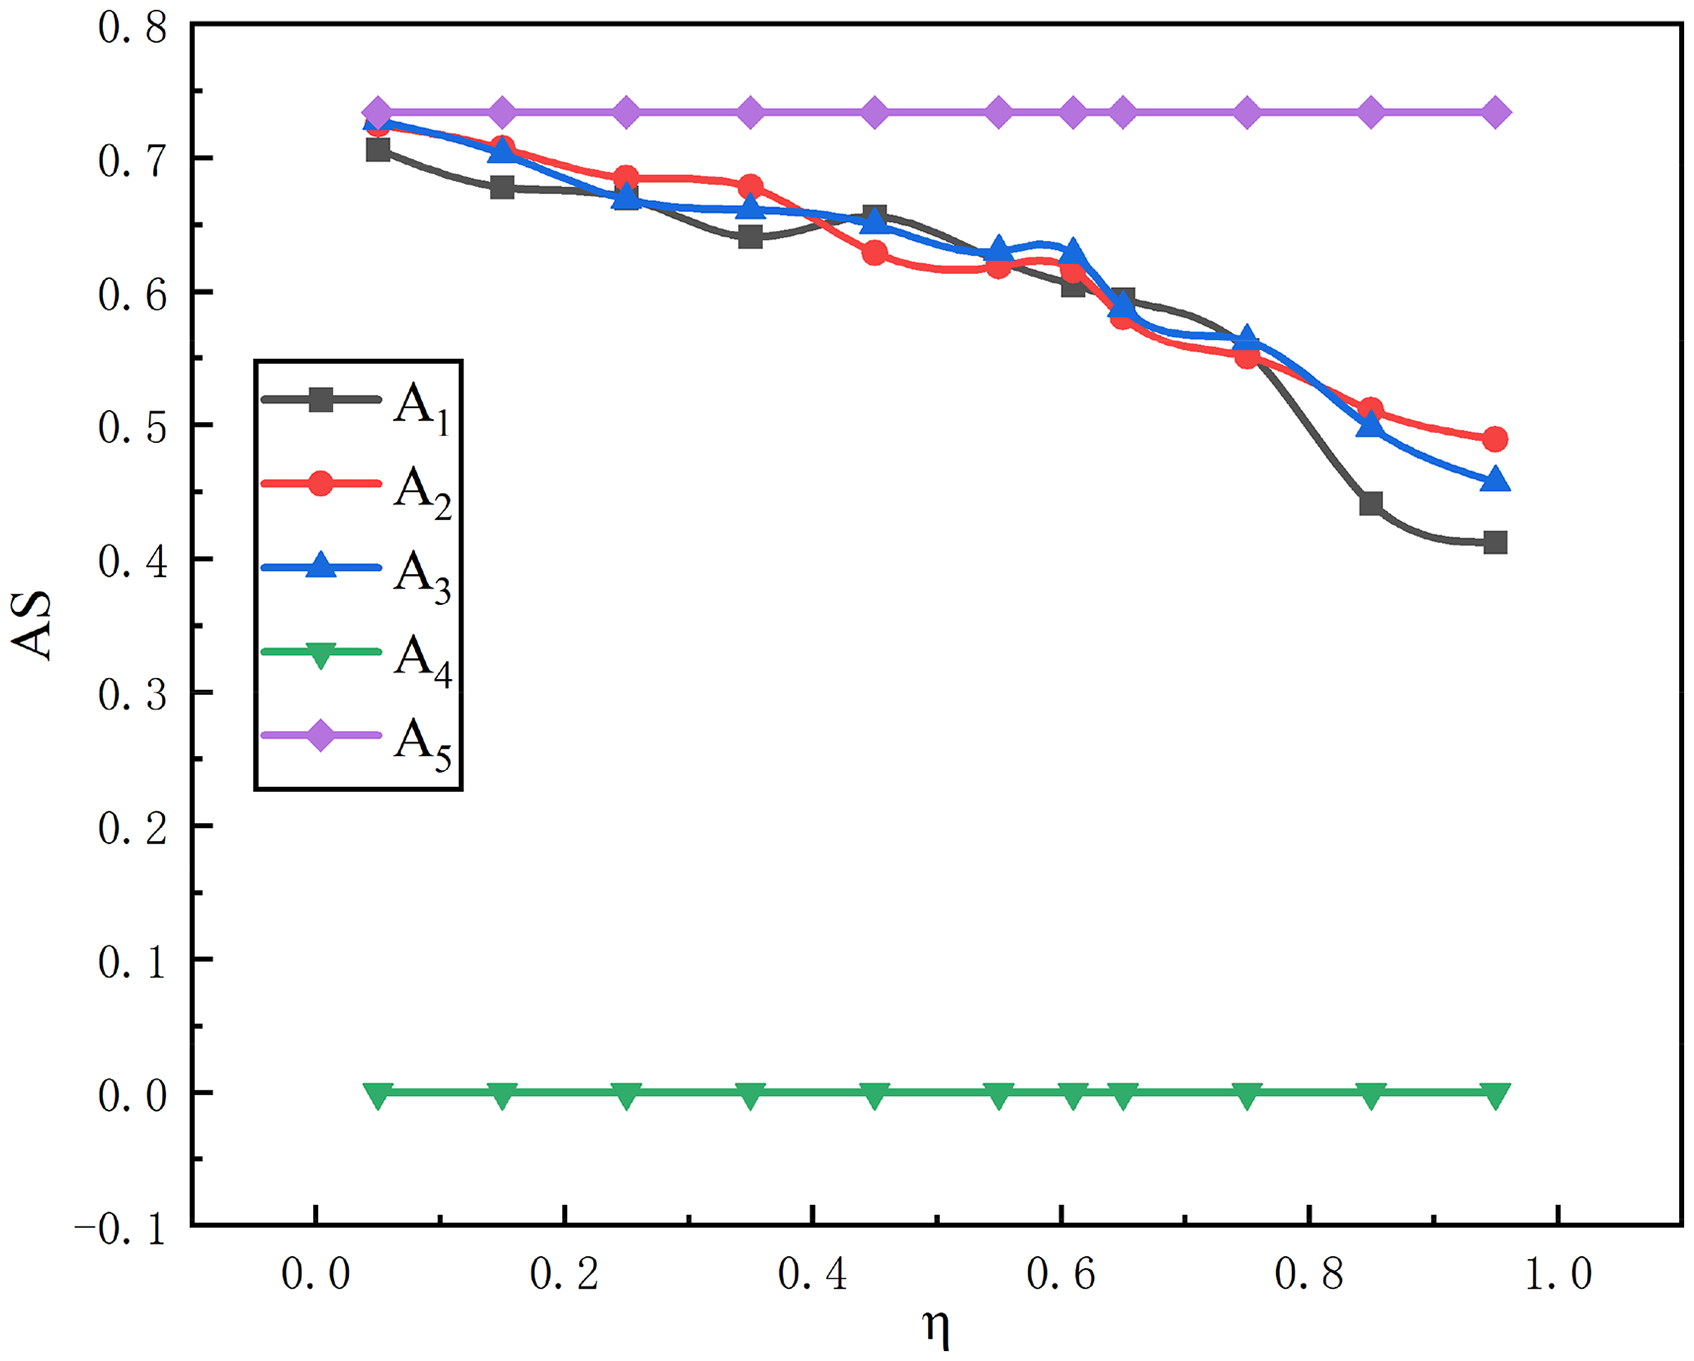
As shown in Table 15 and Figure 3, different parameters η have no impact on the calculation results of the IVTSFS-CPT-EDAS model. As η increases, the overall evaluation scores in the IVTSFS-CPT-EDAS model decrease for all alternative scenarios except for A4, which remains unchanged, although the change is minimal. In the decision model, the best scenario is consistently A5, and the worst is A4.
Result value change graph of parameter η changes in the value function.
Sensitivity analysis of the parameter τ in the weight function
When η = 0.61 and the parameters in the value function remain unchanged, the calculation results and the ranking of alternative scenarios for different τ values are detailed in Table 16.
Calculation results for different parameters τ in the weight function.
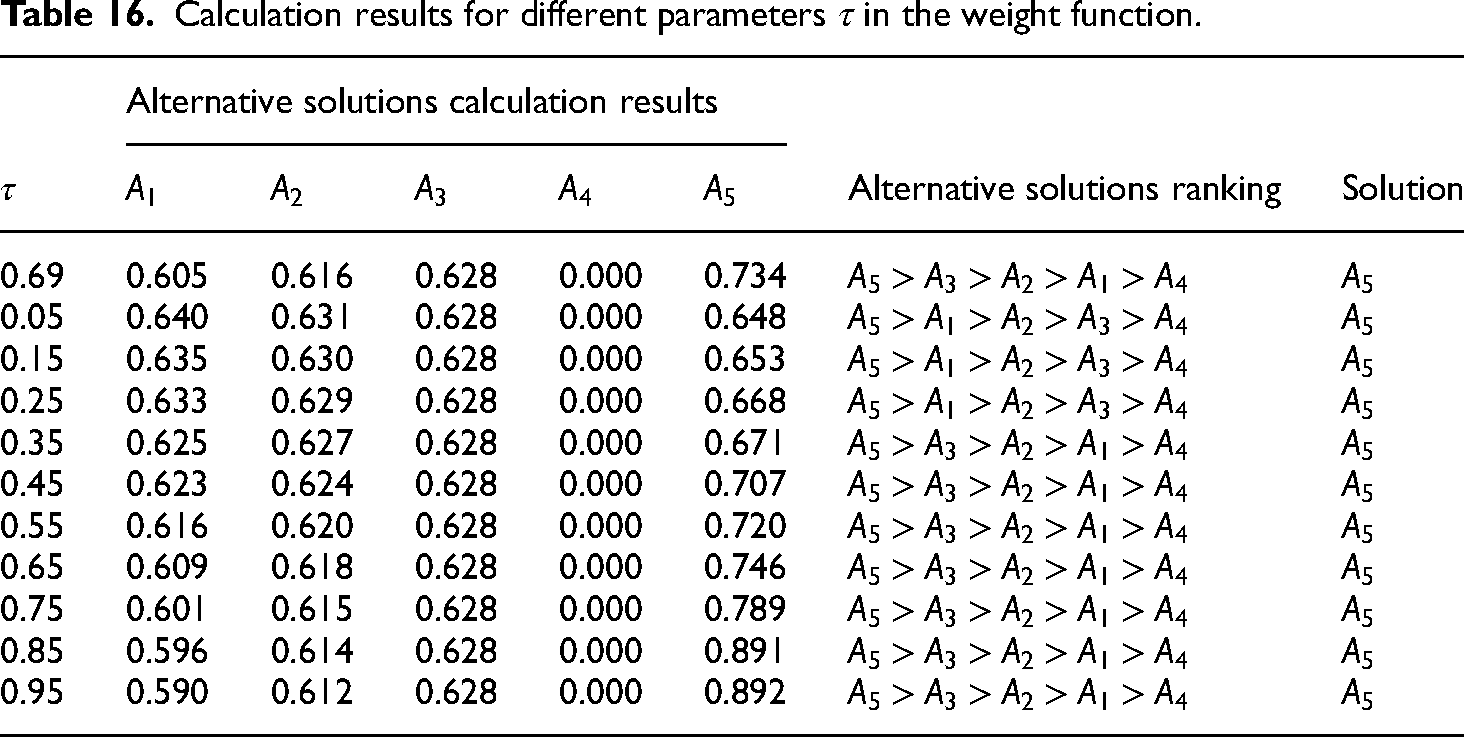
As indicated by Table 16 and Figure 4, different values of the parameter τ have no impact on the calculation results of the IVTSFS-CPT-EDAS model. The influence on alternative scenario A5 is more significant, while there is no impact on scenarios A3 and A4, and only a minimal effect on A1 and A2. In the decision model, the best scenario remains A5, and the worst is consistently A4.

Result value change graph of parameter τ changes in the value function.
Sensitivity analysis of the parameter α in the value function
When β = 0.88, ρ = 2.25, and the parameters in the weight function remain unchanged, the calculation results and the ranking of alternative scenarios for different values of α are detailed in Table 17.
Calculation results for different parameters

According to Table 17 and Figure 5, different parameter

Result value change graph of parameter α changes in the value function.
Sensitivity analysis of the parameter
in the value function
When the parameters in the
Calculation results for different parameters
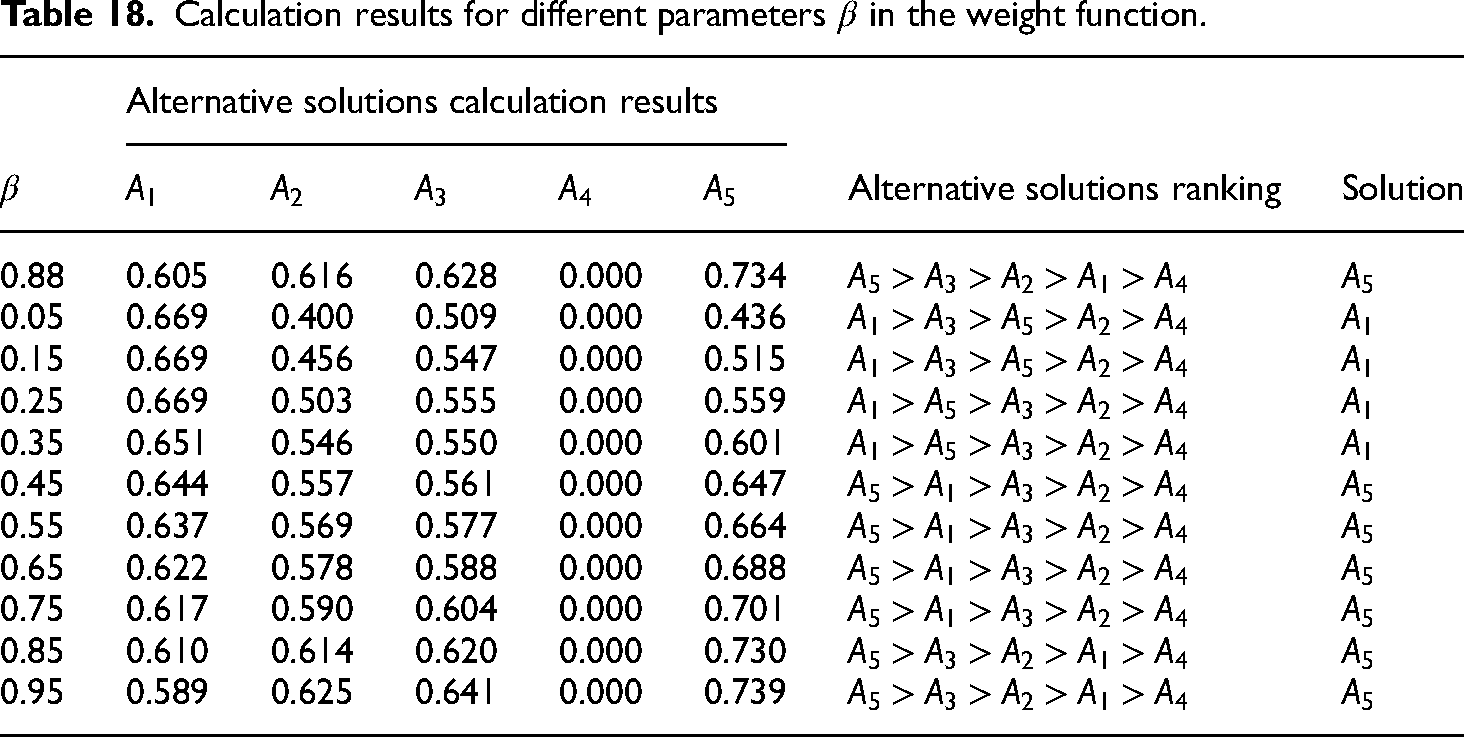
According to Table 18 and Figure 6, different parameters β will cause certain fluctuations in the calculation results of the IVTSFS-CPT-EDAS model. When

Result value change graph of parameter β changes in the value function.
Sensitivity analysis of the parameter
in the value function
When
Calculation results for different parameters

According to Table 19 and Figure 7, different parameters
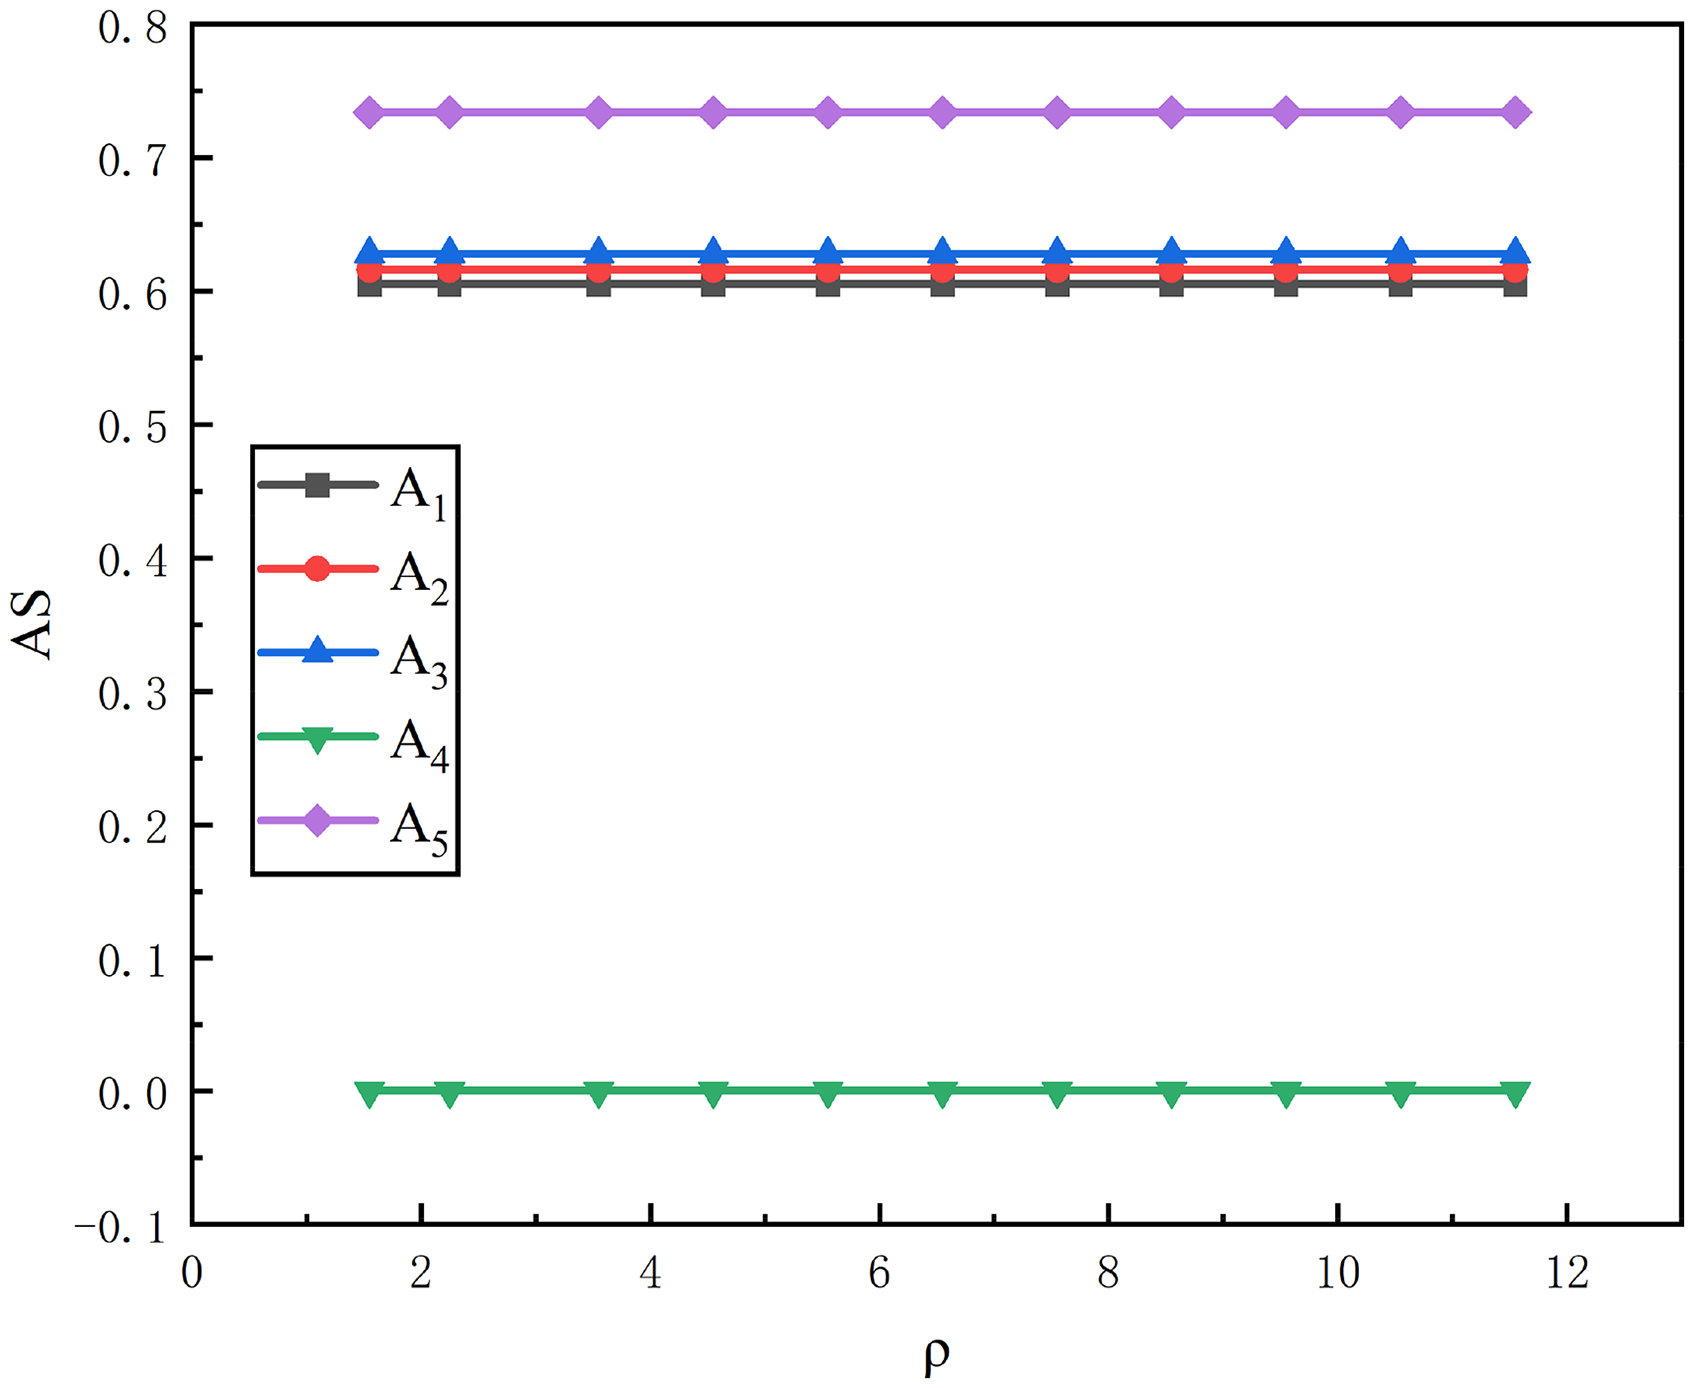
Result value change graph of parameter ρ changes in the value function.
From the observations and analysis results, it is evident that although changes in the parameters within the weight function and value function may cause some fluctuations in the model's computational outcomes, the ranking of alternative scenarios in the decision results generally remains stable (Figure 8). Thus, the IVTSFS-CPT-EDAS model exhibits robustness. Overall, when there is a change in any parameter, the changes in the computed results within the IVTSFS-CPT-EDAS model are minimal or nonexistent, indicating the model's relative stability. Therefore, this model possesses strong resilience to interference, maintaining high accuracy and reliability.
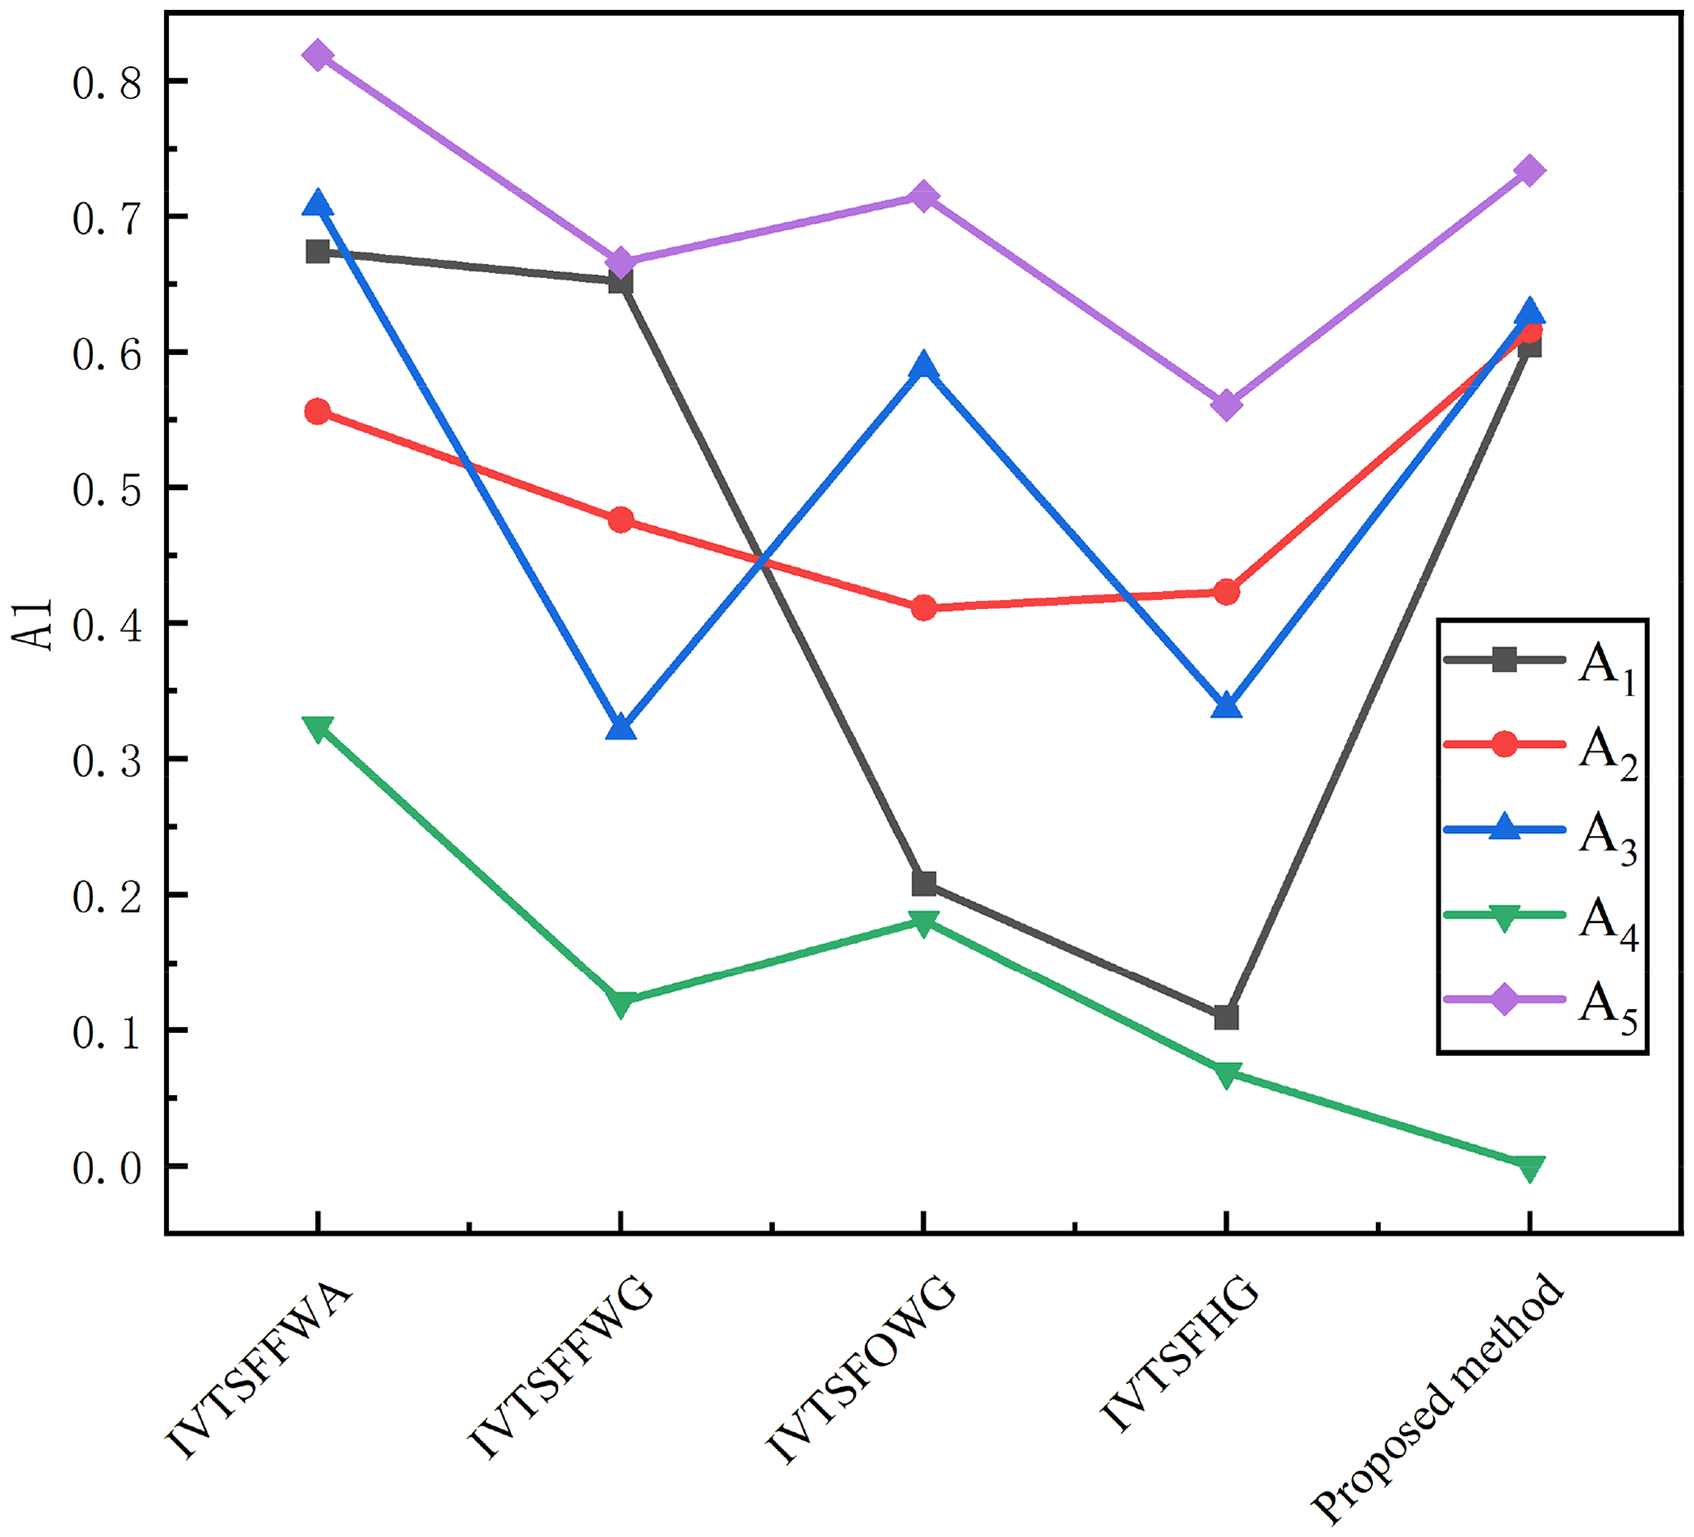
Results from different methods.
Discussion
In this section, the method proposed in this paper is compared with numerous existing methods to illustrate its effectiveness and efficiency. To validate the effectiveness of the proposed method, it is compared against existing approaches, including the TOPSIS,, 55 EDAS 56 ,CoCoSo 57 ,RAFSI. 58 Under fair conditions, using the same dataset and simulation flowchart, the scoring values of each method are compared, and alternatives are ranked based on these scores. The comparative results are shown in Table 20.
Results from different methods.

From Table 20, it can be observed that identical ranking results have been obtained for the alternative solutions. The scoring function of the method introduced in this paper exhibits greater variability, leading to clearer ranking outcomes, which underscores the practicality and usability of the new approach.
Assessing the efficacy and limitations of the IVTSFS-CPT-EDAS model: directions for future research
This paper builds upon the traditional CPT-EDAS model by introducing the IVTSFS to establish the IVTSFS-CPT-EDAS model. Compared to conventional methods, this model offers several advantages: Firstly, it can handle uncertainties related to the possibility and necessity of information. This dual uncertainty management provides a more comprehensive perspective for decision-making. Secondly, it enhances the ability to improve aggregation operations, allowing for better integration of information from different sources, thereby improving decision quality and efficiency. Lastly, integrating CPT better simulates the actual decision-making environment, enhancing the model's accuracy.
Gaps and Future Research Directions: (1) Although this model introduces the IVTSFS-CRITIC method to determine attribute weights, it does not consider the impact of state changes in the subway tunnel construction process on risk evaluation indicators, leading to unbalanced and unreasonable evaluations and judgments. Therefore, future research should consider incorporating variable weight theory into the weight determination methodology to overcome biases caused by fixed weights, providing a more accurate and rational basis for risk assessment of the impact on surrounding buildings during subway tunnel construction. (2) While the IVTSFS-CPT-EDAS model can more accurately describe managers’ attitudes and psychological states, it does not account for the fact that the construction process is dynamically adjusted, leading to a lack of flexibility and generalizability in the evaluation method. Therefore, future research could incorporate dynamic evaluation methods, such as neural networks, into the model to address these shortcomings. (3) This study takes Shanghai as an example to analyze the impact of tunnel construction on existing buildings. The proposed model is applicable to high-density urban areas such as Shanghai. In the future, the applicability of the model can be explored based on the construction density, building types, and infrastructure distribution of different cities.
Comprehensive safety measures for shield tunneling construction
To ensure the safety of existing buildings during tunnel construction, the following recommendations are proposed based on the evaluation results:
Improper configuration of materials and equipment during tunnel excavation. Based on the strength, solubility, and hydrogeological conditions of the stratum where the tunnel is located, appropriate lining materials, grouting materials, and support materials should be selected. These materials must meet the requirements for mechanical strength, water resistance, and corrosion resistance to minimize rock mass disturbance and ground displacement. Inadequate excavation pressure control during tunnel excavation. Achieve automation and digitalization of earth pressure control in shield machines or excavation equipment by integrating monitoring data with mechanical control systems. Dynamically adjust cutterhead rotation speed, chamber pressure, and grouting volume based on real-time conditions to ensure a stable and balanced state between the excavation face and the surrounding strata. Non-compliance of stratum solubility coefficient. Implement pre-reinforcement measures for dissolution-sensitive sections, such as high-pressure grouting, chemical consolidation, or freezing techniques, to enhance soil strength and stability while reducing voids and uneven settlement caused by dissolution. When necessary, adopt water-blocking materials or processes that reduce solubility to minimize contact between water and soluble minerals, thereby inhibiting the dissolution process.
Conclusion
This study successfully integrates the IVTSFS-CPT-EDAS model into the risk assessment framework for evaluating the impact of subway tunnel construction on adjacent buildings. A novel risk assessment model was developed and implemented during the Shanghai subway construction process. The model's validity and practicality were confirmed through this application. Based on the risk assessment outcomes, appropriate risk mitigation strategies were devised. The principal findings are summarized as follows.
An evaluative index system comprising four primary, and 20 secondary indicators was established, taking into comprehensive consideration the impacts of various risk indicators on neighboring buildings. This system not only serves as a benchmark for assessing the risks associated with subway tunnel construction impacts but also utilizes the IVTSFS-CRITIC method to derive the weights of each indicator. These weights reflect the evaluation information and the interconnections between attributes, thus yielding more realistic risk assessment outcomes. To validate the sensitivity of the model, a sensitivity analysis was conducted on the parameters η, τ, β, and ρ in the cumulative prospect theory. The influence of parameters η, τ, and ρ on the evaluation scheme was found to be negligible. However, β has a significant impact on the evaluation results. Therefore, when applying this method for scheme evaluation in the future, emphasis should be placed on the influence of β on the results. Additionally, a sensitivity analysis of β should be conducted to assess its impact on the outcomes, ensuring the accuracy of the evaluation results. The deployment of the IVTSFS-CPT-EDAS model in assessing the risks related to the construction of subway tunnels on nearby structures effectively mitigates the inherent ambiguities in such evaluations. Moreover, the model emulates the decision-making environment of managers in real-world scenarios, thereby enhancing the reliability and objectivity of the risk assessments. This study analyzes the impact of tunnel construction on existing buildings using Shanghai as a case study. The proposed model is applicable to high-density urban areas like Shanghai. In the future, the model's applicability can be further discussed by considering variations in construction density, building types, and infrastructure distribution across different cities.
Footnotes
Authors’ contribution
Lixin Chang contributed to conceptualization, methodology, investigation, computation, model analysis, writing–original draft and editing, and review. Norhaiza Nordin contributed to conceptualization, methodology, and writing–review. Xinhua Gu contributed to computation, supervision, and writing–review and editing. Ye Zhao contributed to computation and writing–review and editing.
Data availability statement
Data cannot be shared openly but are available on request from authors.
Declaration of conflicting interests
The authors declared no potential conflicts of interest with respect to the research, authorship, and/or publication of this article.
Funding
The authors received no financial support for the research, authorship, and/or publication of this article.