
Abstract
The main challenge facing current energy management strategies for extended-range electric vehicles is effectively balancing power demand and energy utilization to enhance fuel economy under complex and variable driving conditions. Therefore, to optimize the distribution between the two energy sources of extended-range electric vehicles and improve their fuel economy, this paper proposes an energy management strategy incorporating speed prediction. Firstly, the long short-term memory neural network speed prediction scheme is investigated, and its effectiveness under different cyclic conditions is verified. Secondly, the four hyperparameters of the long short-term memory neural network structure were optimized using the sparrow algorithm (SA) to further enhance the prediction accuracy of the long short-term memory speed prediction algorithm. After optimization, the mean square deviation and mean absolute error are reduced by 46.46% and 54.46%, respectively, compared with the pre-optimization period. Finally, an energy management strategy based on speed prediction was designed using the sparrow algorithm-long short-term memory model. The results show that the speed prediction-based energy management strategy reduces fuel consumption by 6.05% and 3.50% under the New European Driving Cycle and World Light Vehicle Test Cycle conditions, respectively, compared to the rule-based hybrid control strategy.
Keywords
Introduction
Amidst the global energy crisis and escalating environmental pollution, the development of efficient and environmentally sustainable transportation methods has become an issue of pressing concern in contemporary society. As an intermediary between electric vehicles and traditional fuel vehicles, extended-range electric vehicles (EREVs) have increasingly become a focal point in new energy vehicle research, primarily due to their extended range and superior fuel efficiency. However, the energy management strategies of EREVs encounter significant challenges in practical applications, particularly under complex road conditions and variable driving environments, where achieving efficient synergy and optimal powertrain management remains difficult. To mitigate these issues, energy management strategies that incorporate speed prediction have emerged. 1
As an intermediary between electric vehicles and traditional fuel vehicles, EREVs have increasingly become a focal point in new energy vehicle research due to their extended range and superior fuel efficiency. However, the energy management strategies of EREVs encounter significant challenges in practical applications, particularly under complex road conditions and variable driving environments, where achieving efficient synergy and optimal powertrain management remains difficult. To mitigate these issues, energy management strategies that incorporate speed prediction have been developed. 2
By predicting and analyzing the vehicle's driving state and rationally allocating energy consumption between electric power and fuel, the vehicle's fuel economy can be improved, and emissions can be significantly reduced. This study aims to explore and optimize the energy management strategy of EREVs by introducing a speed prediction model, providing new insights and technical support for both theoretical research and practical application in this field.
Literature review
Hu et al. and Dongwei et al.3,4 compared the speed prediction effects of different methods across various prediction time domains using fused traffic information, incorporating historical data on vehicle speed, distance, signal status and the distance and remaining time of the vehicle ahead. The results show that fusing traffic information can effectively improve the prediction accuracy of speed prediction models. Feng et al. and Chaofeng et al.5,6 both propose new high-precision speed prediction algorithms and real-time reference state of charge (SOC) trajectory planning methods for plug-in hybrid electric vehicles. Simulations show that the fuel consumption using the proposed energy management strategy is very close to that of the theoretical suboptimal strategy using the targeting method and demonstrates better fuel economy among the studied strategies. In a vehicle-following situation, Kai 7 combined driving intention and Light Detection and Ranging (LIDAR) data to develop a speed prediction energy management technique. According to experimental findings, this approach can identify driving intentions with up to 88% accuracy and increase fuel efficiency by 1.3%–2.7% compared to the current adaptive Equivalent Consumption Minimization Strategy (ECMS) without speed prediction.
By examining the vehicle driving circumstances prediction model, Li et al. 8 were able to increase the prediction accuracy. In the context of the A-Global Energy Management Strategy (A-EMS), Piras et al. 9 developed the short-term speed prediction layer of an long short-term memory (LSTM) neural network, integrated the fuel cell system model into the GT-Suite environment and proposed an adaptive energy management method for fuel cell vehicles (FCVs) based on speed prediction. Test findings under various operating conditions demonstrate the extremely high accuracy of the short-term speed prediction layer, enhancing the FCV capacity and stability during charging. Luca et al., Zhang et al. and Qingjian et al.10–12 all use neural network speed prediction to present an online optimal energy allocation approach for hybrid vehicles. Simulations proved that the proposed approach achieves results much closer to optimal than conventional energy management strategies taken as a reference.
Main work of this paper
In this work, we primarily conduct research on the energy management strategy of the entire vehicle in the driving state, aiming to further enhance the fuel economy of the programmable electric vehicle in hybrid mode. The energy management strategy based on optimization algorithms is also challenging to apply in current practical engineering, addressing the poor adaptability of rule-based strategies for complex working conditions, which are currently used as theoretical references for other energy management strategies. 13
Therefore, this paper investigates the energy management strategy based on model prediction, designs a control strategy utilizing LSTM neural network speed prediction and verifies its effectiveness under different working conditions. Finally, to further improve the prediction accuracy of the LSTM speed prediction algorithm, the sparrow algorithm (SA) is used for offline optimization of the four hyperparameters of the LSTM neural network structure, including the number of nodes with different activation functions in the two layers, the number of training epochs and the learning rate. The results show that the evaluation indexes of root mean squared error (RMSE) and mean absolute error (MAE) are reduced by 46.46% and 54.46%, respectively, compared to the pre-optimization period, and the prediction accuracy of the vehicle speed prediction model is significantly improved.
Power system structure
Since programmable electric vehicles can use a range extender to complete charging, unlike traditional plug-in hybrid electric vehicle models, it is possible to develop an efficient charging management control strategy to better achieve energy savings and emission reduction for programmable electric vehicles. 14
The focus of this paper is on a mass-produced range extender model developed by a company, as illustrated in Figure 1. The system structure mainly comprises three modules: the power battery system, power drive system and range extender system. Table 1 presents the basic parameters of the vehicle and related power specifications.

Automotive power system structure.
Vehicle-related parameters.

Comparison of error optimization.

Fuel consumption comparison of two energy management strategies.

A comparison of this study with prior literature.

Compared to fully electric vehicles, the programmable electric vehicle includes an additional set of range extender systems, consisting of a small displacement engine and a corresponding generator. 15 These systems are activated when the vehicle's power demands exceed the capacity of the power battery. The engine controller then directs the engine to drive the generator, which produces electricity following rectification, based on instructions from the vehicle controller to supply power to the drive motor and power battery.
Research on energy management strategy under integrated vehicle speed prediction
Research on speed prediction algorithm based on LSTM
Introduction to the principles of LSTM
LSTM is a type of recurrent neural network that was developed by Hochreiter and Schmidhuber. It is a specific type of recurrent neural network that is extensively utilized for time series data prediction. 16 LSTM is a derivative of RNN. The LSTM model is used to update the cell state for the time series x = {x1, x2, x3, …, xt} by repeatedly entering three different “gates” to compute the hidden layer h = {h1,h2,h3, … ,ht} and the output o = {o1,o2,o3, … ,ot}. Eventually, the predicted sequence is obtained, and the LSTM model's cell structure is displayed in Figure 2.
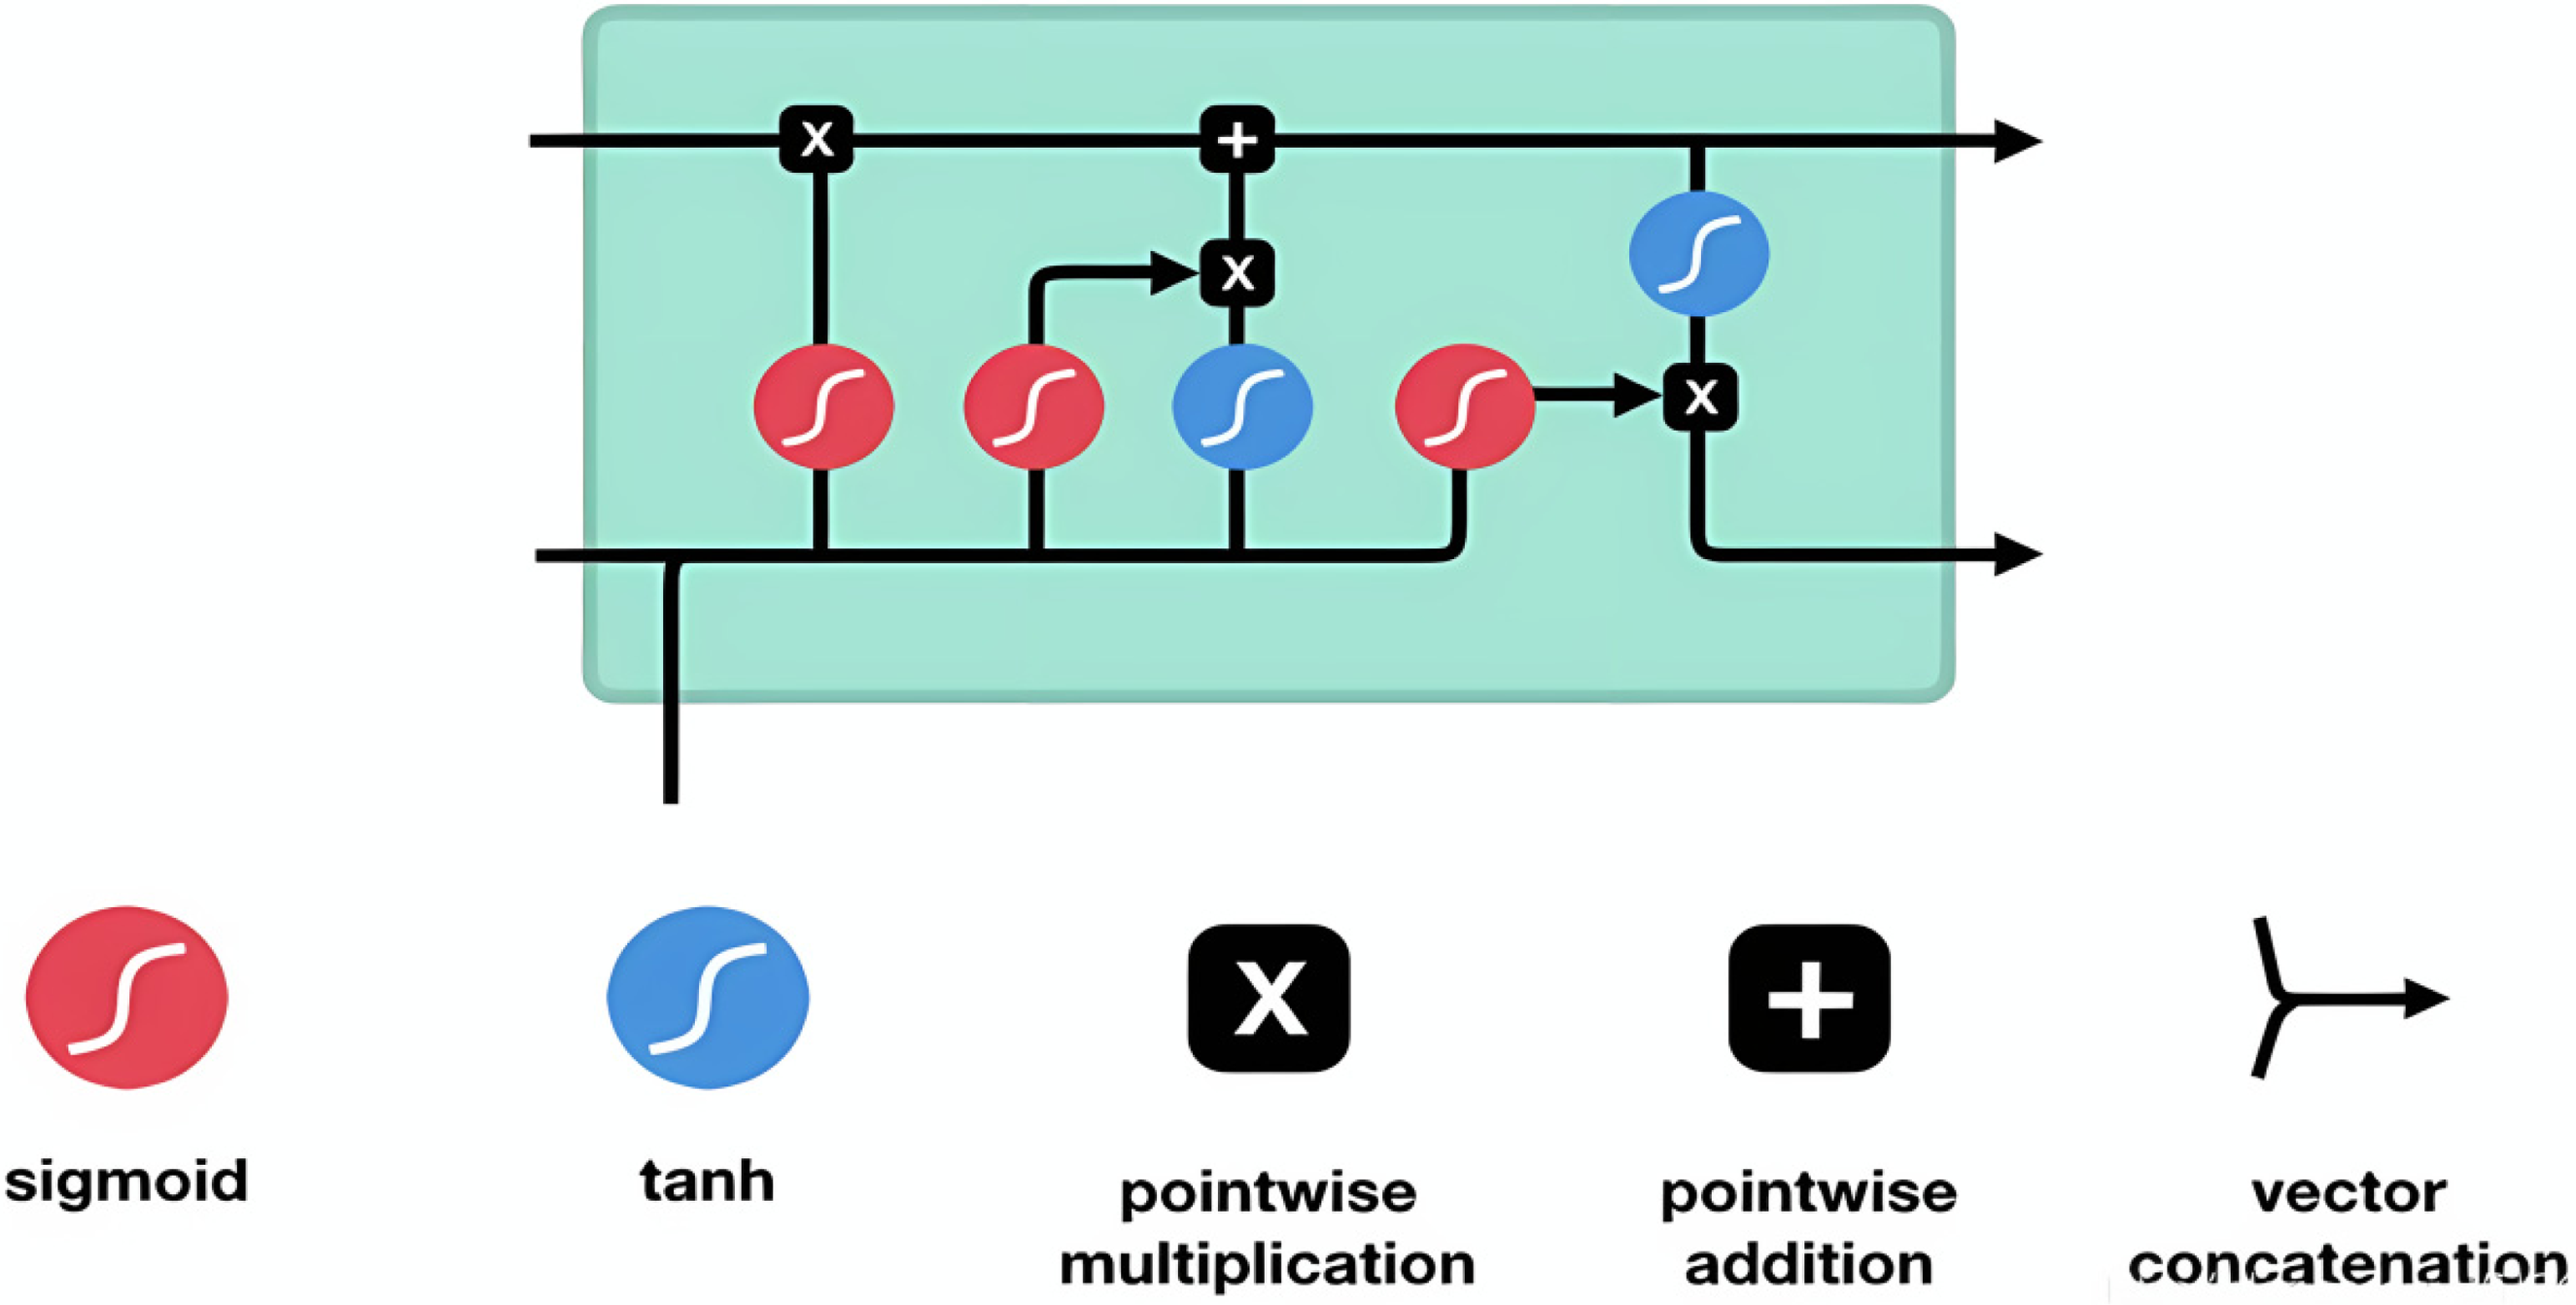
LSTM model's cell structure.
The role of each of the three gates in the information transfer process is as follows:
(1) Forgetting gate where (2) Input gate where (3) Output gate where


Setting up the structure of the prediction model
LSTM has certain advantages in handling time series problems; therefore, when designing the neural network structure, this paper selects LSTM for the hidden layer. Additionally, after determining the hidden layer structure, it is necessary to decide on the number of hidden layers. The number of hidden layers significantly affects neural network performance 17 ; increasing the number of hidden layers can enhance computational accuracy, but too many layers can increase computational load, impacting real-time performance and training time. For simple data sequences, a network with one hidden layer is often sufficient to approximate most nonlinear functions. However, it may not meet the needs of more complex data sequences; therefore, this paper chooses a structure with two hidden layers. Additionally, the number of neurons in the hidden layer affects network accuracy and can be adjusted by increasing or decreasing the number of neurons.
Selection of the loss function
Numerous other types of loss functions also exist, such as zero-one loss, perceptron loss, hinge loss, and so on. 18 Among these, zero-one loss is the most popular due to its simple and absolute definition. Since predicting an automobile's speed is a time series problem with large intervals, this study chooses hinge loss as the loss function. Perceptron loss is a classification function, while hinge loss is suitable for addressing interval maximization problems. Thus, hinge loss is chosen as the loss function in this research.
Determination of input parameters
The network structure set in this paper is [1,30,200,2], in which the input layer contains a total of 30 neurons, and the LSTM hidden layer is divided into two layers, each consisting of 200 neurons. And the set mini_BatchSize = 16, max_Epochs = 20, and learning_rate = 0.005.
Vehicle speed prediction model validation under LSTM
Considering that the car will operate in various environments, such as urban, suburban, and high-speed settings, this paper constructs a combined HIGH-NEDC working condition by integrating one NEDC scenario (covering both urban and suburban conditions) with five HIGH scenarios (high-speed conditions) to improve prediction accuracy under varied conditions.
19
It then uses speed data from 40 combined HIGH-NEDC working conditions as samples, with 95% of the data allocated for training and the remaining 5% for validation of the LSTM prediction model. During training, the mean squared error (MSE) and MAE were used as evaluation metrics, with the equations provided below: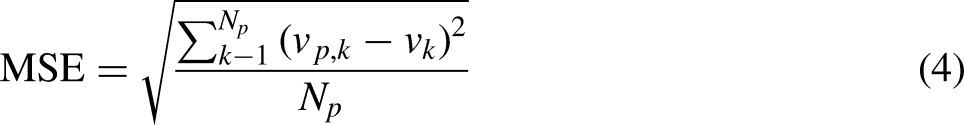

The prediction results reveal a significant discrepancy between the anticipated and actual speeds, especially when the automobile is traveling faster than 80 km/h. A notable discrepancy also exists between the estimated and actual speeds at lower velocities, particularly when traveling below 20 km/h, as illustrated in Figure 3.

Vehicle speed prediction results of LSTM model under combined working conditions.
Since the car's speed during travel is influenced by external conditions and the driver's state, it exhibits variability. To further assess the accuracy of the LSTM speed prediction algorithm, this paper constructs randomized working conditions by sampling speed data from a section of an urban road, as shown in Figure 4. The first 70% of the data from these randomized conditions are used as training samples, while the remaining 30% are used for validation of the LSTM speed prediction model.
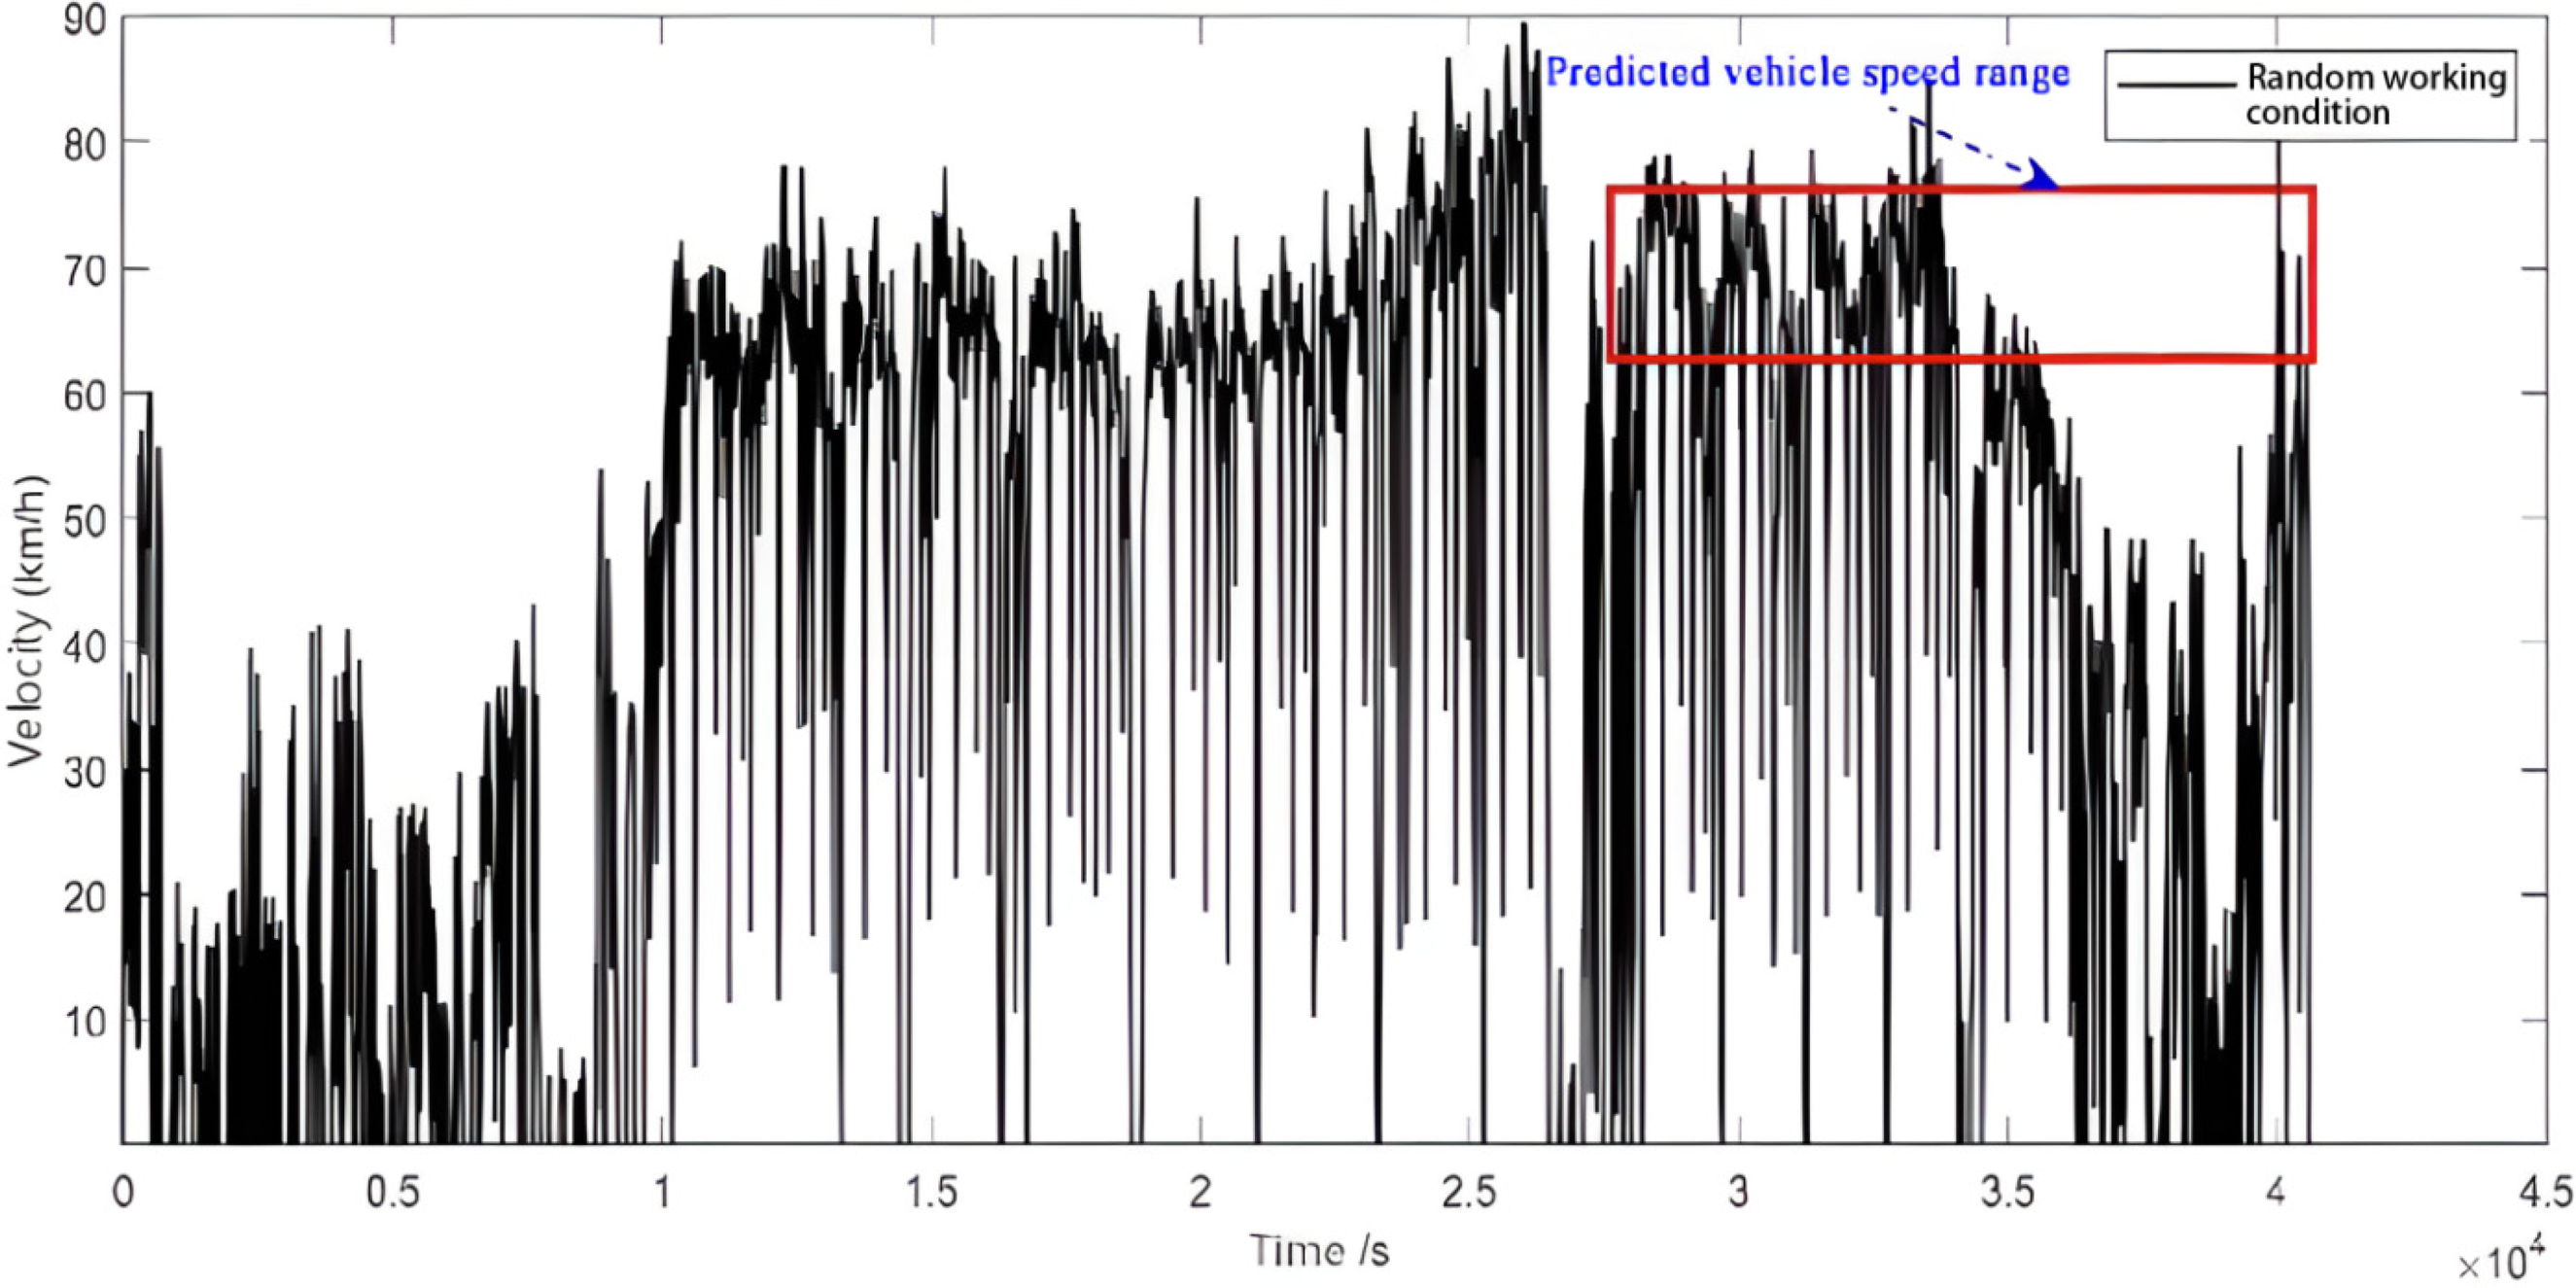
Random working condition sampling data.
As shown in Figure 5, the predicted speeds closely match the target speeds in the low-speed range, whereas significant errors occur in the higher speed range of 70–80 km/h. Figure 6 indicates that the training model was iterated 20 times, with the RMSE decreasing gradually after the second iteration, reaching a final RMSE of 5.9044 and an average absolute error of 4.5117, which still represents a significant deviation. Consequently, SA is employed to optimize four hyperparameters of the prediction model (the number of nodes in the two hidden layers, the learning rate and the number of training epochs) to enhance the accuracy of the LSTM prediction model.

LSTM model speed prediction results under stochastic conditions.

RMSE of the LSTM model under random working conditions.
Research on LSTM speed prediction with SA optimization
SA exhibits strong global search capabilities and adaptability, avoids local optima and is suitable for various neural network architectures. It features rapid convergence, high robustness and excellent performance in addressing high-dimensional and nonlinear optimization problems. The SA is straightforward in principle and easy to implement and enhances neural network training effectiveness by preserving individual diversity and preventing premature convergence. Given these advantages, this section will utilize SA to optimize four hyperparameters of the LSTM. 20 The optimization principle of the SA can be outlined using a mathematical formula, which is divided into the following steps.
Discoverer's location update
In sparrow populations, the initial individuals to discover food are typically those with higher adaptation values. During each iteration, the position update of the finder is given by equation (6):
Follower's position update
Subsequent adopters must also follow Rule (7) below, in conjunction with Rule (6) stated above. Additionally, these followers will continually observe the initial food discoverer during foraging. If a follower identifies new food discovered by the original finder, they will compete for it with the discoverer. They must immediately take the food from the finder if they succeed; otherwise, they must continue to follow Rule (7).
Reconnaissance of early warning behavior
Assuming each finch responsible for peripheral vigilance is aware of the danger and that the initial positions of the finch population are randomly generated, the abstraction into a mathematical expression is represented by equation (8).
The SA is employed to optimize the hyperparameters of the LSTM prediction model, resulting in the following outcomes. Figure 7 illustrates that the values of the two parameters used to assess the prediction model's accuracy are lower after optimization compared to the pre-optimization period. The MSE after optimization is 3.1608, which is significantly lower than the pre-optimization value of 5.9004, and the MAE is 2.0543, substantially lower than the pre-optimization value of 4.5117. Additionally, Figure 8 shows that the hyperparameters have been slightly adjusted. Consequently, there are 49 nodes in the first hidden layer, 91 nodes in the second hidden layer, 49 training epochs, and a learning rate of 0.0053. Figure 9 shows the RMSE versus iterations for both the SA-LSTM and LSTM models.

SA-optimized MSE value.

SA-optimized LSTM hyperparameter values.

SA-LSTM and LSTM model RMSE iterative relationship.
The speed prediction performance of the LSTM neural network model optimized by the SA has significantly improved, as shown in Figure 10. The optimized speed prediction values closely align with the actual target values, especially in the higher speed ranges where significant errors were observed before optimization. This indicates that the SA-LSTM-based speed prediction algorithm has shown improvement compared to the pre-optimization phase and offers theoretical support for developing future speed prediction-based energy management strategies. Table 2 shows the comparison of MSE and MAE error optimization.

Comparison of LSTM and SA-LSTM models for predicting vehicle speed under stochastic conditions.
Design and simulation analysis of energy management strategy based on speed prediction
The energy management strategy based on speed prediction aims to optimally allocate the energy outputs of the range extender and the power battery according to real-time speed predictions in the time domain, thereby maximizing the utilization of the battery's power while minimizing fuel consumption. This section presents an improved energy management strategy based on speed prediction, building upon the hybrid drive mode strategy discussed previously. 21
Design of energy management strategy based on SA-LSTM speed prediction
The three main modules of the SA-LSTM speed prediction-based energy management strategy are the control module, responsible for determining the appropriate control sequences, the energy allocation optimization module and the SA-LSTM real-time speed prediction module. The basic framework of this strategy is illustrated in Figure 10. The control strategy optimization module utilizes the dynamic programming (DP) algorithm to optimize within the predicted sight distance, while the SA-LSTM real-time speed prediction module employs the SA-LSTM model. Conversely, the control strategy action module selects the optimal control sequences and typically adopts the first of the computed sequences to implement the control strategy. To achieve rolling optimization, the process will involve iterative repetition of the previously described procedures. 22
The specific steps are as follows:
When the vehicle is initiated, the real-time speed prediction module, as illustrated in Figure 11, initially forecasts the future vehicle speed within the predicted time domain. After acquiring the prediction data from step 1, the distance traveled by the vehicle up to that point can be calculated, and the distance within the predicted time domain can also be determined. Simultaneously, the target SOC value at the end of the predicted time domain can be computed by the energy allocation module, as shown in Figure 11. Using the future predicted vehicle speed information obtained in step 2, the required power for the drive motor during that period can be calculated. The DP algorithm is then employed to optimize the global energy allocation rule, ultimately generating the PRE control sequence that minimizes the objective function JDP within the specified constraints. After determining the PRE control sequence in step 3, the first term from each spatial state is utilized as the output value and implemented into the corresponding control module of the range extender. Finally, the aforementioned steps are iteratively repeated to achieve a globally optimized, rolling energy management strategy based on speed prediction, suitable for real-time application.
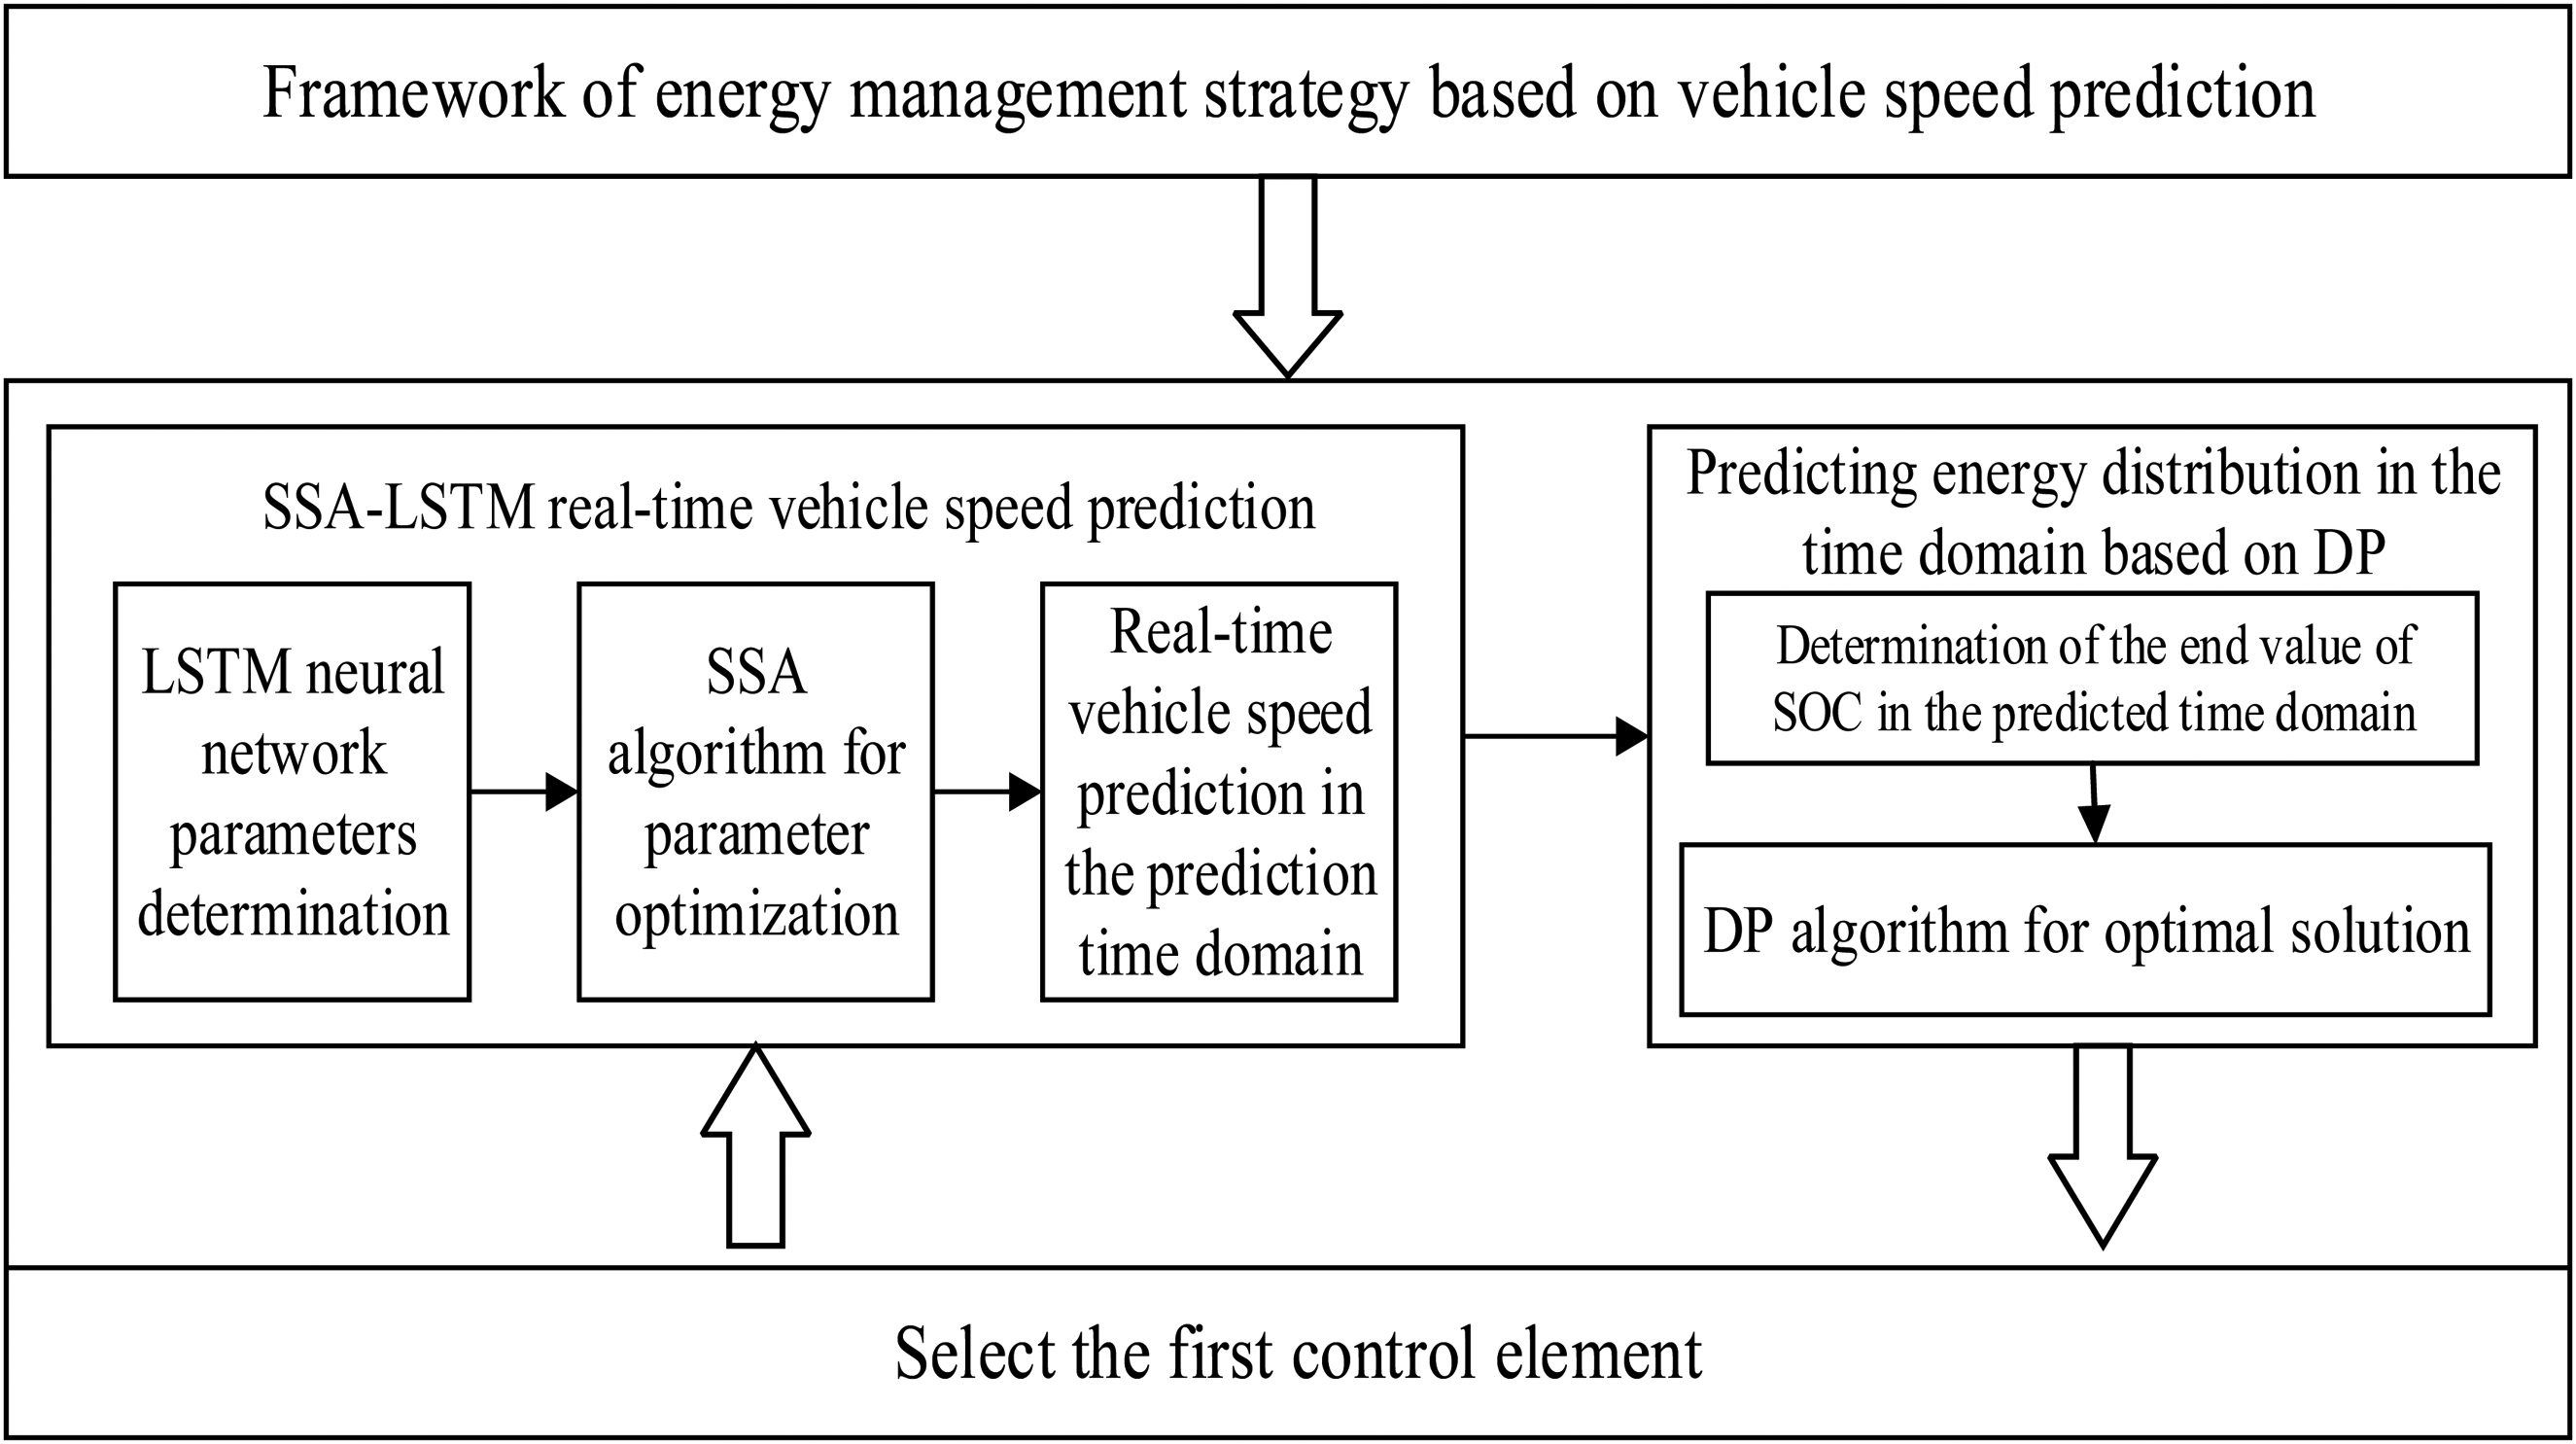
Flowchart of energy management strategy based on vehicle speed prediction.
Principles of DP algorithms
The core principle of the DP algorithm can be summarized as follows: a continuous multi-stage process is discretized into a series of sequential single stages according to specific rules. By sequentially solving the optimal solution for each sub-stage through state transition relations, the overall optimization result can be determined. The basic process consists of the following four stages
23
:
Delineation phase: Discretize the entire problem into a series of well-ordered subproblems, adhering to the no-backwardness constraint. Selection of state variables Determination of control variables Determination of the objective function

Determination of SOC end values in the prediction time domain
The initial and final values of the power batteries in the relevant prediction time domain must be determined prior to applying the DP algorithm to solve for the optimal energy allocation control sequence. During vehicle operation, the real-time SOC can be used to determine the initial battery value in the prediction time domain. However, a final value calculation for the battery in the prediction time domain is necessary. Under the DP algorithm, the global trajectory of the SOC generally exhibits a linear relationship with the distance driven across various driving conditions. 24
At the commencement of the car's trip, the total mileage can be retrieved via the vehicle's navigation system. Equation (10) can be derived from the relationship between SOC and the distance traveled by the vehicle according to the described DP algorithm:
Based on the fact that the DP solution in the rolling prediction time domain can be viewed as the accumulation of numerous small global optimization problems contributing to the overall global optimization, the above relationship can be used to further determine the final SOC value for each rolling time domain, as shown in equation (11).
DP solution process under LSTM speed prediction
This section employs the backward DP approach to solve the optimization problem, utilizing the technique described in the previous subsection and assuming that the initial and final SOC values in the rolling prediction time domain are determined as follows
25
:
1. Compute the power required by the drive motor at each stage following discretization. The control variable is defined as the output power PRE of the range extender, while the state variable represents the current battery power value. The chosen control and state variables are discretized to create a state network space comprising N stages. 2. To ensure that the battery charge value at the end of the trip approaches the set target termination value SOCover, a penalty term is introduced into the cumulative target function calculation equation, as illustrated in equation (12). where 3. The solution is derived by rolling backward from the Nth stage to the first stage. This involves calculating the transfer cost L for each stage as the state variable SOC transitions from the (K + 1)th stage segment to the Kth stage under the influence of the control variable PRE and progressively accumulating these costs into the total objective function JDP, as shown in equation (13). Additionally, the values of SOC and PRE corresponding to the minimum value of the objective function JDP must be recorded. 4. Once the inverse solving is completed, backward optimization is then initiated from the first stage to determine the optimal control sequence PRE and SOC change trajectories that minimize the objective function JDP. However, when solving in the reverse direction, state quantities from the previous stage may not align with the grid points of the next stage. As this misalignment accumulates, the error increases, potentially resulting in a suboptimal control sequence. To minimize this error, for state quantities that do not align with the grid points, the JDP values for the two adjacent grid points can be calculated using equation (14).


Simulation verification and result analysis
To simulate and analyze the range extender and monitor the vehicle's power, this study employs CRUISE software. The developed control strategy is integrated into the vehicle model to analyze the simulation results and validate the proposed charging control strategy.
Construction of whole vehicle model based on CRUISE platform
Selection of power components
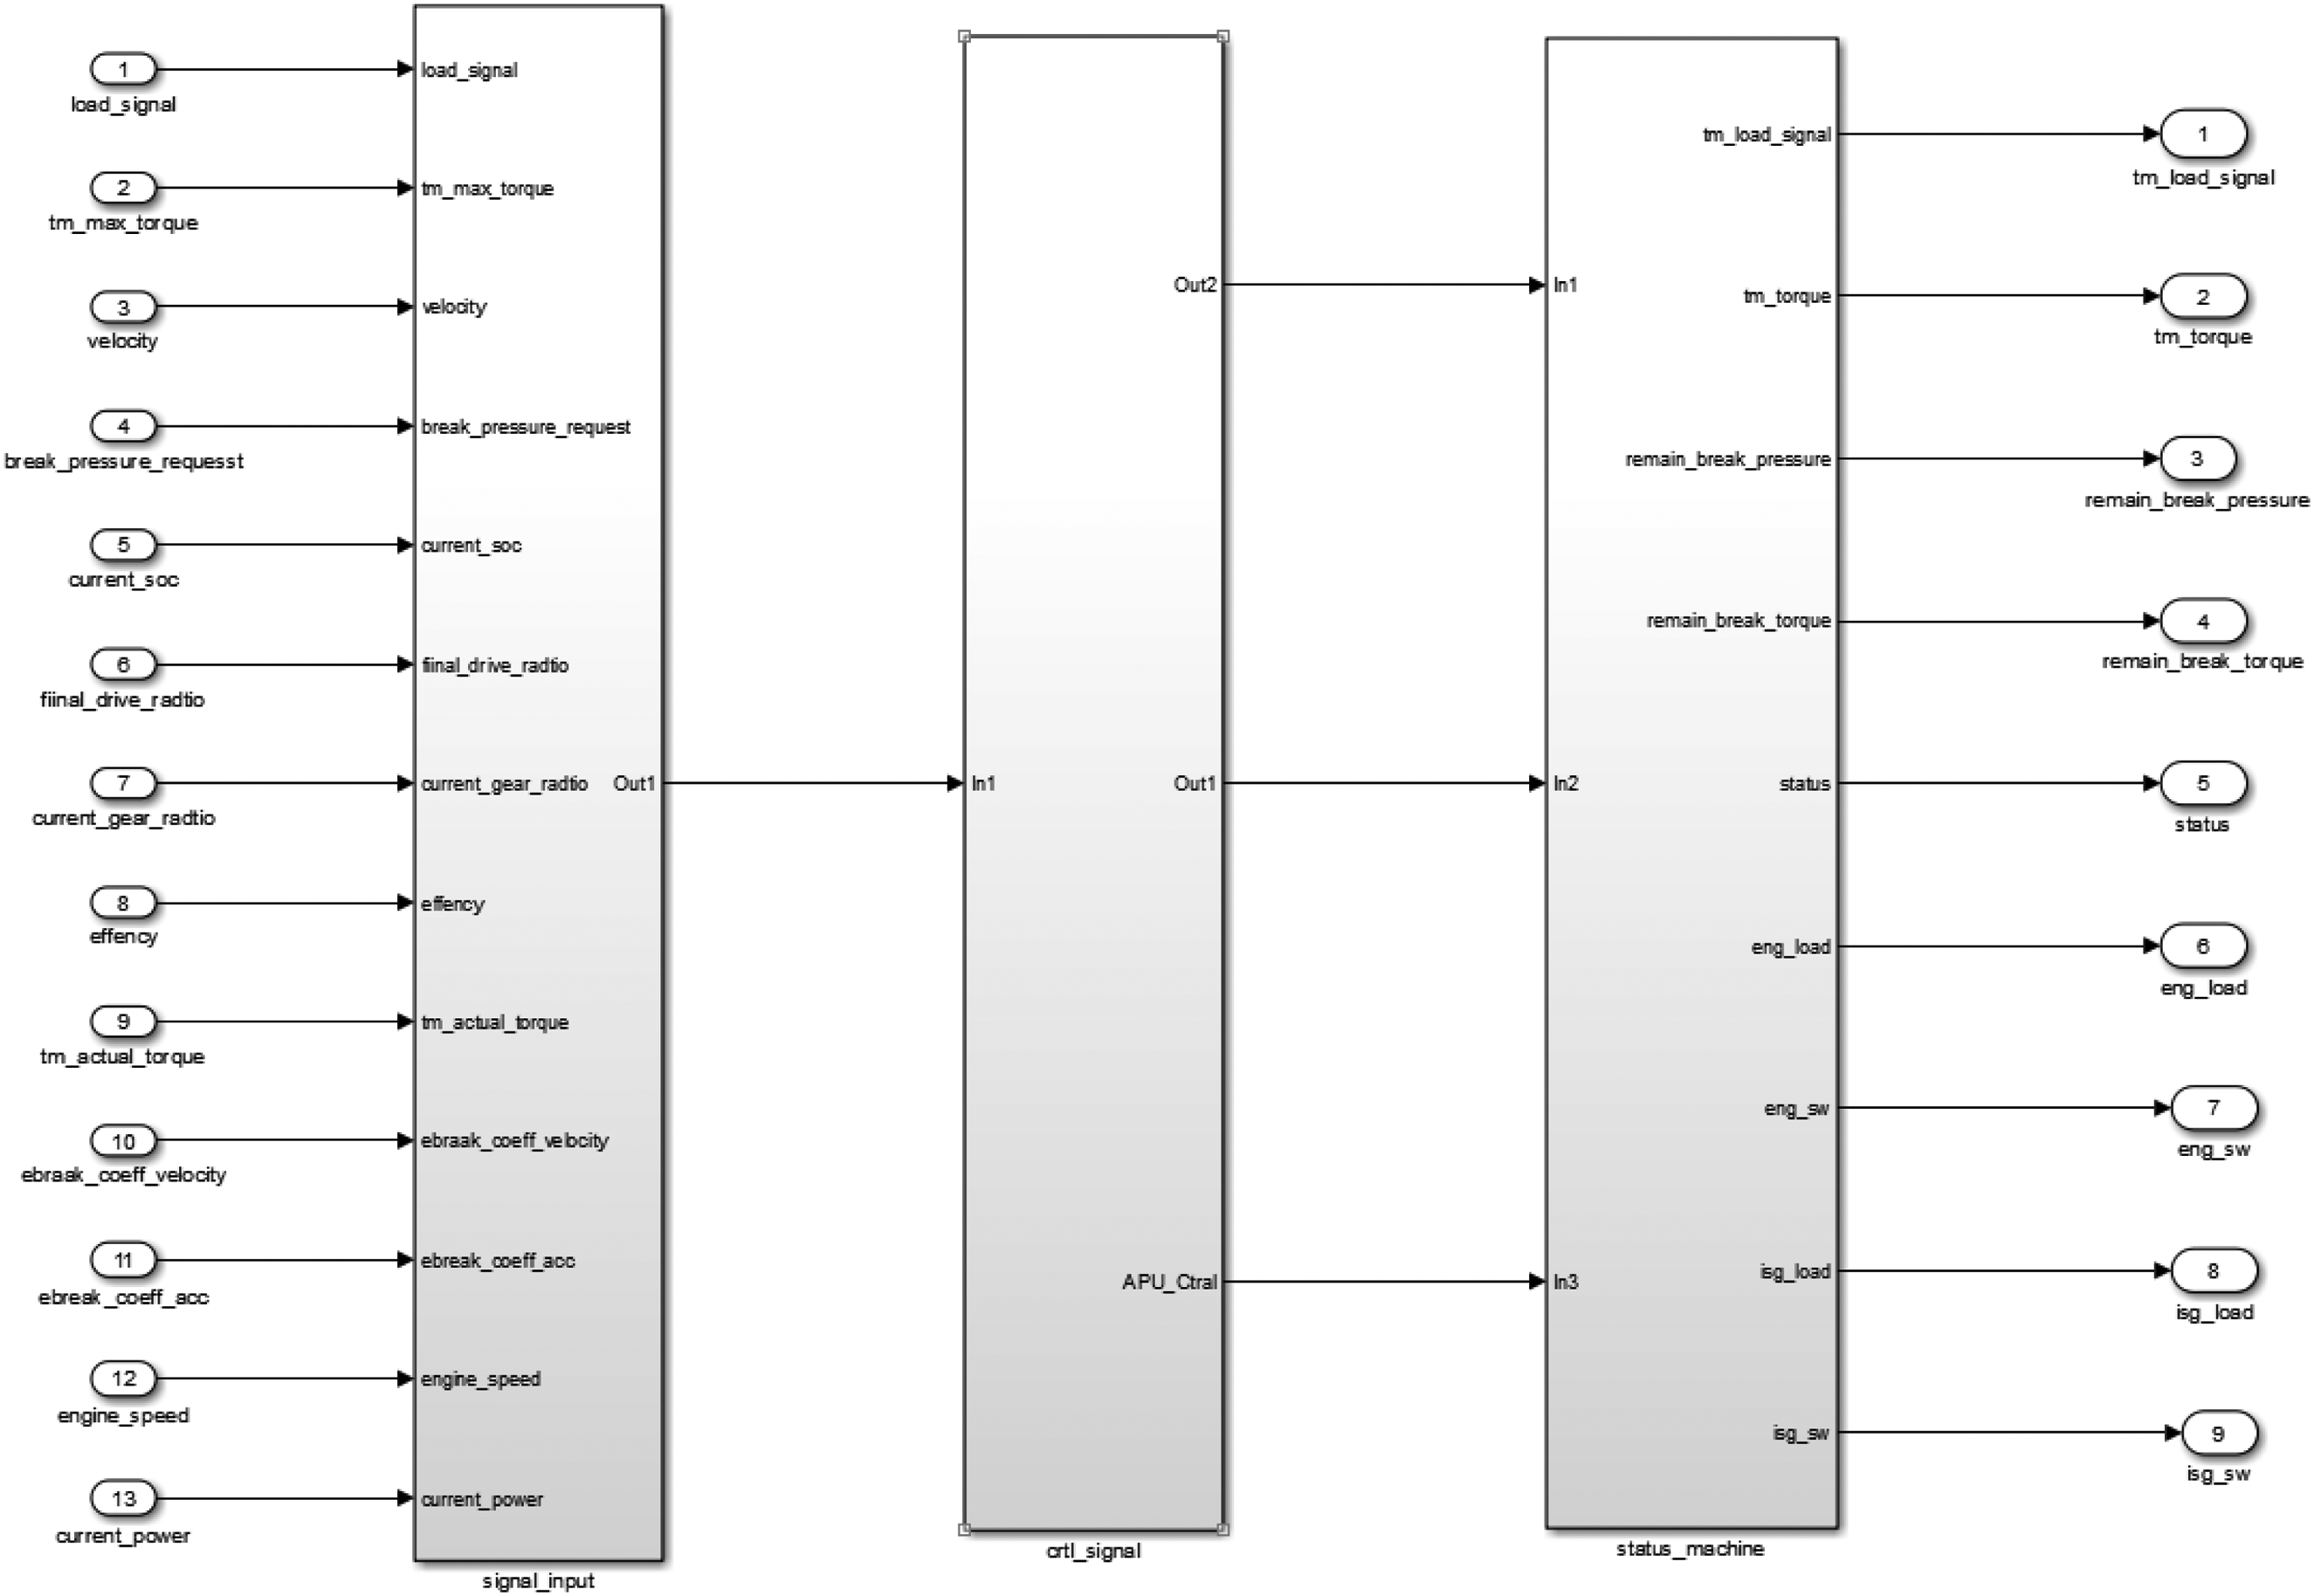
Based on the powertrain structure of the supercharged electric vehicle, CRUISE has been used to establish connections among the engine module, generator module, power battery module, drive motor module, main reduction gear module, differential module, brake module, wheel module, driver module and online simulation display module. Simultaneously, connections are established between the ASC sliding control module, constant setting module, control strategy import module (MATLAB DLL), braking energy recovery intensity, speed and acceleration modules and the motor external characteristic curve module, as illustrated in Figure 12.

The whole vehicle model in CRUISE environment.
Parameter input and signal connection
Enter the parameters for each power component of the reference model into the corresponding power components, and connect input signals, such as “load_signal,” “current_soc” and “velocity,” from the MATLAB DLL to the vehicle module to complete the information integration.
Simulation validation of hybrid control strategy
This study integrates existing rule-based constant power and power-following control strategies into a unified hybrid control rule strategy, with the control model illustrated in Figure 13 and the state switching mechanism depicted in Figure 14.
Constant power + power following hybrid control strategy model.

State switching mechanism under hybrid control strategy.
According to the established hybrid control strategy, the completed hybrid control strategy model, built in the Simulink environment and integrated with the CRUISE vehicle model, is invoked. The initial battery module value is set to 60%, with a termination value of 30%, and the cyclic task condition is set to WLTC. At the beginning of the operation, the battery begins to output power while the range extender operates in the “4” power-following state. According to the defined rules, when the vehicle speed reaches or exceeds 80 km/h, the range extender transitions to the “5” constant power state. For further clarity, the following rule-based parameters were used in the simulation: APU power output: variable based on SOC, with maximum output when SOC falls below 35%. Transition thresholds: APU engages when SOC falls below 35% and disengages above 50%. Figure 15 illustrates the power changes in the battery and the switching of the engine states throughout the operation. Specifically, a negative battery power indicates that the vehicle is in the braking energy recovery state.
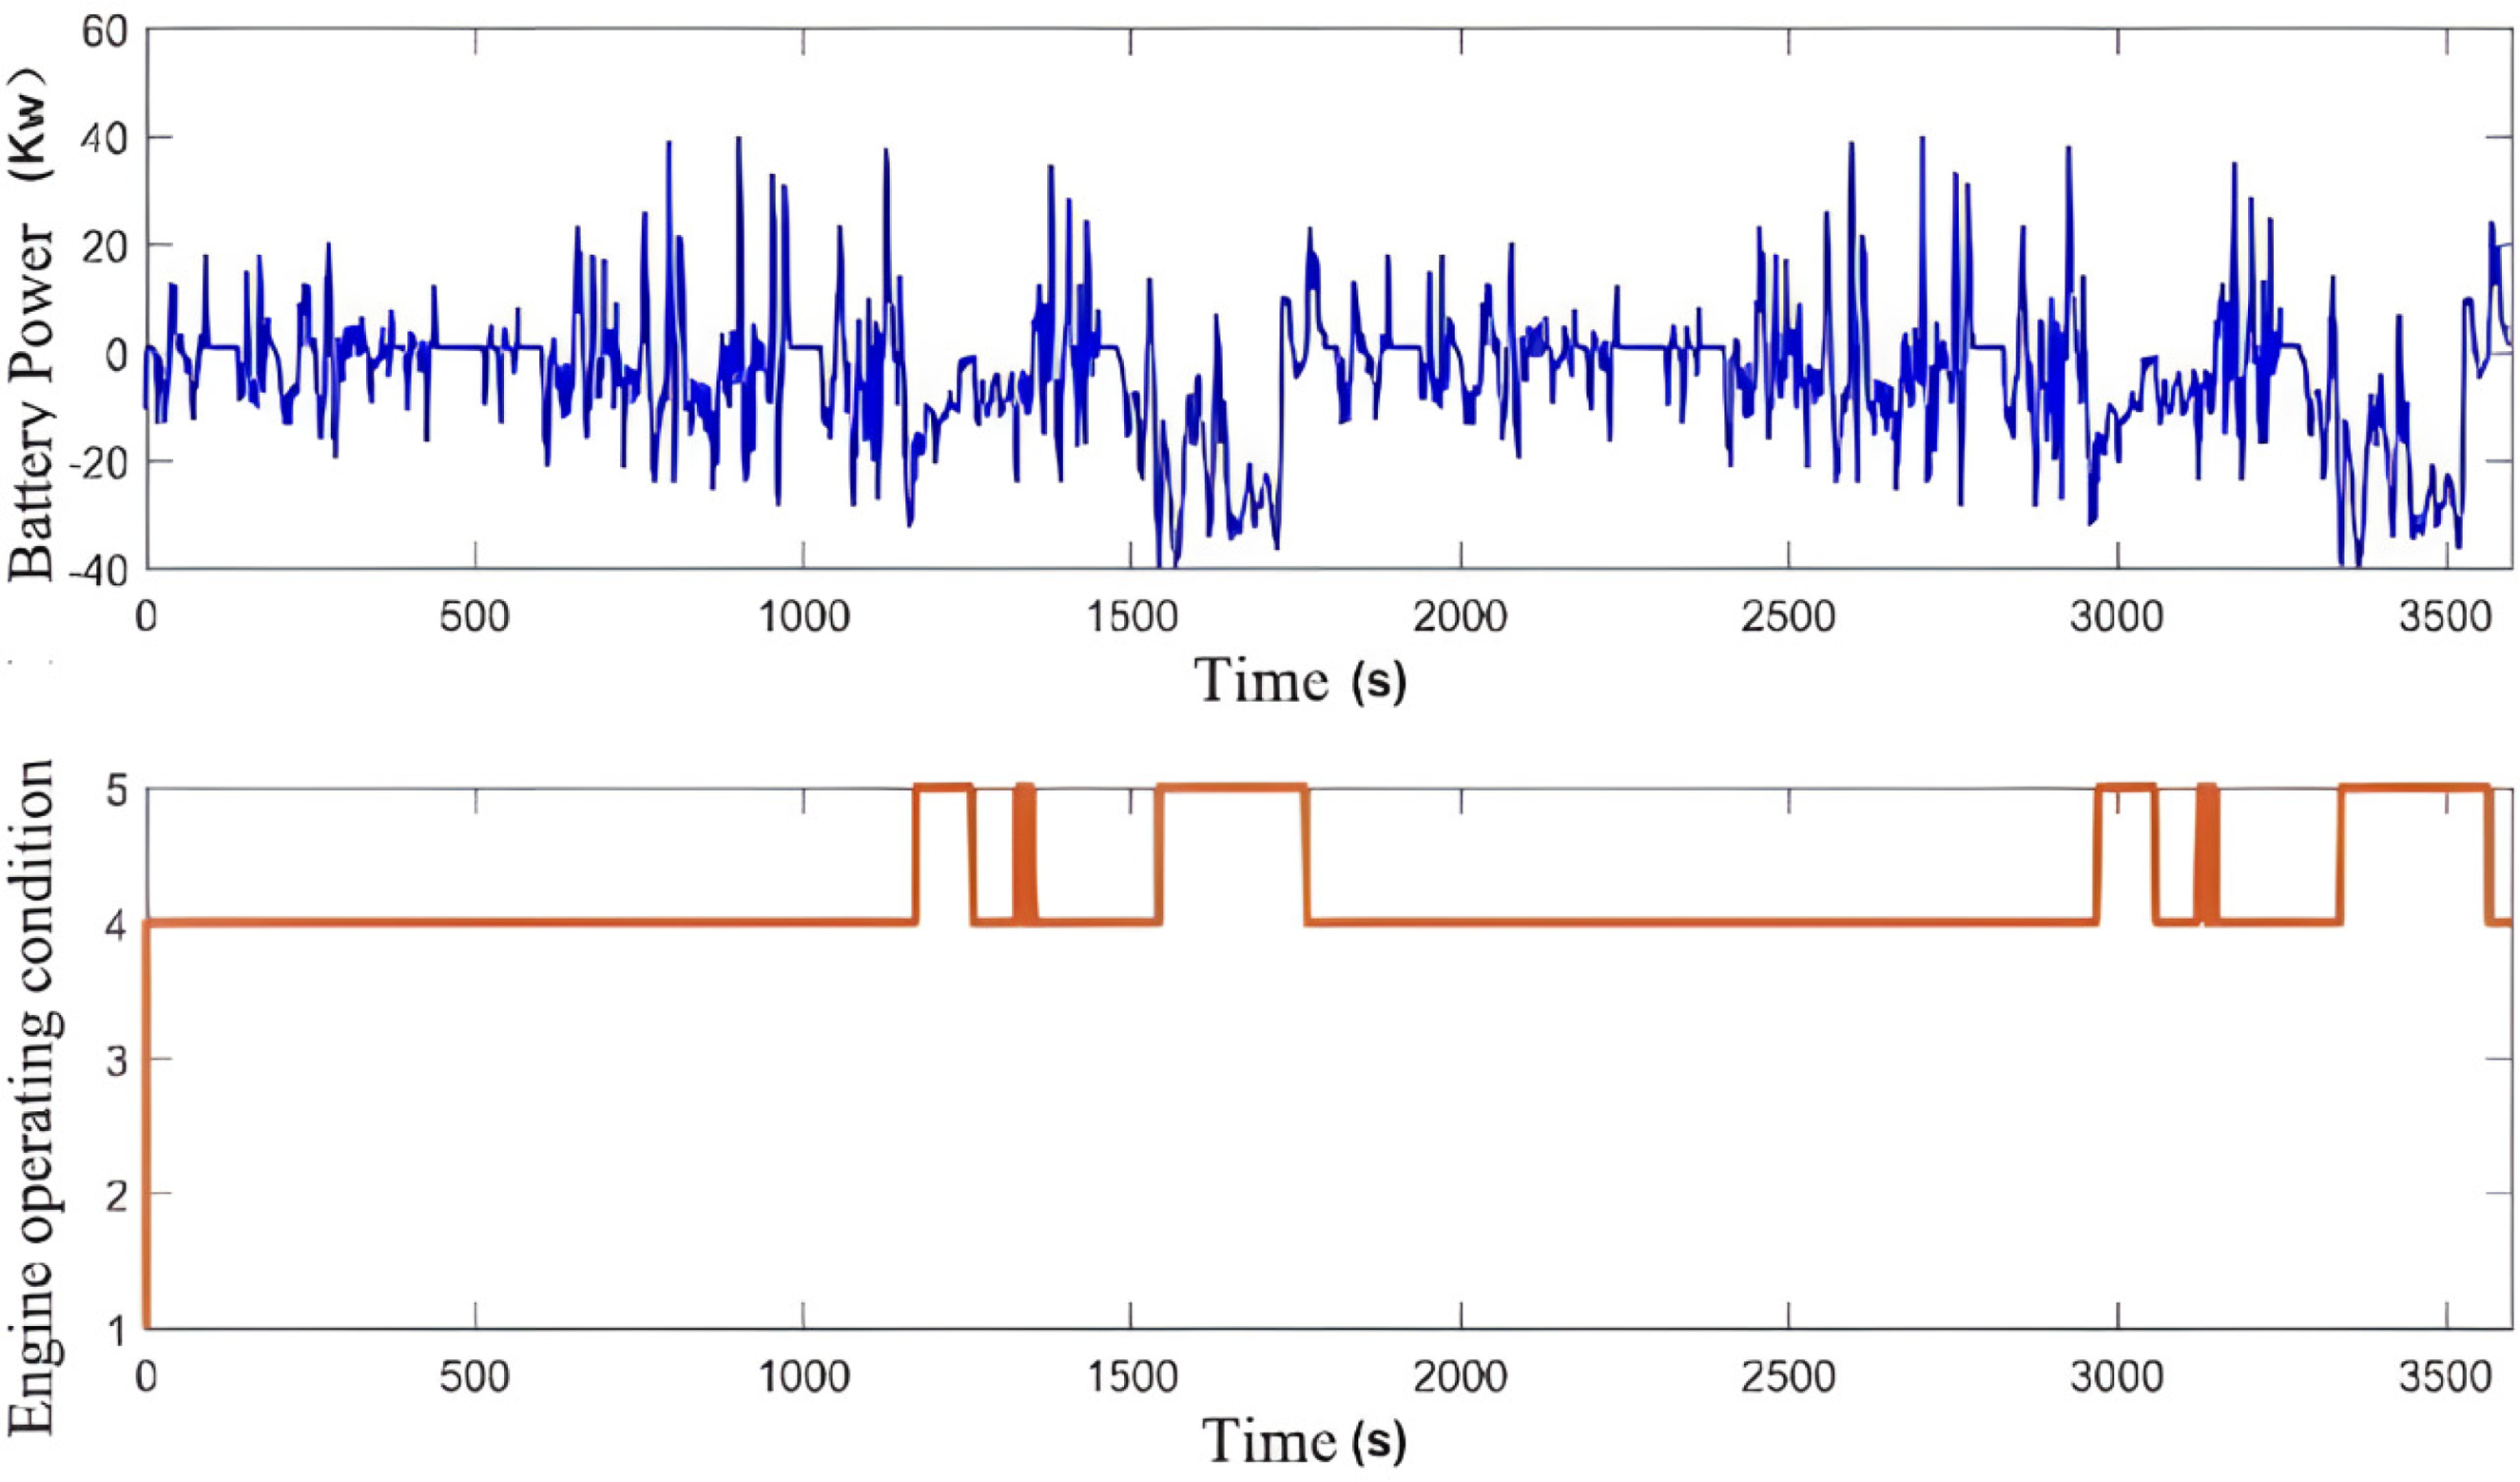
Battery power and engine state switching condition under WLTC condition.
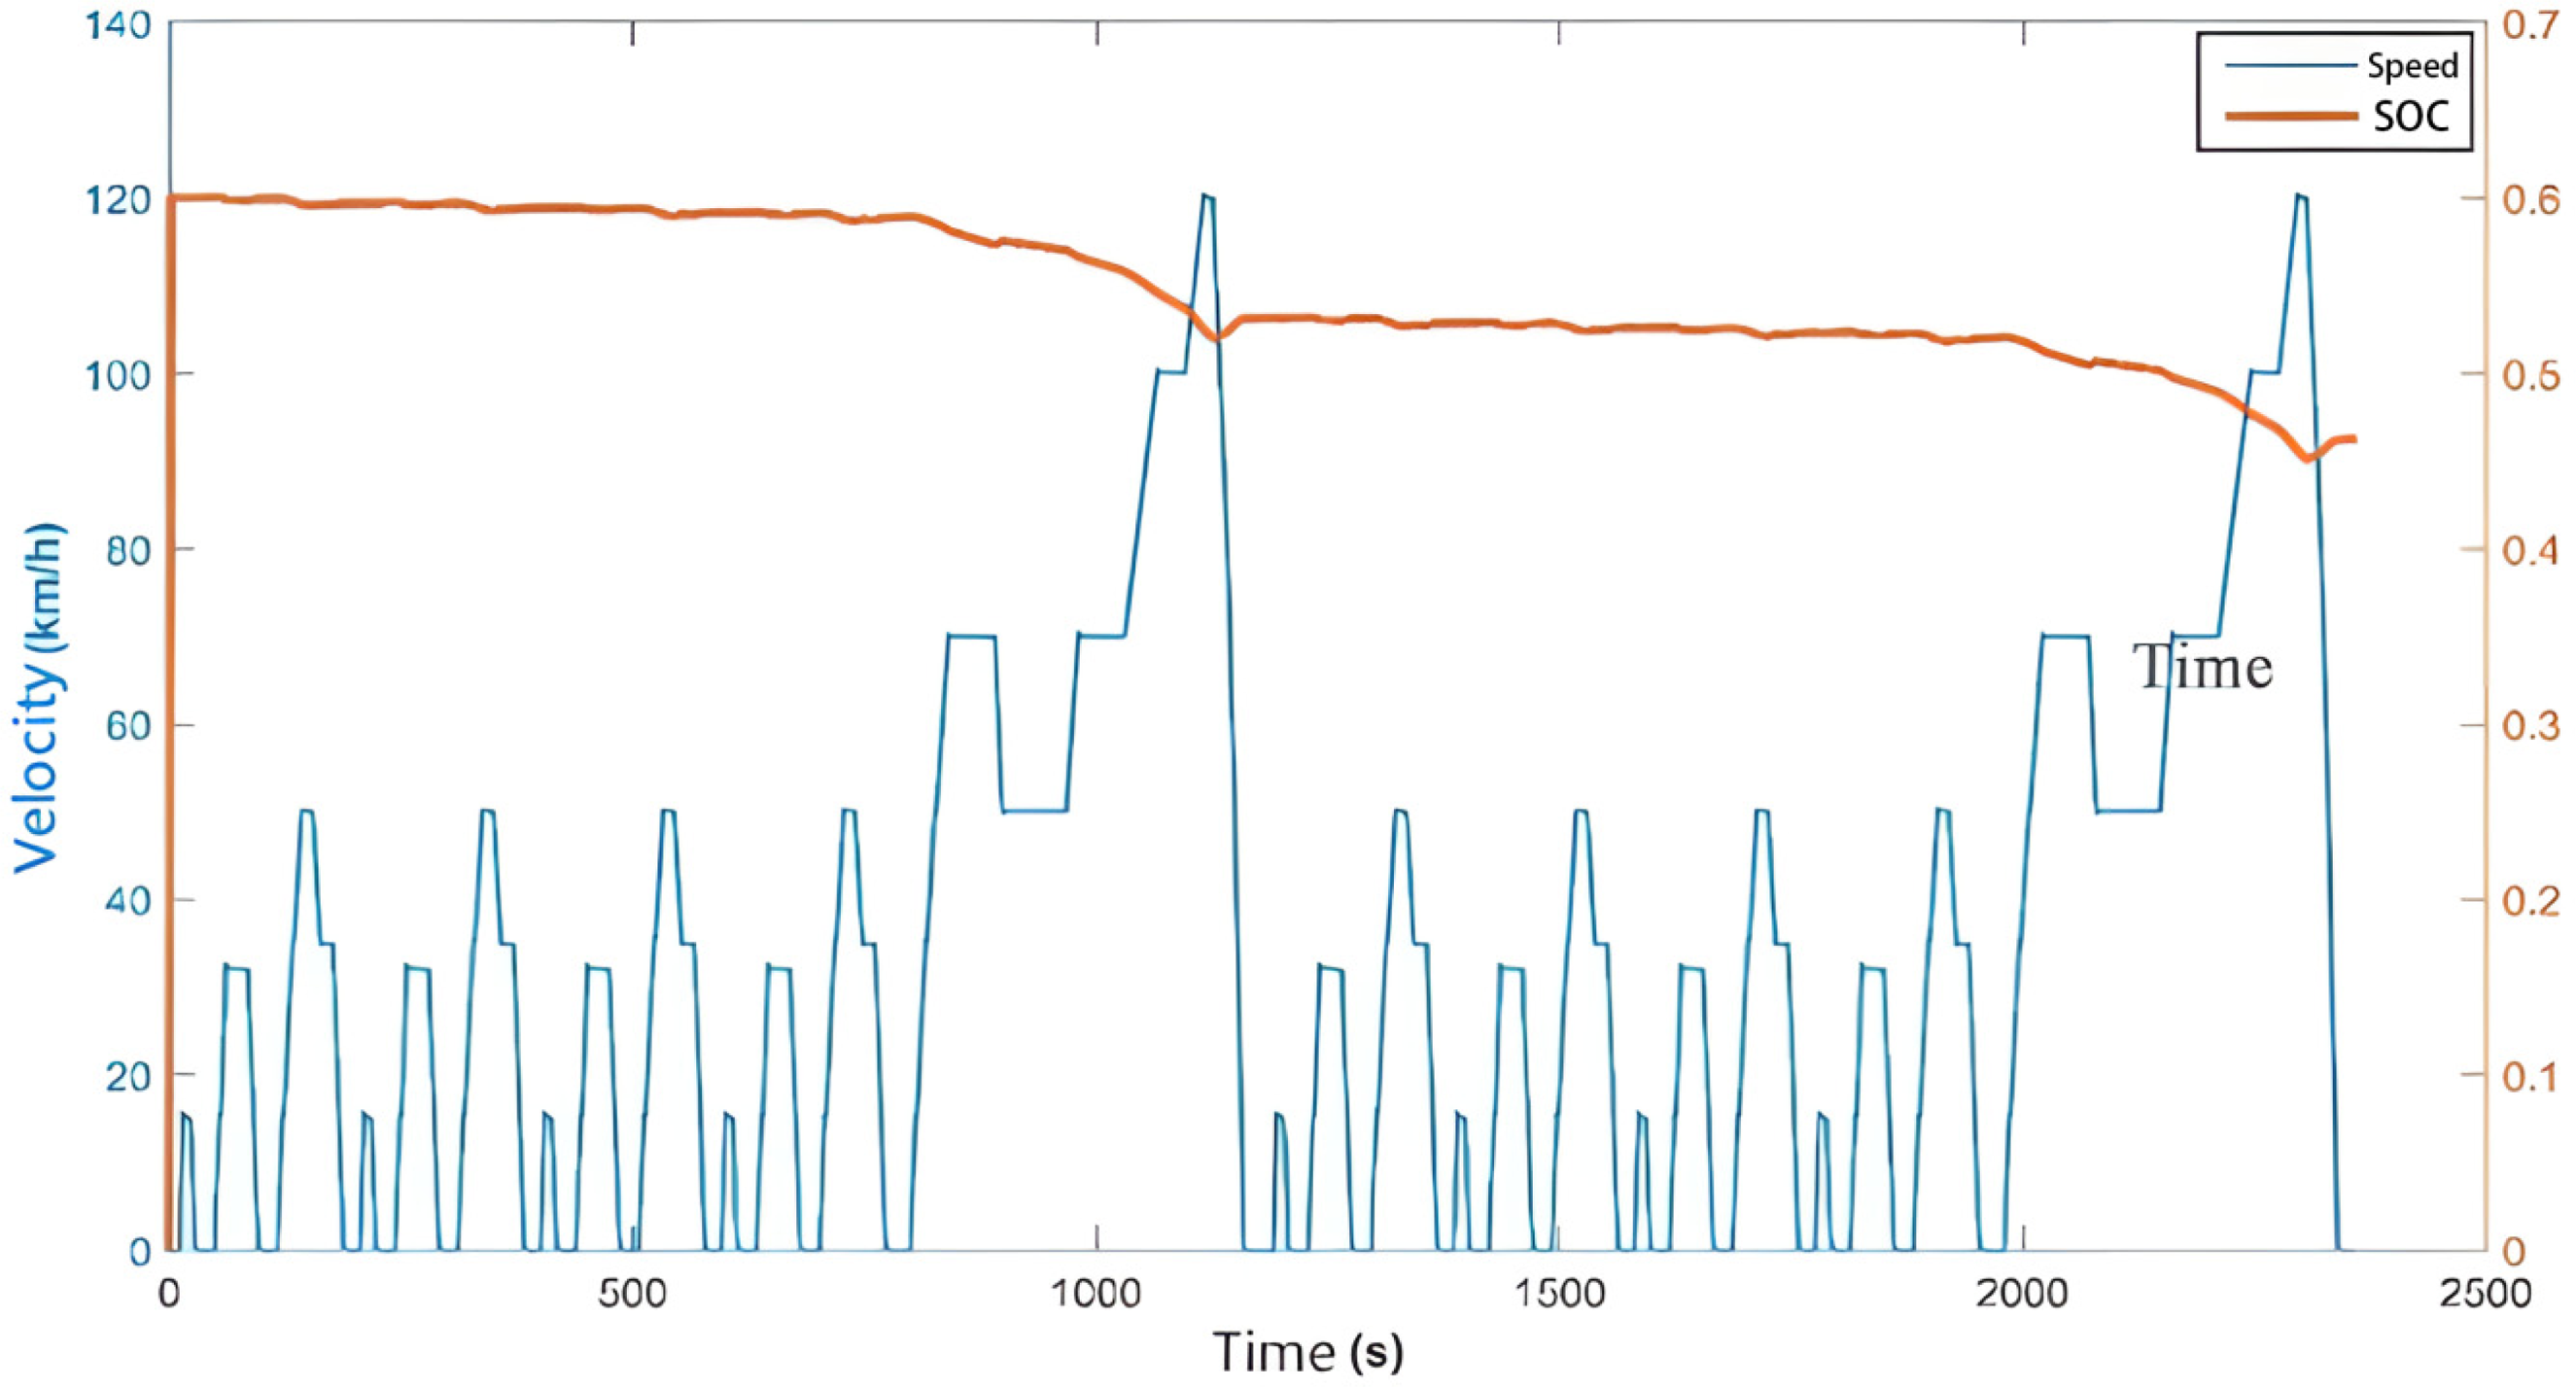
The simulated vehicle speed closely follows the target operating speed under WLTC conditions, as shown in Figure 16. Additionally, the SOC of the power battery gradually decreases from its initial value to 24.218%, which is close to the target termination value of 30%. This indicates effective energy utilization by the battery under WLTC conditions. However, higher battery power output results in greater discharge current, causing a more rapid decline in SOC at certain moments.

Vehicle speed following condition and battery SOC change under WLTC condition.
The same joint simulation method as previously described is employed to assess the adaptability of the designed hybrid control strategy under various driving cycles. The cycle condition is set to NEDC, with the initial battery module value also set to 60%. Upon running the simulation, the results shown in Figure 17 are obtained. It is evident that the battery's power output during the entire cycle varies significantly under different cycling conditions. This variation arises because the proportion of high-speed conditions (where the vehicle speed exceeds 80 km/h) differs across conditions, leading to varying degrees of state switching between the range extender's “4” and “5” modes. Consequently, the proportions of constant power versus power-following operation vary, resulting in substantial differences in battery power output.

Battery power and engine operating condition.
The simulated vehicle speed under NEDC conditions can also more closely match the target operating speed, as shown in Figure 18. Nevertheless, the final SOC value under NEDC conditions is 46.235%, which is significantly higher than the desired value of 30% observed under WLTC conditions. This discrepancy arises because the vehicle's fuel economy performance under NEDC conditions is lower compared to WLTC conditions. This is due to the reduced time spent at speeds above 80 km/h and the lower maximum speed in NEDC conditions. Consequently, a smaller portion of the battery's electrical energy is utilized, while the range extender compensates by producing more energy.
Vehicle speed following condition and battery SOC change under NEDC condition.
Simulation analysis of energy management strategies based on vehicle speed prediction
To improve the efficiency of energy allocation between a vehicle's two power sources in hybrid mode and to further adapt the energy management strategy to various road conditions, this research develops an energy management strategy based on speed prediction and validates it through simulation and comparative analysis.
Similarly, the developed energy management technique based on vehicle speed prediction is validated under two distinct operating conditions: WLTC and NEDC. The model's prediction time domain is set to 5 s, with a sampling time of 1 s. It is worth mentioning that while DP generally benefits from more extensive prediction data, the 5-s window was chosen to balance computational efficiency and prediction reliability, as prediction accuracy declines over longer time horizons. This short-term approach has shown effectiveness in simulations, particularly under frequently changing driving conditions. To further enhance accuracy, we optimized the LSTM model using the SA, which improved prediction performance in this 5-s window. Additionally, since DP operates iteratively, the cumulative effect of frequent updates enables reasonable control decisions over time, despite the shorter prediction horizon. The simulation conditions for the vehicle model include five consecutive WLTC conditions and two NEDC conditions for verification. The power battery's initial SOC is set to 68%, with a target termination SOC of 30%.
In comparison to the previously verified hybrid control strategy, the speed prediction-based energy management strategy appears to be a more effective method for energy allocation. As shown in Figure 19, the simulated vehicle speed under WLTC conditions closely aligns with the target speed, and the power battery's charge at the end of driving is nearly equal to the target value of 30% across both cycle times.

Vehicle speed following conditions and SOC change curves for 5 and 2 WLTC conditions.
To further evaluate the effectiveness of the speed prediction-based energy management strategy under various operating conditions, the simulation was conducted under five consecutive NEDC cycles and two consecutive NEDC cycles. As shown in Figure 20, the simulated vehicle speed under NEDC conditions closely matches the target speed, and the power battery's charge at the end of driving is near the target value of 30% for both cycle durations. Thus, under NEDC conditions, the speed prediction-based energy management strategy demonstrates improved effectiveness in energy distribution.

Vehicle speed following conditions and SOC change curves for 5 and 2 NEDC conditions.
The rule-based hybrid control strategy and the speed prediction-based energy management strategy in hybrid mode were simulated and verified. The changes in SOC and fuel consumption per 100 km under WLTC and NEDC conditions were compared. The speed prediction-based energy management strategy allocates energy between the two sources more effectively under varying operating conditions and optimally utilizes the power battery throughout the journey, ensuring that the SOC value reaches the set target by the end of the trip. Fuel consumption per 100 km is reduced by 6.05% and 3.50% compared to the rule-based hybrid control strategy under NEDC and WLTC conditions respectively, leading to further optimization of the vehicle's fuel economy. Table 3 shows the fuel consumption comparison of two energy management strategies.
Discussion
This paper presents progress in the study of energy management for EREVs, demonstrating that the proposed strategy effectively reduces fuel consumption and enhances overall vehicle efficiency. However, given the limitations of current practical conditions, future research should focus on the following aspects:
This study has only conducted theoretical co-simulation work on the energy management strategy without experimental validation. Future research should involve hardware-in-the-loop simulations or real-vehicle testing of the energy management strategy with automotive-grade controllers to provide more robust validation for its optimization.
The engines and motors in the vehicle simulation model were modeled experimentally, without considering the dynamic characteristics of these key power components. Future work should incorporate the dynamic characteristics of the power components to enhance the accuracy of the vehicle simulation model.
The energy management strategy developed in this paper relies on the driver manually switching driving modes based on driving habits. However, with the rapid advancement of vehicle networking technologies, such as 5G and other information technologies, future developments could integrate real-time interaction data between “vehicle and road,” “vehicle and human” and “vehicle and vehicle.” This would enable intelligent switching between different driving modes via the corresponding control system. By leveraging this real-time interaction data and intelligent mode switching, the control strategy could be better suited to current driving conditions and environmental factors, optimizing the energy output between the two power sources in the EREV. And Table 4 shows the comparison of this study with prior literature.
Conclusion
In this research, we initially involved matching the parameters of key components of the supercharged electric vehicle's power system based on existing performance indices and vehicle parameters. The energy management strategy was developed in the SIMULINK environment, while the construction and verification of the vehicle simulation test platform for the programmable electric vehicle were carried out in the CRUISE environment.
This research proposes an energy management strategy based on speed prediction, utilizing the LSTM speed prediction model. The objective of this approach is to ensure that the energy management strategy adapts to varying driving conditions, optimally utilizes the power battery while maintaining normal driving, and allocates energy between the two power sources to enhance economic performance. The four hyperparameters of the LSTM prediction model were optimized using the SA to further enhance prediction accuracy. The prediction performance before and after optimization was evaluated under random working conditions. The results show a significant improvement in prediction accuracy compared to the pre-optimization period, with RMSE decreasing from 5.9044 to 3.1608 (a reduction of 46.46%) and MAE decreasing from 4.5117 to 2.0543 (a reduction of 54.46%).
An energy management strategy for a REEV based on the optimized speed prediction algorithm was developed and simulated for verification. The results indicate that the speed prediction-based energy management strategy reduces fuel consumption by 6.05% and 3.50% under WLTC and NEDC conditions, respectively, compared to the rule-based hybrid control strategy, thereby further optimizing the vehicle's overall fuel economy.
Footnotes
Acknowledgments
The authors acknowledge the guidance and comments of many specialists in this article.
Declaration of conflicting interests
The authors declared no potential conflicts of interest with respect to the research, authorship, and/or publication of this article.
Funding
The authors disclosed receipt of the following financial support for the research, authorship, and/or publication of this article: The authors gratefully acknowledge the financial support by the National Natural Science Foundation of China (grant no. 52202094) and Industry-University Research Cooperation Project of Jiangsu Province (grant no. 2022789) and Jiangsu Province Postgraduate Research and Practice Innovation Programme Project (grant no. XSJCX23_66).