
Abstract
The outbreak of major public health emergencies such as the coronavirus epidemic has put forward new requirements for urban emergency management procedures. Accuracy and effective distribution model of emergency support materials, as an effective tool to inhibit the deterioration of the public health sector, have gradually become a research hotspot. The distribution of urban emergency support devices, under the secondary supply chain structure of “material transfer center-demand point,” which may involve confusing demands, is studied to determine the actual situation of fuzzy requests under the impact of an epidemic outbreak. An optimization model of urban emergency support material distribution, based on Credibility theory, is first constructed. Then an improved sparrow search algorithm, ISSA, was designed by introducing Sobol sequence, Cauchy variation and bird swarm algorithm into the structure of the classical SSA. In addition, numerical validation and standard test set validation were carried out and the experimental results showed that the introduced improved strategy effectively improved the global search capability of the algorithm. Furthermore, simulation experiments are conducted, based on Shanghai, and the comparison with existing cutting-edge algorithms shows that the designed algorithm has stronger superiority and robustness. And the simulation results show that the designed algorithm can reduce vehicle cost by 4.83%, time cost by 13.80%, etc. compared to other algorithms. Finally, the impact of preference value on the distribution of emergency support materials is analyzed to help decision-makers to develop reasonable and effective distribution strategies according to the impact of major public health emergencies. The results of the study provide a practical reference for the solution of urban emergency support materials distribution problems.
Keywords
Introduction
As a primary means of responding to health and safety emergencies, emergency material distribution plays a crucial role in the prevention and control of major public health emergencies such as novel coronavirus. Its distribution rationality and dynamic responsiveness have become a hot spot for researchers.1–3 Considering that the outbreak of a major health care problem is mainly concentrated in urban areas, and due to the complexity of the impact of such events, it is difficult to guarantee the effectiveness and speed of distribution referring to the traditional three-level supply chain structure of “material supply point-material transfer center-demand point.” Therefore, the current distribution of emergency supplies for urban areas is only considered the secondary supply chain structure of “material transfer center-demand point.” 4
The urban emergency support material distribution problem (UESMDP) is still essentially a variant of the vehicle routing problem (VRP), whose main research involves a multi-center and multi-objective vehicle routing planning problem. 5 To reflect the real distribution situation under a major public health event outbreak, researchers have extended a variety of decision factors based on the basic distribution model. Liu et al. designed a new modelling approach to solve problem of the unreasonable material distribution, in the early stages of the COVID-19 outbreak and established a dynamic distribution model to update distribution routes of vehicles. 6 Added to that, Bodaghi et al. analyzed the emergency material distribution under multiple resource scheduling, constructed an emergency relief model involving expendable materials, and compared six heuristic algorithms to propose an effective solution for material distribution. 7 However, the above research cannot be effectively applied to the problem of uncertainty in demand for emergency supplies; the main reason is that the patient health is not defined and the situation of urban personnel is unclear at the early stage of the outbreak of infectious major public events such as COVID-19.
Similar to the uncertainty of demand under the impact of an epidemic, there is uncertainty of demand involved in supply chain management or logistics scheduling, for which researchers have introduced fuzzy mathematics into the analysis of the problem. Based on the fuzzy mathematics these actual problems involving uncertainty can be modelled and solved, where in the job-shop scheduling problem (JSP), Li et al. investigated the fuzzy hybrid green shop scheduling problem with fuzzy processing time, and expressed the shop operation time using triangular fuzzy numbers. Then proposed a discrete artificial bee colony algorithm to solve the problem efficiently. 8 Gao and Wang et al. then designed the improved DE algorithm and the hybrid adaptive differential evolution algorithm to efficiently solve the fuzzy JSP.9,10 In addition, in the VRP, Zhou et al. introduced the fuzzy demand to access goods into VRP and constructed a multi-objective optimization model from the risk perspective. 11 Added to that, Fan et al. introduced fuzzy demand and fuzzy time window into VRP and established a multi-objective fuzzy opportunity constraint model, which fully considered the uncertainty information in real distribution tasks. 12 Yang et al. considered soft time windows based on fuzzy demand and fuzzy time windows for minimizing logistics costs. 13 Li et al. have similarly studied the VRP with multiple time windows under fuzzy demand and developed a two-stage hybrid optimization algorithm to solve the problem. 14 In a nutshell, the general distribution model can no longer meet the demand of emergency material distribution under major public health emergencies with serious social hazards such as COVID-19. For that, this paper focuses on the combination of fuzzy demand and emergency support material distribution problems to explore a realistic and feasible distribution model under the influence of COVID-19.
In terms of solving the UESMDP, researchers currently use mostly the meta-heuristic algorithms to solve the problem as it is essentially an NP-Hard problem with high complexity and difficulty to solve. 15 The genetic algorithm (GA), 16 particle swarm optimization (PSO), 17 and bat algorithm 18 have been used for the solution. In addition, as the size and the complexity of the problem increase, the general metaheuristic algorithms lack convergence accuracy and speed. So, to further improve the optimization capability of algorithm, researchers have introduced a hybrid mechanism, based on the metaheuristic algorithm.19–21 Among them, Wang et al. designed a two-stage multi-objective evolutionary algorithm, and the simulation experimental results showed that this algorithm has a strong solving ability, but its effectiveness needs improvement. 22 On the other hand, Zhang et al. combined the ant colony optimization algorithm (ACO) with artificial immunity to design an improved immune ACO, and the algorithm comparison results showed that the solution time of the new designed algorithm was shorter. 23 Based on the above research, it can be seen that the hybrid metaheuristic algorithms have better gains for solving large-scale complex optimization problems and are a feasible direction to study the solution of urban emergency material support distribution problems. The sparrow search algorithm (SSA), as a new swarm intelligence algorithm, was first proposed by Xue and Shen in 2020, 24 and SSA has been widely used in some areas.25–28 Among them, Gad et al. introduced random repositioning strategy and novel local search algorithm to the traditional SSA to improve SSA to study the feature selection problem in machine learning and data mining tasks. 26 Xian et al. studied fuzzy time series based on SSA model for dealing with time series with trends and disturbances. 27 Zhang et al. improved SSA by designing a linear path strategy, neighborhood search strategy, and multi-index comprehensive evaluation method so that it can better solve the bioinspired mobile robot path planning problem. 28 In the above studies, the improved SSA has certain advantages in terms of optimization speed and accuracy compared with other classical population intelligence algorithms (ACO, GA, etc.). Therefore, the aim of our paper is to explore the possibility of SSA in emergency material dispatching problems and to provide a new solution for this kind of complex vehicle path planning problems.
In conclusion, this paper focuses on the distribution of urban emergency support materials based on fuzzy demand. Firstly, the urban community demand, under major public health emergencies such as COVID-19, is characterized by on triangular fuzzy numbers. Thus, a heterogeneous vehicle distribution optimization model, involving multiple material transfer centers and multiple materials, is established. The distribution paths are initialized with clear values for fuzzy demands and they determine whether the vehicle will carry out material distribution through Credibility theory.11–14 Furthermore, based on the traditional SSA, the local and the global search capabilities of the algorithm are enhanced by introducing improvement strategies such as the Cauchy variation, opposition-based learning, and adaptive strategy. The strategies also reduce the blindness of the algorithm while retaining its extensive search capability to solve the problem effectively. In addition, a simulation experiment is carried out in Shanghai as the simulation background of urban emergency support material distribution, and results were compared to existing cutting-edge algorithms. These results show that the designed algorithm has strong robustness and superiority. Finally, a sensitivity analysis is conducted for the preference value in the Credibility theory, which helps distribution decision-makers to apply strategies according to the impact of different major public health emergencies, and also provides effective reference for real urban emergency support material distribution.
To sum up, this paper will be divided as follows: In the second section, we introduce the process of establishing the optimization model for the UESMDP. Then, the traditional and improved SSA (ISSA) are provided in the third section. The numerical verification and simulations results are provided in the next section and comparison between the different methods is also established. Finally, we analyze the parameters in the model and summarize the research of the paper.
Establishment of an optimization model for UESMDP
Problem description
Under a major public health emergency, emergency supplies can effectively inhibit the development of the event. Different from the three-level supply chain structure of “material supply point-material transfer center-demand point” of the general material distribution, individuals, in urban zone, can directly transport material assistance from different areas to the affected one through the material transfer centers. Thus, in order to effectively alleviate the pressure of the transfer center and make the demand of each community in the city reasonably satisfied, this paper focuses on the optimization of the distribution under the secondary supply chain structure of “material transfer center-demand point.” Figure 1 shows the distribution diagram path.

Distribution diagram.
Problem assumptions
The below points represent the problem assumption constraints of this system:
The emergency support materials distributed are all expendable, that is, therapeutic drugs, testing reagents, extermination supplies, etc. The selection of major hospitals in the city as material transfer centers. All kinds of tools in the material transfer center are adequate. Each community can be served by one vehicle, and every vehicle must return to the material transfer center. Each vehicle will depart at 8:00 AM.
Model establishment
Fuzzy demand model for emergency support materials
In the case of an epidemic outbreak, urban communities, as basic personnel management units, usually distribute emergency support materials according to communities’ needs. Because of the uncertainty of community personnel, managers cannot determine the exact demand, but can predict the lowest (most conservative) and the highest (most aggressive) demands for materials in their community. Uncertain customer demand for the dispatch center means that the dispatch center cannot accurately pre-dispatch, and therefore often leaves dispatch vehicles at full capacity when they leave the dispatch center, which not only leads to a waste of resources, but also makes it impossible to manage resources accurately, especially when supplies are limited. Thus, such fuzzy demands are likely to cause problems such as difficulty in distributing emergency supplies, poor accuracy, and low satisfaction rate of materials. Therefore, this paper uses triangular fuzzy numbers to characterize the uncertain demand for materials at communities in order to facilitate the establishment of distribution models. The demand for each emergency material a for each community i can be represented by the triangular fuzzy number
Furthermore, after characterizing the community demand using the triangular fuzzy number, considering that the triangular fuzzy number only gives a specific range, which makes it difficult to define pre-scheduling arrangements for materials. For this reason, the expected value of the triangular fuzzy number is used for pre-scheduling, and the reliability calculation is applied to measure the service capability during the material distribution process to decide whether the vehicle continues to serve the next community. The expected value of the triangular fuzzy number of the community point material demand is calculated as shown in equation (1), and the reliability is delivered in equation (5).


From equation (5), we know that Cr varies between 0 and 1, and a larger value of Cr indicates that the vehicle is more able to satisfy the demand of community point j. Further, the fuzzy chance constraint is introduced, and the service preference value
Emergency support material distribution optimization model
Under the major public health emergencies represented by COVID-19, a timely and fast emergency supplies dispatch response will greatly inhibit the deterioration of the event. Thus, it is of strong practical significance to minimize the distribution time cost as the being the main optimization objective. Based on the above analysis and the established fuzzy demand model for emergency supplies, an optimization model for emergency support materials distribution is constructed as shown below:


As for the constraints, they are defined as follows:


Improved sparrow search algorithm
Traditional SSA
SSA was inspired by the foraging and anti-predatory behaviors of sparrows. A population of sparrows was composed of discoverers, vigilantes, and followers, and thus optimized in a continuous iterative process. The specific stages are shown below.
Foraging behavior
Discoverers in sparrow populations are responsible for searching locations with high density of food in the region, thus providing the area and direction for foraging. The discoverers with better fitness values will have priority in obtaining food. After the followers reach the foraging search range of the discoverer, the discoverer can get a larger search space. The location of the discoverer is updated as follows:

Where, rand(1) indicates to generate a random number between 0 and 1, t denotes the number of current iterations,
When

The effect of ST taking on the SSA search space.
After a follower joins a finder's foraging area, some of the followers will monitor the finder. If the finder gets a better foraging area (i.e. if the discoverer finds a solution space that gives a better value for the objective function, the follower will move with the discoverer towards the better solution space), the followers will immediately leave their current position to grab the new foraging position of the finder. If the follower succeeds, it will immediately receive food. If the grab fails, the follower will leave the current area due to its low fitness value and go to another spotter's area. The location of the follower is updated as follows:

Where
Anti-predatory process
The sparrow population will also be predated by the corresponding natural predators when they are foraging, so after their appearance, the sparrow population will develop a sense of danger; thus, the sparrow population at the edge will go to the low-risk location area, and the ones in the middle will go to random location areas. The sparrow population locations for the anti-predation process are updated as follows:

where
Improvement strategies
The SSA algorithm has a strong global search capability due to its rich and characteristic search mechanism, and it can get better optimization accuracy compared to the general population intelligence algorithm. 24 However, in solving the complex VRP problem, studied in this paper, the algorithm suffers from premature development and easily falls into local optimality, as most swarm intelligence algorithms do. Therefore, it cannot be directly used to solve the UESMDP problem. Therefore, based on the search mechanism of SSA algorithm and developed model, the following improvement strategies were introduced to enhance the local and global search capability of the algorithm.
Initialize the population position based on the Sobol sequence
In order to improve the global search ability, a deterministic low-difference sequence is used instead of a pseudo-random sequence, also known as the Quasi-Monte Carlo (QMC) method. The sampling direction selected by the QMC method is more reasonable, and the sampling points are more evenly filled into the multi-dimensional hypercube unit, which has higher efficiency and better uniformity when dealing with probability problems. In this paper, the Sobol sequence is used to initialize the population:

Cauchy variation
The Cauchy distribution function has a smaller peak at the origin but a longer distribution at both ends. The use of the Cauchy variation can generate larger perturbations in the vicinity of the current variation of the sparrow individual, thus making the Cauchy distribution function wider and easier to jump out of the local optimum. Incorporating the Cauchy operator, the effect of the variation at both ends of this distribution function is fully used to optimize the calculation of the global optimal individual, and to adjust the performance of the algorithm to reach the global optimum. After the optimal solution 
Combining bird swarm algorithm to update population flight strategy
In the SSA, the larger the early warning value, the easier it is for sparrows to perceive the existence of natural enemies and move to other areas. When
Figure 3 is the schematic diagram of search strategy of SSA, and Figure 4 is the schematic diagram of search strategy of BSA. The equations in the vertical coordinates of the two figures are the way how algorithms generate a new population. It can be seen that as the number of iterations increases, the search space of SSA gradually decreases while the search space of BSA remains largely unchanged. Although the SSA search strategy allows the algorithm to converge faster, the reduced search space means that the search results will be worse. The search strategy using BSA clearly helps the algorithm to obtain better search results on a global scale. Hence, we introduce the search strategy of BSA into the structure of SSA to improve the SSA's global search capability, and the update method of finder location is as follows:

Schematic diagram of search strategy of SSA.

Schematic diagram of search strategy of BSA.

Where, randn(0,1) indicates to generate a random number with a variance of 0–1 and a mean of 0 between 0 and 1.
Further, the follower in BSA joins the discoverer with a certain probability, which not only ensures the convergence of the algorithm, but also enables the population to jump out of the local optimum and enhances the global search ability of the algorithm. Hence, the position update equation of improved SSA based on BSA is as follows:

In summary, the total pseudo-code of the designed algorithm is shown in Table 1.
Pseudo-code of ISSA algorithm.

Numerical verification
In order to guarantee the timely and effective distribution of emergency materials and to form a means of containment for major public health emergencies in time, the distribution of urban emergency support materials needs to make distribution decisions for a large number of demand points in a short period of time. Therefore, there are high requirements for the robustness of the solution algorithm under high latitude problems and the superiority of the solution. To this end, different types of test functions, at different latitudes, are selected for numerical validation, and PSO, GA, and the traditional SSA algorithm are selected for comparison with the designed ISSA algorithm, considering that PSO and GA have been used in the initial research of emergency material distribution. To ensure the validity of the validation results, the mean and standard deviation of each algorithm was taken after 30 runs on each test function. The specific test function information and validation results are shown in Appendix (Table 1) and the iteration graphs are shown in Figure 5.

Numerical validation iterative curve diagram. (A) Schwefel's Problem 1.2 Function. (B) Six-Hump Camel-Back Function. (C) Quartic Function. (D) Shekel's Function.
From Table 1 in Appendix, it is clear that the designed ISSA algorithm and the PSO, GA, and SSA algorithms are basically optimized on the low-latitude function
When assessing the performance of metaheuristic algorithms, it is not sufficient to make judgements based on mean and standard deviation alone. To demonstrate whether the results obtained by the proposed algorithm are statistically significantly different from other algorithms, the ISSA and PSO, GA and SSA algorithms are subjected to the Wilcoxon Rank Sum Test in turn. The p-value in the Wilcoxon Rank Sum Test is 0.05. If the statistical value p < 0.05, then there is a significant difference between the results of the two algorithms, and vice versa, it means that there is no significant difference. We conducted 100 Wilcoxon Rank Sum Tests of ISSA with the other three algorithms and averaged the test values as shown in Table 2.
Statistical test results.

From Table 2 it can be seen that the p-value of the designed ISSA algorithm compared to PSO, GA, and the classical SSA on the four tested functions is less than 0.05, indicating a significant advantage of ISSA's optimization capability over the above algorithms.
Simulation experiments
Standard case test
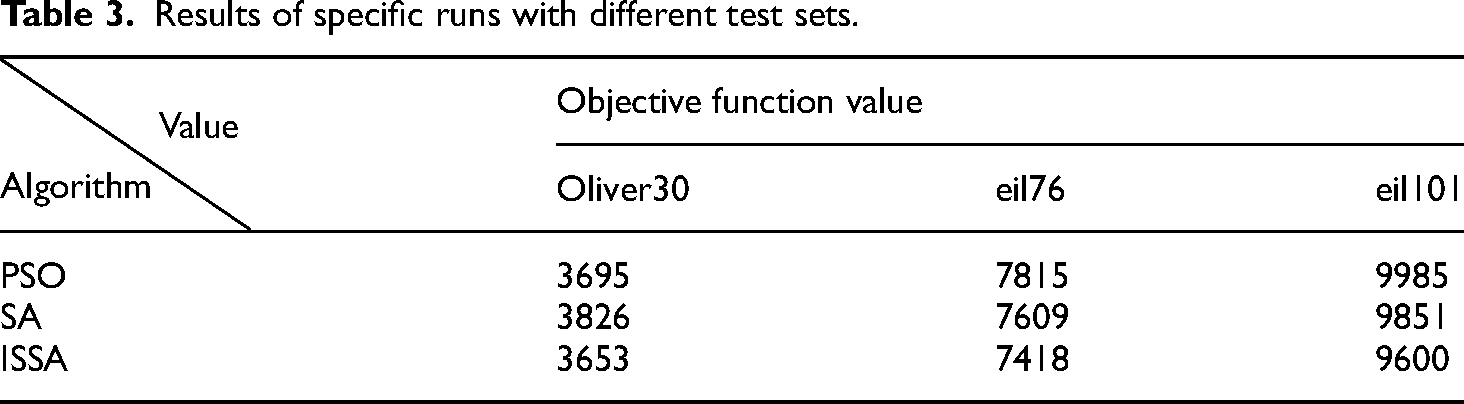
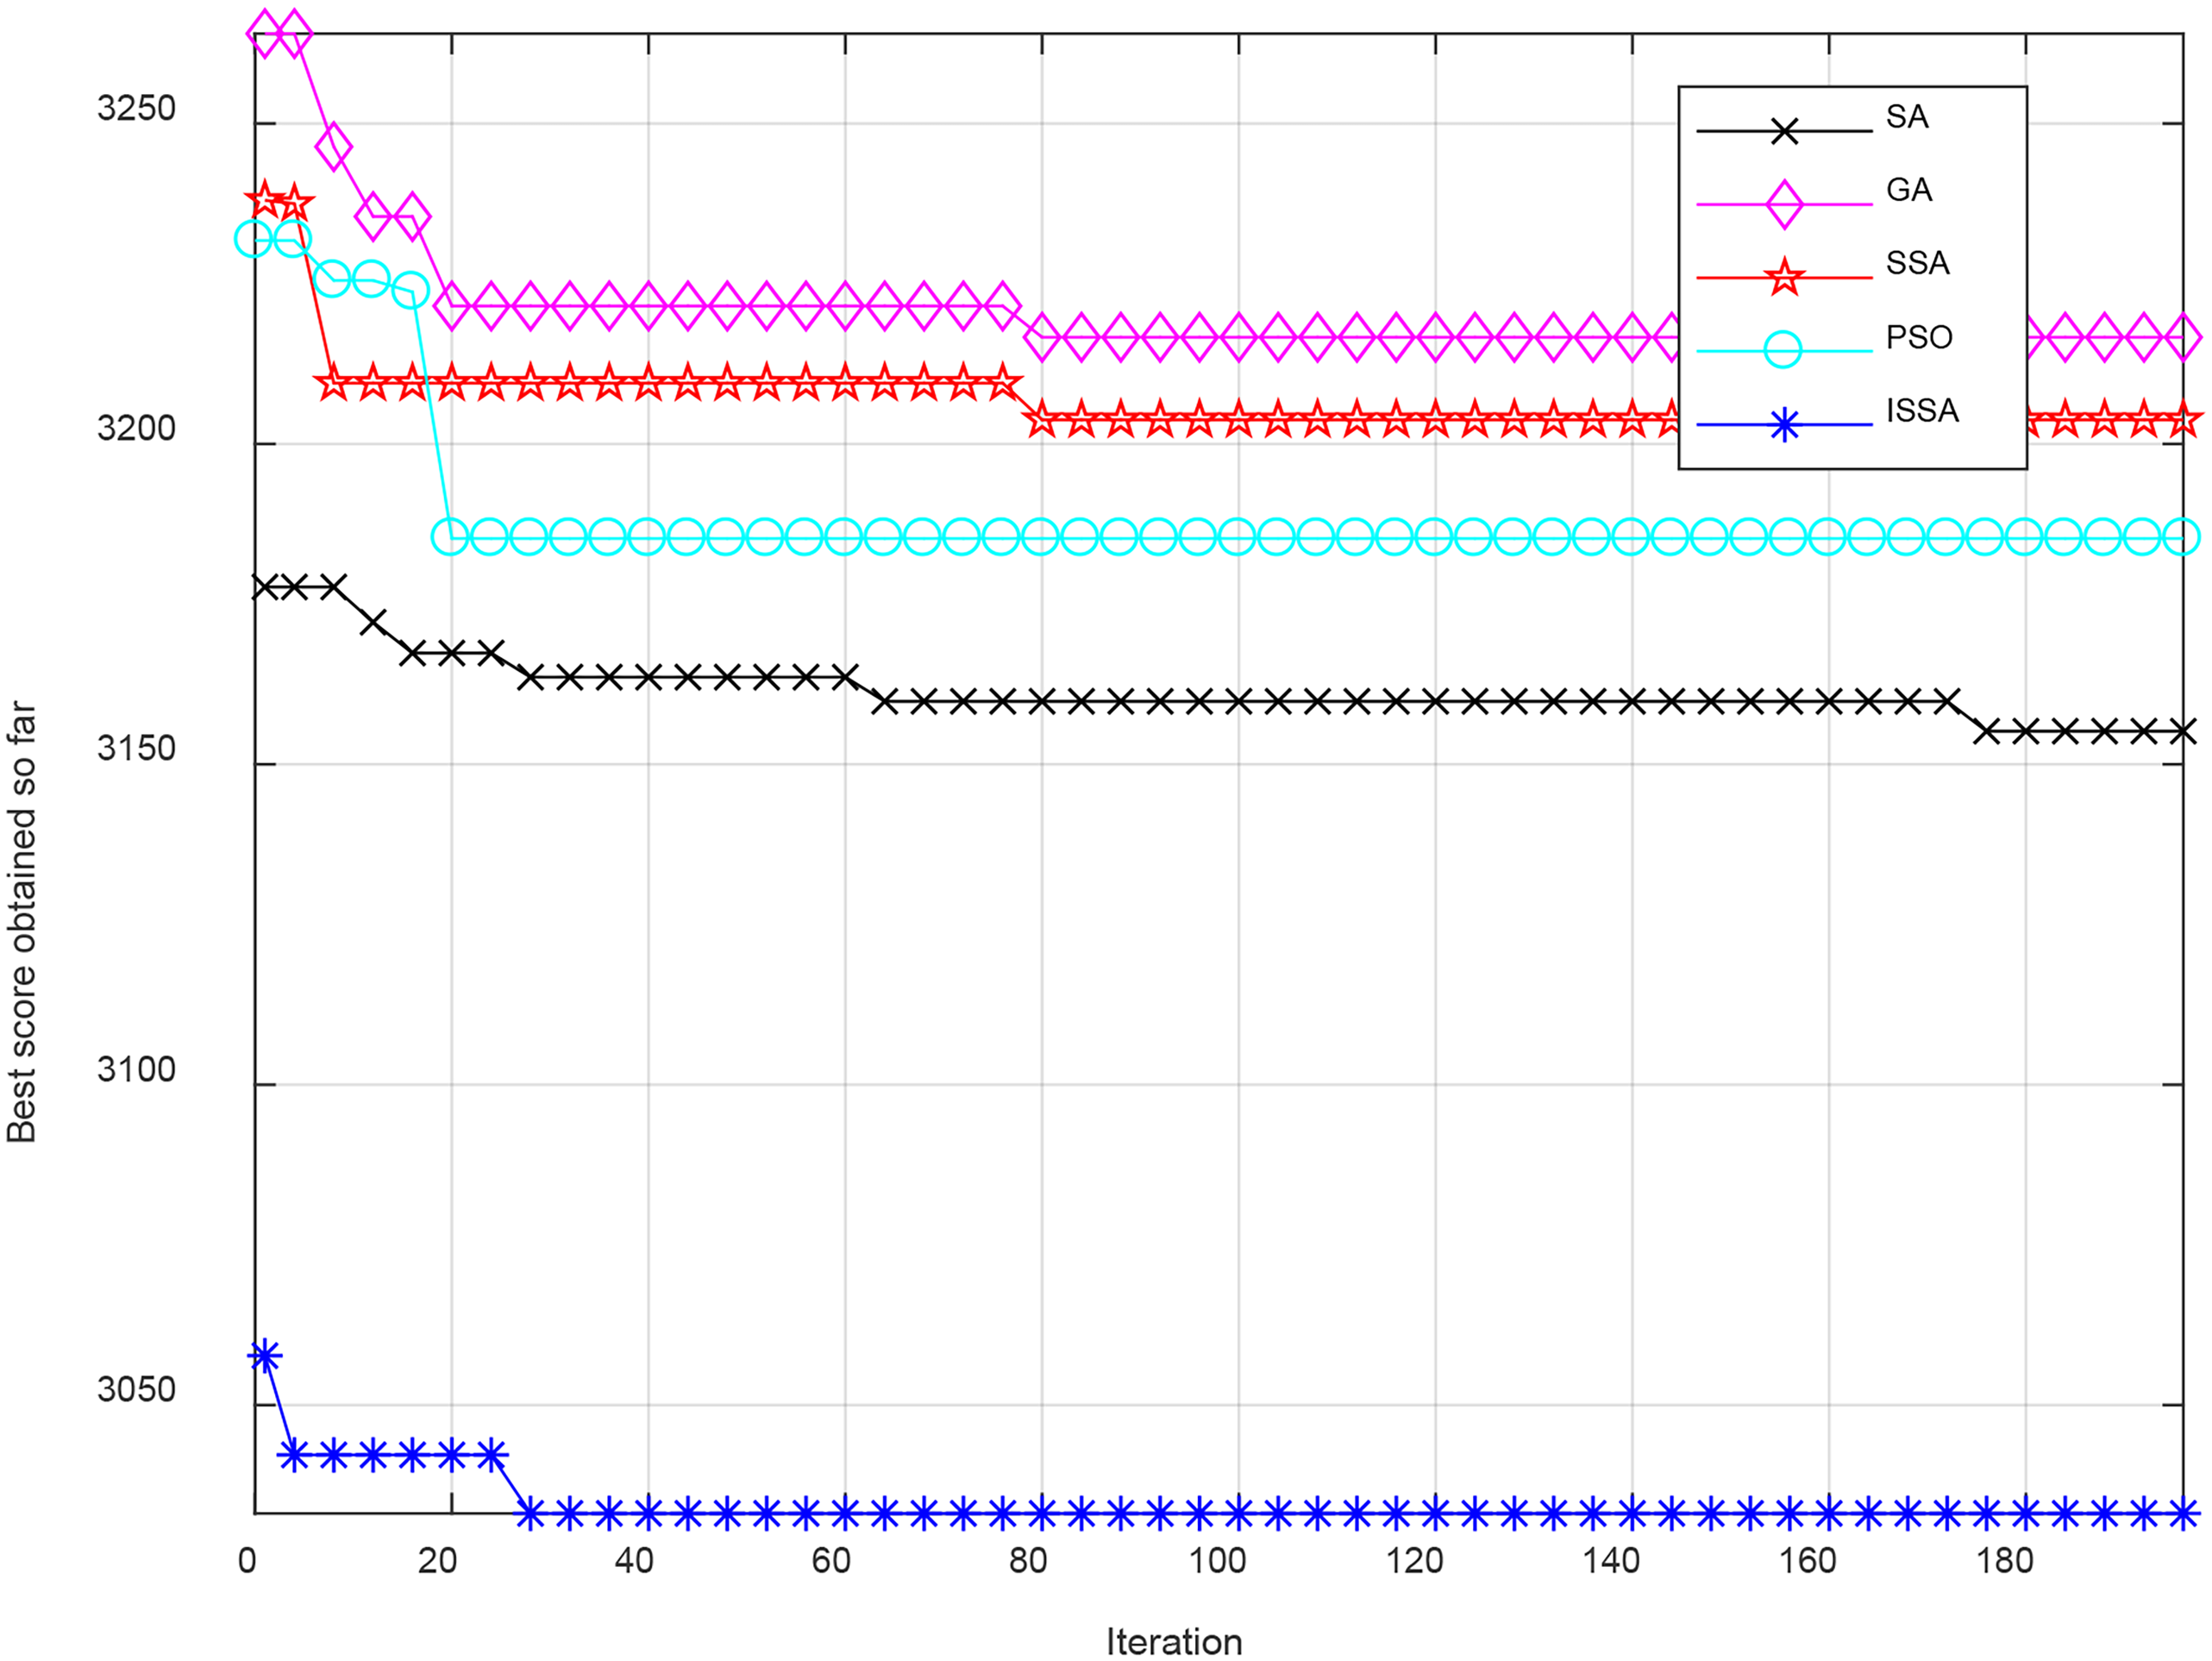
To verify the optimization of ISSA under different sized networks, three standard test sets (Oliver30, eil76, and eil101) in Travelling Salesman Problem were chosen as the locations of the test community points. And the scheduling centers’ locations were random locations within the network. The fuzzy demand for all test community points is a random value and there is no limit to the provisioning capacity of the dispatch centers. In addition, the PSO and simulated annealing (SA) algorithms were selected for cross-sectional comparison and the results of the runs are shown below. Figure 6 shows the results of the runs in Oliver30. Figure 7 shows the results of the runs in eil76. Figure 8 shows the results of the runs in eil101.

Results of ISSA, PSO, and SA runs under Oliver30. (A) Algorithm iteration curve. (B) Vehicle route map for c1. (C) Vehicle route map for c2. (D) Vehicle route map for c3.

Results of ISSA, PSO, and SA runs under eil76. (A) Algorithm iteration curve. (B) Vehicle route map for c1. (C) Vehicle route map for c2. (D) Vehicle route map for c3. (A) Algorithm iteration curve. (B) Vehicle route map for c1. (C) Vehicle route map for c2. (D) Vehicle route map for c3.

Results of ISSA, PSO, and SA runs under eil101. (A) Algorithm iteration curve. (B) Vehicle route map for c1. (C) Vehicle route map for c2. (D) Vehicle route map for c3.
In Figures 6 to 8, the blue dot is the location of the dispatch center and the red circle is the location of the community point. The results in Figures 6 to 8 and Table 3 show that ISSA has faster and more accurate convergence than PSO and SA on three different sizes of networks, Oliver30, eil76, and eil101. On Oliver30, ISSA improved by 1.14% and 4.52% compared to PSO and SA respectively, on eil76, ISSA improved by 5.08% and 2.51% compared to PSO and SA, respectively. And on eil101, ISSA improved by 3.86% and 2.55% compared to PSO and SA, respectively. ISSA has the fastest convergence speed on Oliver30 and eil101. While on eil76, although the convergence speed is not dominant, it can be seen that ISSA has a better global search ability in the later stages, and is able to go beyond the local optimum to find a better solution, which again supports the improvement in the global search ability of the introduced improvement strategy.
Results of specific runs with different test sets.
Data preparation
To verify the model and the algorithm established in this paper, Shanghai Pudong district is used as the background of real distribution tasks. Three hospitals are selected as emergency material transfer centers and 30 communities are collected as demand points. Among them, the fuzzy demands of the 30 community points are shown in Appendix (Table 2). The names and numbers of the three selected hospitals are shown in Table 4. The expected values of the various types of material demands after defuzzification used to generate the initialized distribution path are shown in Table 5. The distance matrices of the three hospitals and 30 communities collected are shown in Table 6. Finally, the parameters of different models of vehicles are shown in Table 7. Figure 9 shows a diagram of the real locations of the 30 community sites and the three dispatch centers selected.

Visualization of the location of 30 community points and 3 dispatch centers.
Name and number of the selected hospital.

Expected value of demand for various types of materials in 30 communities.

Distance matrix of the simulation experiment (km).

Parameters of different models of vehicles.

Simulation experiment
Since the demands of each community are fuzzy values that cannot be directly applied to the algorithm, the actual demand needs to be determined first. The upper and lower limits of the fuzzy demand of each community are randomly selected, using a random function, and rounded to be treated as the actual demand of each community, and the specific values are shown in Table 8.
Actual demands of the communities in the simulation experiment (t).

Simulation experiments are carried out based on the above relevant data. The values of the relevant parameters in the designed ISSA algorithm are shown in Table 9. The parameters in the optimized model distribution are taken as follows:

Iteration curves for PSO, SA, GA, SSA, and ISSA when

Iteration curves for PSO, SA, GA, SSA, and ISSA when

Iteration curves for PSO, SA, GA, SSA, and ISSA when
Iteration curves for PSO, SA, GA, SSA, and ISSA when

Scheduling results planning schematic.
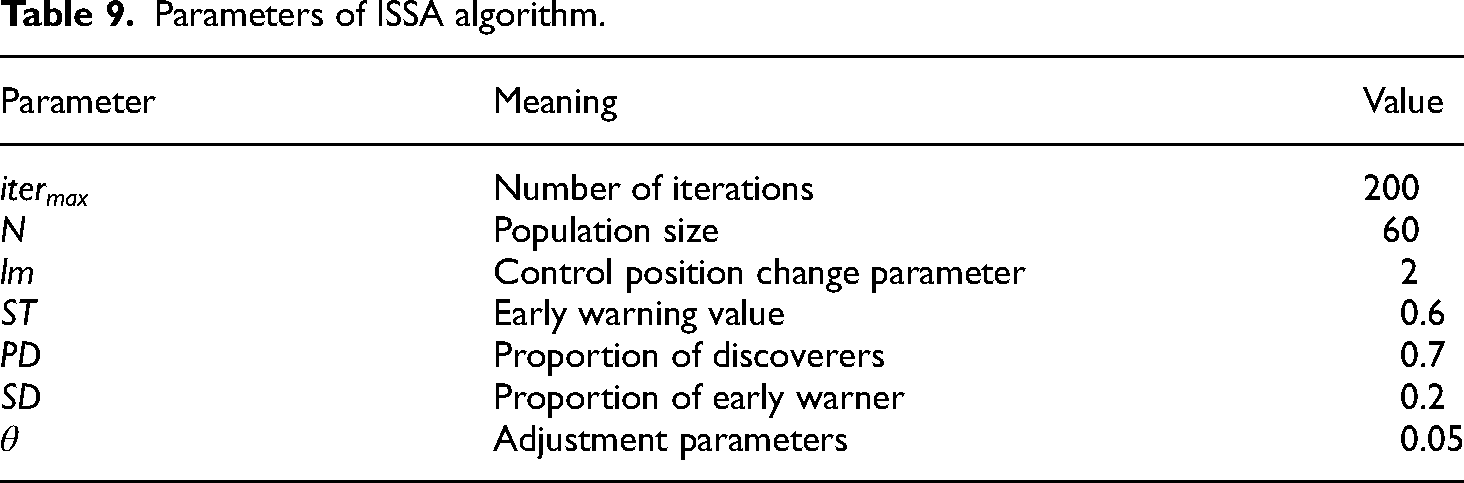
Parameters of ISSA algorithm.
Average results of the five algorithms PSO, SA, GA, SSA, and ISSA for different

Specific results for any one of the five algorithms PSO, SA, GA, SSA, ISSA when

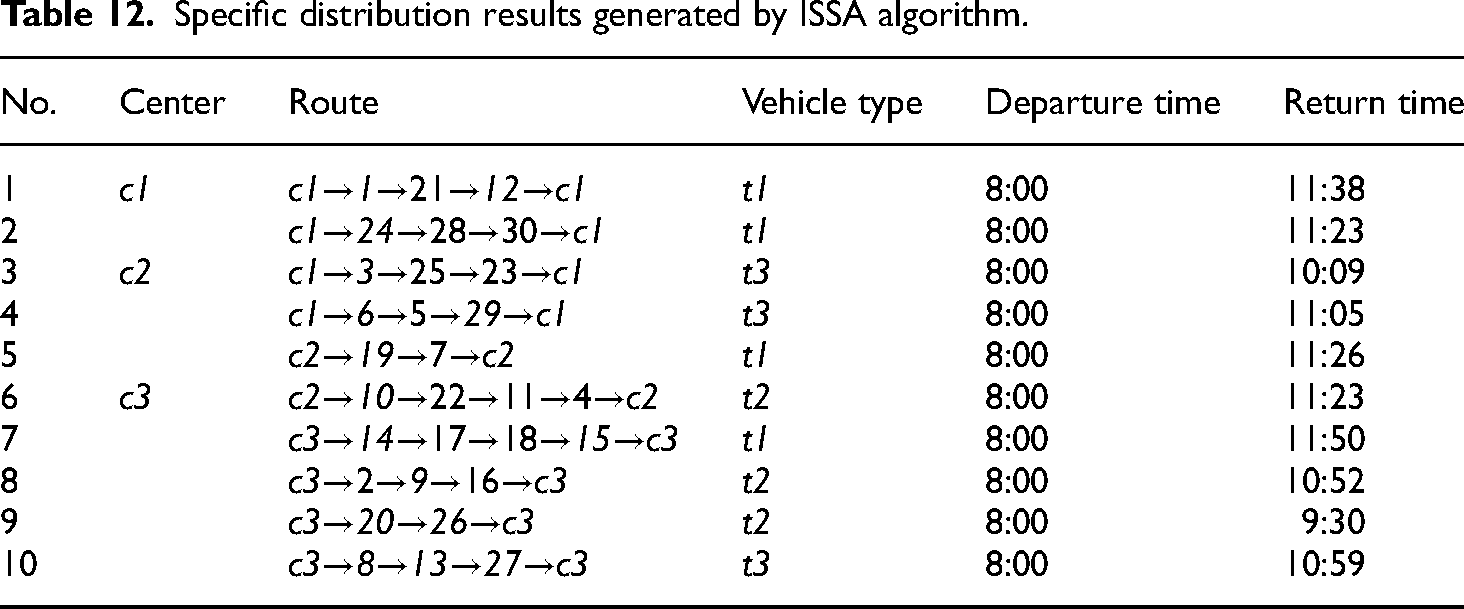
Specific distribution results generated by ISSA algorithm.
Confidence calculation results generated by ISSA algorithm.

Analysis of results
From Figures 10 to 13, together with Table 10, it can be seen that the designed ISSA algorithm is the best among the five algorithms for different weights, and as the weight λ decreases, the objective function value also gradually decreases, indicating that SC has a greater influence on the objective function than TC. As can be seen from Table 10, when λ = 0.9, the designed ISSA algorithm reduces the objective function value by 5.01%, 6.07%, 4.02%, and 5.64%, respectively, compared to PSO, GA, SA, and SSA algorithms, with an average reduction of 5.18%; when λ = 0.7, it reduces the objective function value by 3.92%, 9.20%, 6.46%, and 5.46%. When λ = 0.5, the reductions were 9.23%, 7.55%, 4.58%, and 6.38%, respectively, with an average reduction of 6.93%; when λ = 0.3, the reductions were 11.22%, 8.86%, 1.18%, and 5.90%, respectively, with an average reduction of 6.79%. This shows the robustness and optimization of the ISSA algorithm.
As ISSA has the best optimization capability when λ = 0.5, the results at this point were chosen for analysis. Combining the specific values in Table 11, it can be seen that:
- the distribution vehicle cost SC, generated by ISSA algorithm, is reduced by 7.47%, 7.07%, 3.04%, and 1.73%, respectively, compared to PSO, GA, SA, and SSA, with an average reduction of 4.83%;
- the distribution time cost TC, generated by ISSA algorithm, is reduced by 16.89%, 11.90%, 14.29%, and 12.13%, respectively, compared to PSO, GA, SA, and SSA, with an average reduction of 13.80%;
- the total distribution time, generated by ISSA algorithm, is reduced by 10.77%, 7.92%, 9.55%, and 8.64%, respectively, compared to PSO, GA, SA, and SSA, with an average reduction of 9.22%;
- the total distribution distance, generated by the ISSA algorithm, is reduced by 12.59%, 7.69%, 10.33%, and 4.11%, respectively, compared to PSO, GA, SA, and SSA, with an average reduction of 8.68%;
- the total distribution cost, generated by ISSA algorithm, is reduced by 8.90%, 6.33%, 5.21%, and 4.15%, respectively, compared to PSO, GA, SA, and SSA, with an average reduction of 6.15%.
In summary, the designed ISSA algorithm can be superior to the existing algorithms in terms of distribution vehicle cost SC, distribution time cost TC, total distribution time, and total distribution distance, and can effectively solve the urban emergency support material distribution optimization problem.
From the specific scheduling results in Table 12, transfer centers c1, c2, and c3 are responsible for 2, 3, and 5 distribution tasks, respectively, for a total of 10 distribution tasks. Among them, a maximum of four deliveries are affected per vehicles. As for the return time, the earliest return to the transfer center is 9:30, the latest return to the transfer center is 11:50, and the average time spent is about 3 h.
As can be seen from Table 13, 27 communities had a distribution confidence level of one for all three types of supplies, indicating that the needs of these communities were fully met. The remaining seven communities have seven distribution reliabilities above the preference value but not one, indicating that the distribution vehicles are allowed to distribute the material, but the demand for this type of material cannot be fully satisfied, and the overall material satisfaction rate is 96.67%. In summary, it can be seen that the ISSA algorithm, designed in this paper, benefits from the introduction of improved strategies such as the Cauchy variational operator and the opposition-based learning strategy, which can better reduce the overall total cost of distribution compared with the general algorithm and provide a boost to realize the efficient dispatching of emergency supplies.
Analysis of the model
In order to help distributors to develop reasonable decision-making distribution strategies, this paper analyzes the effects of preference value setting on the number of distribution vehicles, distribution time cost, and total cost. Based on the simulation experimental environment, only the ISSA algorithm delivers an optimized distribution where the preference values are taken from 0 to 1, and the average value is taken after 50 times optimization using ISSA algorithm at each preference value. The influence curves of preference values on the number of dispatched vehicles, time cost, and total cost are obtained as shown in Figures 15 to 17, respectively. In addition, the results of time cost and total cost per vehicle trip are shown in Table 14.

Effect of preference value on the number of vehicles.

Effect of preference value on time cost TC.

Effect of preference value on total cost.
Relationship between preference values and average cost.

From Figures 15 to 17, it can be seen that when the preference value is increasing, the values of the distribution vehicles, the time cost, and the total cost, in general, are also increasing. This is because, in order for distribution trucks to finish the distribution with the same demand at the community point, the requirements to do so grow more onerous as the value of preference increases. Therefore, more vehicles are needed for distribution, which leads to the increase of the total distribution time cost and the total cost. The time cost decreases when the value of
After discarding these outliers, Table 14 shows that the minimum average time cost is 187.357 when the value of
Conclusion
In this paper, we study the problem of distribution of urban emergency support materials under major public health emergencies. Considering the fuzzy demand in a such emergency case as the coronavirus epidemic, it is introduced into the distribution optimization model, and the distribution credibility is used to decide whether the distribution vehicle continues to make the distribution. Based on this event, a distribution optimization model, with a minimum total cost as the optimization objective, is constructed for urban emergency support supplies. Added to that, an ISSA, introducing the Cauchy variational operator, the opposition-based learning strategy and the adaptive strategy, is designed for solving the model. The comparison with existing cutting-edge algorithms shows that the improved strategies can make the algorithm more robust in solving complex high-latitude problems, can effectively enhance the ability of the algorithm to jump out of the local optimum and can improve the global search capability.
In addition, this paper analyzes the influence of preference values on urban emergency support material distribution and provides reasonable and effective decision-making strategies for taking actions. The urban emergency support material distribution optimization model, constructed in this paper, is effectively applied to the UESMDP, and the model can be further extended to urban cold chain distribution, medical material distribution, and other fields involving material vehicle distribution, providing effective research value and reference direction for the VRP problem. It is worth noting that the model developed in this paper is mainly used for emergency response under major public health emergencies such as the new coronavirus epidemic and it is idealized for road traffic conditions. In addition to SSA, other intelligent algorithms such as monarch butterfly optimization, 29 earthworm optimization algorithm, 30 elephant herding optimization, 31 moth search algorithm, 32 Slime mould algorithm, 33 hunger games search, 34 Runge Kutta optimizer, 35 colony predation algorithm, 36 and Harris hawks optimization 37 have been applied to complex optimization problems such as engineering optimization, resource allocation, and vehicle planning. Therefore, in future research, we will further explore the feasibility of other intelligent algorithms in solving emergency material dispatching problems involving fuzzy demands and the distribution task planning involving time-varying speed and complex traffic environment will also be further considered.
Footnotes
Acknowledgements
This work was supported in part by the Science and Technology Project of China Southern Power Grid Co., Ltd. (YNKJXM20220174).
Declaration of conflicting interests
The authors declared no potential conflicts of interest with respect to the research, authorship, and/or publication of this article.
Funding
The authors received no financial support for the research, authorship, and/or publication of this article.
Author biographies
Nan Pan is an associate professor. He received his PhD in mechanical engineering. His research interests include swarm intelligence and deep learning.
Xiao Ye is a master's degree candidate in Transportation. Her research interests include intelligent transportation.
Jianing Cao is a bachelor's degree candidate in mechanical engineering. His area of research is swarm intelligence and machine learning.
Jingcheng Zhang is a bachelor's degree candidate in data science and big data technology. His research interests include swarm intelligence, data mining, and in-depth learning.
Yuhang Han is a bachelor's degree candidate in mechanical engineering. His main research direction is swarm intelligence and deep learning.
Zhaolei He holds a bachelor's degree in engineering. His research area is electric energy metering, storage logistics, and intelligent sensing.
Appendix
Test function information and verification results.

| Test function | Result | |||||
|---|---|---|---|---|---|---|
| Symbols | Name | Range of values | Optimal solution | Algorithm | Mean value | Standard deviation |
| (30 latitude) | Schwefel's Problem 1.2 Function | 0 | PSO | 348.4255 | 214.249 | |
| GA | 2.030 × 10⁻⁹ | 6.419 × 10⁻⁹ | ||||
| SSA | 6.065 × 10−53 | 1.918 × 10−52 | ||||
| ISSA | 0 | 0 | ||||
| (30 latitude) | Six-Hump Camel-Back Function | −12569.5 | PSO | −1.0316 | 2.318 × 10⁻⁵ | |
| GA | −1.0316 | 6.6038 × 10⁻⁷ | ||||
| SSA | −1.0316 | 4.2168 × 10⁻⁸ | ||||
| ISSA | −1.0316 | 1.1253 × 10⁻⁸ | ||||
| (30 latitude) | Quartic Function | 0 | PSO | 0.052 | 0.028 | |
| GA | 1.843 × 10⁻³ | 1.234 | ||||
| SSA | 1.204 × 10⁻³ | 7.092 × 10⁻⁴ | ||||
| ISSA | 2.999 × 10⁻⁴ | 1.492 × 10⁻⁴ | ||||
| (7 latitude) | Shekel's Function | −10.536 | PSO | −10.027 | 0.933 | |
| GA | −8.904 | 2.998 | ||||
| SSA | −9.333 | 2.237 | ||||
| ISSA | −10.377 | 0.037 | ||||