
Abstract
Objective
The expansion of human activities in northern Colombia has increased human-snake encounters, particularly with venomous Porthidium lansbergii lansbergii. Given the limited knowledge of systemic envenomation effects and previous studies focusing only on early murine symptoms, this investigation aimed to describe the time-course physiopathology of P. lansbergii lansbergii envenomation following intramuscular injection in vivo.
Methods
Venom was inoculated in the gastrocnemius muscles of Swiss Webster mice, and blood, urine, and tissue samples were taken at different times to evaluate lethality and biochemical markers of renal function and oxidative stress.
Results
This study reports the first intramuscular LD50 for P. lansbergii lansbergii venom at 24.83 mg/Kg. Administering 80% of this LD50 induced early signs of renal injury, evidenced by urinary biomarkers over 24 h. The antioxidant activity was found at low levels in kidney tissue throughout the evaluated time post-envenomation. Malondialdehyde activity increased at the earliest point, while proinflammatory activity increased later. Urine metabolomics revealed elevated taurine and allantoin in the envenomed groups.
Discussion
Compensatory mechanisms in response to oxidative stress and tissue damage induced by the venom were evident in the envenomed mice over the evaluated time. However, histological analysis revealed evidence of pro-inflammatory processes occurring only at early times. Metabolomic analyses of urine samples identified taurine as a potential early biomarker of elevated oxidative stress and protein and creatinine levels.
Conclusions
P. lansbergii lansbergii venom induces alterations in murine renal tissue, affecting urinary biomarkers of kidney function within hours post-envenomation. Delayed proinflammatory effects may suggest an antioxidant imbalance in the envenomed mice, with unknown long-term effects. Further research on the role of oxidative stress and inflammation in renal structure and function following envenomation is necessary, emphasizing the need for prompt clinical management.
Keywords
Introduction
Colombia, ranking second in global biodiversity, exhibits a remarkable assemblage of over 760 reptilian species, of which approximately 40% are snakes.1–3
Some of them hold medicinal significance due to venom toxicity and the high frequency of accidental encounters, of which around 1% can result in death.4–6 Colombia's public health system database SIVIGILA (https://portalsivigila.ins.gov.co/) reported more than 4700 snakebite cases in 2021. Estimations suggest that around 5–9% of snakebite cases are associated with sequelae, which could be related to delays in access to health infrastructure.7–10 As time passes after a snakebite accident, there are more chances of death or permanent injury, affecting not only people's health and quality of life but also their economy, reducing the possibility of performing work that requires physical activities.
More than 90% of snakebite accidents in Colombia are related to snakes of the Viperidae family, and the clinical symptomatology includes local edema, myotoxicity, and hemorrhages, among others. 5 These clinical manifestations are similar between envenoming with snakes of genera Bothrops, Bothriechis, Bothrocophias, and Porthidium, leading to missing information about accidents at a species level since they are included as “bothropic envenoming”. 11 If there are delays in healthcare attention and antivenom administration, those affectations could lead to systemic failures, resulting in the detriment of organ function. Kidneys are particularly susceptible; some victims may need long-term treatments such as dialysis, and death could occur in the most severe cases associated with kidney failure. Although this scenario is pragmatic in daily clinical practice, it leads to a lack of knowledge of the specific symptoms that arise when a patient receives treatment, 6 particularly with snake species with scarce information about accident symptomatology, such as Porthidium lansbergii lansbergii. This species can be found in dry forests of the Caribbean region of Colombia, where there has been a growth in crops and livestock, increasing the possibility of snakebites in humans and domestic animals.8, 10, 12
The P. lansbergii lansbergii snake venom is highly abundant in metalloproteinases (SVMPs), phospholipases A2 (PLA2s) type Asp49, and disintegrins (DIS) and, after a snakebite accident, develops typical “bothropic” symptoms in mice models such as moderate myonecrosis, considerable local bleeding, and significant thrombocytopenic effect. 13 Jiménez-Charris et al. 14 determined that P. lansbergii lansbergii envenoming in mice generated brain micro-hemorrhage in the sensorimotor cortex with substantial loss of neurons. The impact at the brain level led to a lack of locomotor apparatus and deficits in stimuli-conscious experiences. Besides, they found bleeding in the pleural, liver, and kidney capsules after 7 h of envenoming by intraperitoneal injection.
However, little is known about the time-course physiopathology of experimental envenoming by P. lansbergii lansbergii snake venom after intramuscular injection. In that sense, this investigation aimed to describe the kidneys’ envenoming effects by P. lansbergii lansbergii, evaluating blood and urine molecular markers and kidney tissue samples of envenomed mice at different time points. This information will be helpful in snakebite management in Colombia to prevent the onset of mid and long-term complications.
Methods
Venom
Venom was obtained from six adult P. lansbergii lansbergii specimens from the Caribbean region of Colombia. Snakes were released after the collection of venom samples. Venoms were centrifuged to remove debris, dried in a vacuum centrifuge, and stored at −20°C. A pool with equal quantities of each venom was made for the mice injection. A license for wild species collection for non-commercial scientific research purposes was granted by Autoridad Nacional de Licencias Ambientales - ANLA, Resolution N° 1070, August 28–2015, and the contract for access to genetic resources and their derivative products No. 307, 2021 was approved by the Ministerio de Ambiente y Desarrollo Sostenible from Colombia.
Mice
Assays were conducted in female Mus musculus Swiss Webster mice of 23–25 g body weight and 6–8 weeks of age (experimental units). Animals were obtained from the “Biotério Setorial do Departamento de Fisiologia e Farmacologia da Faculdade de Medicina da Universidade Federal do Ceará.” and were kept in polypropylene cages, with controlled humidity, circulating air, temperature at 22 ± 0.5°C, dairy cycles of 12 h daylight/dark, and provided food and water ad libitum. Efforts were made to minimize the number of animals utilized and to decrease suffering. All procedures followed the ‘Guide for the Care and Use of Laboratory Animals, 8th Edition, 15 and comply with the CONCEA (“Conselho Nacional de Controle de Experimentação com Animal”) review board regulations. The CEUA (“Comité de Ética no Uso de Animais”) Committee of the Universidade Federal do Ceará granted ethics approval under the protocol number 4728160418: “Avaliação da fisiopatologia do envenenamento experimental por Porthidium lansbergii lansbergii em camundongos Swiss,” and the reporting of this study was made according to ARRIVE 2.0 guidelines. 16
Intramuscular venom lethality
The venom's lethal potency was tested by intramuscular injection of 50 μL of venom doses ranging from 10 to 40 mg/Kg dissolved in phosphate-buffered saline, PBS (0.12 M NaCl, 0.04 M sodium phosphate buffer, pH 7.2). We chose a higher range dose than the intraperitoneal DL50 reported by De arco-Rodríguez et al., 2019, 12 since we expected a lower absorption and dissemination of the toxins. Venom doses were evaluated using a serial increasing factor 0.7 to cover the mortality range (0%–100%). Following previous reports on the lethality of P. lansbergii lansbergii venom and the 3R principle, a total sample size of ten mice per group was used, with the individuals randomly allocated into groups and individual cage locations. The injections were administrated at muscle gastrocnemius, and deaths were registered after 48 h, and probits calculated the median lethal dose (LD50). 17
Biomarkers of renal function
The envenoming effects of P. lansbergii lansbergii snake venom were analyzed using molecular biomarkers evaluated in mice plasma and urine samples taken from experimentally envenomed mice. Following previous statements about sample size, five groups of eight mice were treated with 50 μL of P. lansbergii lansbergii venom at 80% of the calculated intramuscular LD50 by injection at muscle gastrocnemius, and samples were collected at different times: 6 h, 12 h, 24 h, 72 h, and 96 h. For each envenomed group, there was a control group of six mice inoculated through the same route with 50 μL of NaCl 0.9% (placebo), and respective samples were also collected simultaneously, totalizing ten experimental groups.
Mice were kept in isolated metabolic cages with food and water ad libitum and continuously observed for pain signs such as decreased activity, piloerection, ungroomed appearance, abnormal posture, and changes in respiration. Animals were adapted to metabolic cages 48 h before experiments started to diminish the stress effects. Furthermore, animal weights were registered before and after experiments, and food and water were removed 24 h before euthanasia to avoid interference with the collection of the urine samples.
For euthanasia, the Neves et al. 18 protocol was followed, which suggests the use of an intraperitoneal injection of ketamine (90 mg/Kg) and xylazine (7.5 mg/Kg) and death verification by a professional in veterinary medicine. After euthanasia, blood samples were obtained by heart puncture with a sterile syringe, rinsed with heparin, and centrifuged at 2500 g for 10 min at 4°C. 18 The supernatant containing plasma was obtained and stored at −80°C until used to determine plasma biomarkers of renal function.
Urine collection was conducted using individual metabolic cages. For most groups, urine was collected on ice over the 24 h preceding euthanasia. However, for the 6-h and 12-h groups, urine samples were collected at their respective time points (6 h and 12 h after envenomation). Then, urine samples were centrifuged at 2500 g for 10 min at 4°C to remove debris and obtain supernatant, stored at −80°C until used to quantify biochemical biomarkers and metabolomic analyses. On the other hand, tissue samples from kidneys were obtained after euthanasia and kept at −80°C for the oxidative profile determination and histological analysis with hematoxylin and eosin staining.
Renal function assessment was conducted using commercial assay kits to measure specific biomarkers. Creatinine levels in plasma and urine were quantified using the “Creatinine K” kit from Biosystems® (Spain), while urea concentrations were determined with the “Urea CE” kit from Labtest® (Brazil). Additionally, proteinuria was evaluated using the SensiProt kit, and uric acid levels in urine were measured using the Uric Acid Liquiform kit from Labtest® (Brazil). These assays were performed according to the manufacturer's protocols. Some blood or urine samples did not have enough volume to be processed and were therefore excluded from some analyses. Creatinine clearance (CrCl) was calculated using plasma creatinine as described by Shahbaz et al.
19
and following the equation reported by Yamabe et al.
20
using the values obtained with the determination of urine creatinine (UCr), plasma creatinine (PCr), the total urine volume in 24 h (V) (except for the 6- and 12-h time-points, which were collected in their respective times), and the mice body weights (W), using the following equation:

Metabolomic analysis by NMR spectroscopy
Urine samples of envenomed and control mice were obtained at different times (6, 12, 24, 72, and 96 h) and were used to carry out metabolomic analysis by NMR spectroscopy. The NMR experiments were performed on a Bruker DRX 500 (11.7 T; 499.6 MHz) spectrometer with a 5 mm inverse detection probe and an actively shielded z-gradient at 298 K. The 1H NMR spectra were acquired using the noesypr1d pulse sequence (Bruker library) for non-deuterated water suppression, spectral data with 128 transients and 64 K of time domain points for a spectral window of 20 ppm, 3.2 of acquisition time and recycling delay of 12.0 s under controlled temperature to 298 K. The spectral processing was performed by exponential Lorentzian broadening of 0.3 Hz and zero filling to 16 K points before the Fourier transformation. The phase correction was performed manually, and the automatic baseline correction was applied over the entire spectral range. The spectra were referenced to chemical shift δ 0.0 from the TMSP-d4 simple signal.
The components were identified through two-dimensional (2D) NMR experiments using the standard spectrometer library pulse sequences. The 1H-1H gCOSY experiments were obtained with a spectral width of 9615.4 Hz in both dimensions, 1442 × 200 data matrix, 36 scans per t1 increment, and a relaxation delay of 1.0 s. The 1H-13C gHSQC experiments were acquired with an evolution delay of 3.425 ms (transfer delay) for a coupling constant 1J (C, H) of 146 Hz; 1442 × 200 data matrix; 80 scans per t1 increment; spectral widths of 9615.4 Hz in f2 and 30,154.5 Hz in f1, and relaxation delay of 1.0 s. The 1H-13C gHMBC experiments were recorded with an evolution delay of 62.5 ms for coupling constant LRJ (C, H) of 8 Hz; 1442 × 200 data matrix; 180 scans per t1 increment; spectral widths of 9615.4 Hz in f2 and 36,182.7 Hz in f1, and a relaxation delay of 1.0 s. The spectral range between the chemical shifts δ 0.5 and 9.5 was selected for chemometric analysis, resulting in a numerical matrix with dimensionalities of 586,980 data points (45 spectra × 13,044 variables in each spectrum). The region influenced by the non-deuterated water suppression (δ 5.0 to 4.6) was excluded from the analysis. Each spectrum was converted to American Standard Code for Information Interchange (ASCII) files for matrix construction and imported by the Origin™ 9.4 program.
The four resultant matrices were exported for the supervised chemometric method by Partial Least Squares - Discriminant Analysis (PLS-DA) using the software PLS Toolbox (version 8.6.2 – Eigenvector Research Inc., Manson, WA, USA). Algorithms for baseline correction, variable alignment using a COW (correlation optimized warping) with a segment of 50 data points and a slack of 5 data points, and normalization were applied over the variables. 21 The sample data were mean-centered, and the Simplified PLS (SIMPLS) algorithm was used to decompose each data matrix in scores, loadings, and the merit graphs (errors, classification capacity, and clustering influence). 22 The compounds described in the loading plot were identified through usual bidimensional NMR correlations (1H-1H gCOSY, 1H-13C gHSQC, 1H-13C gHMBC), comparison with the open access database HMDB: https://hmdb.ca/, 23 and literature reports.24–26
Histological analysis
The kidneys were obtained after 6, 12, 24, 72, and 96 h of injection (NaCl 0.9% as negative control and 80% of venom LD50). Then, the samples were cross-sectioned and stored in histological cassettes immersed in 10% buffered formalin for 48 h. After this time, the tissues were stored in 70% alcohol for fixation and processing following the procedure described by Khalil et al. 27 The examination of samples was conducted in an Automatic Tissue Processor Lupe® PT09 (Lupetec, Brazil), followed by dehydration in increasing concentrations from 70 to 100% of ethyl alcohol. This material was then included in paraffin, using the Histological Bath Model BH05 (Lupetec, Brazil). When the tissues were already in paraffin blocks, they were sectioned into 5μm thick sections using an impact microtome (Wetzlar, Germany) equipped with a 16 cm tungsten knife, type D (Wetzlar, Germany). Then, the sections were placed on histological slides and stained with hematoxylin-eosin for subsequent microscopic analysis. The images were captured using a DM2000 Leica Microscope and a DFC295 Leica Camera Carl Zeiss AxioCam HRc Camera (Wetzlar, Germany).
The histopathology analysis was realized by the assignment of quantitative and qualitative scores according to the following parameters: blood vessel congestion, presence of inflammatory cells, signs of interstitial edema, evidence of tubular necrosis, tubular hyaline casts and tubular dilation, brush edge loss, and signs of epithelial necrosis. The quantitative scoring system was: - (negative) = no injury; 1 = mild injuries; 2 = moderate injuries; 3 = intense injuries. The mean and standard deviation values were calculated using five randomly selected samples, and differences at * p < 0.05 were reported after the Mann-Whitney test. The quantitative scoring system was also classified by qualitative scores in the same samples: - (negative) = no injury; + = mild injuries; ++ = moderate injuries; +++ = intense injuries.
Oxidative and inflammatory profiles analysis in kidney tissue
The content of reduced glutathione (GSH) was assessed in kidney tissue samples using the DNTB (5–5′-dithio-bis- (2-nitrobenzoic acid)) method, as reported by Sedlak and Lindsay. 28 Briefly, tissue homogenates were prepared in an ice-cold 20 mM EDTA solution. Then, 40 µL of each homogenized sample was added to 50 µL of distilled water and 10 µL of 50% trichloroacetic acid (TCA), followed by centrifugation at 3000 g for 10 min. Finally, 60 μL of the supernatants were added to the DTNB solution in Tris buffer 0.2 M pH 8.2. The standard curve was created by obtaining the absorbance readings of increasing concentrations of standard GSH (1.56 to 100 μg) at 412 nm, and the results were expressed in mg GSH/g of tissue.
Oxidative stress damage was investigated by the degree of lipoperoxidation in renal tissue through the measurement of concentration of malondialdehyde (MDA), following the method of the thiobarbituric acid reactive substances (TBARS), according to Ohkawa et al. (1979). 29 Briefly, 10% of kidney homogenate was added to 1% phosphoric acid and 0.6% thiobarbituric acid solution and kept in a boiling bath (95–100°C) for 45 min. Then, the mixture was cooled at room temperature for 20 min before adding n-butanol, vortex, and centrifugation at 1200 rpm for 15 min. After centrifugation, the organic phase was collected, and the absorbance was read at 535 nm using the spectrophotometer Synergy H1® (BioTek, Winooski, VT, USA). MDA concentrations were expressed in nmol per milligram of tissue.29, 30
On the other hand, the myeloperoxidase (MPO) activity was used to indicate inflammatory processes in the renal tissue. The assessment followed the o-dianisidine method on tissue homogenates (TissueLyser LT Adapter, Qiagen®, Germany) containing 10 μL of 0,5% hexa-trimethylammonium-bromide solution (HTAB) per mg of tissue. Samples were centrifuged at 3000 g for 7 min at 4°C to remove cellular content, and 10 μL of supernatant was added to 96-well plates. Finally, 200 μL of o-dianisidine reagent was added to each well, and absorbances were obtained at 450 nm every minute for 5 min in a Synergy ELISA reader (Biotek®, USA).
Statistical analysis
The biochemical markers and oxidative stress values were compared between the control and venom groups each time using unpaired, two-tailed, t-student tests, where differences were considered significant at p < 0.05 (*), p < 0.01 (**), and p < 0.001 (***). Welch's correction was computed when variances were not equal between groups. Single dot plots and error bars represented the mean values and standard deviations.
For the quantitative histopathology parameters, the mean and standard deviation values were calculated using five randomly selected samples as a percentage concerning a completely injured tissue (100%), with a score of 3 = intense injuries. The normality of the data was assessed by the Kolmogorov-Smirnov test, and significant differences were reported after Mann-Whitney tests of pairwise comparisons of control and venom groups at the same sample collection time. The probability value of p < 0.05 was considered statistically significant. The software GraphPad Prism® v. 9.0 was used for statistical analysis and figure construction.
Results
Intramuscular venom lethality
The lethal potency of the venom was determined after 48 h of intramuscular injection of Swiss Webster mice. The median lethal dose (LD50) was calculated by the probits method, resulting in 24.8 mg/Kg (IC 95%: 21.8–28.3 mg/Kg).
Biochemical markers in plasma and urine
Creatinine levels were significantly higher in plasma at 6 and 12 h after inoculation with P. lansbergii lansbergii venom (Figure 1(a)). Meanwhile, it was considerably higher in urine after 12, 24, and 72 h (Figure 1(b)). On the other hand, creatinine clearance was significantly lower in envenomed mice only at 6 and 12 h (Figure 1(c)).

Creatinine levels in plasma (a) and urine (b) of Swiss mice inoculated via i.m with 80%. of LD50 P. lansbergii lansbergii venom or saline solution as control. Mice were euthanized after 6, 12, 24, 72, and 96 h. Urine samples were obtained from the metabolic cages and maintained in ice during the last 24 h before euthanasia, except for the 6 and 12-h groups in which urine was collected right before euthanasia at the corresponding time. Creatinine clearance (c) was calculated as indicated in the methods. The mean values and standard deviations were represented by single dot plots and error bars of n = 8 in venom groups and n = 6 in control groups. Comparisons between control and venom groups at each time point were performed using unpaired, two-tailed, t-student tests, where differences were considered significant at * p < 0.05, ** p < 0.01, and *** p < 0.001. Welch's correction was computed when variances were not equal between groups.
Furthermore, protein levels in the venom group were significantly higher in urine at every time point after 12 h of injection (Figure 2(a)), while urea and uric acid were significantly higher in plasma and urine, respectively, only at 6 and 12 h (Figure 2(b) and 2(c)).
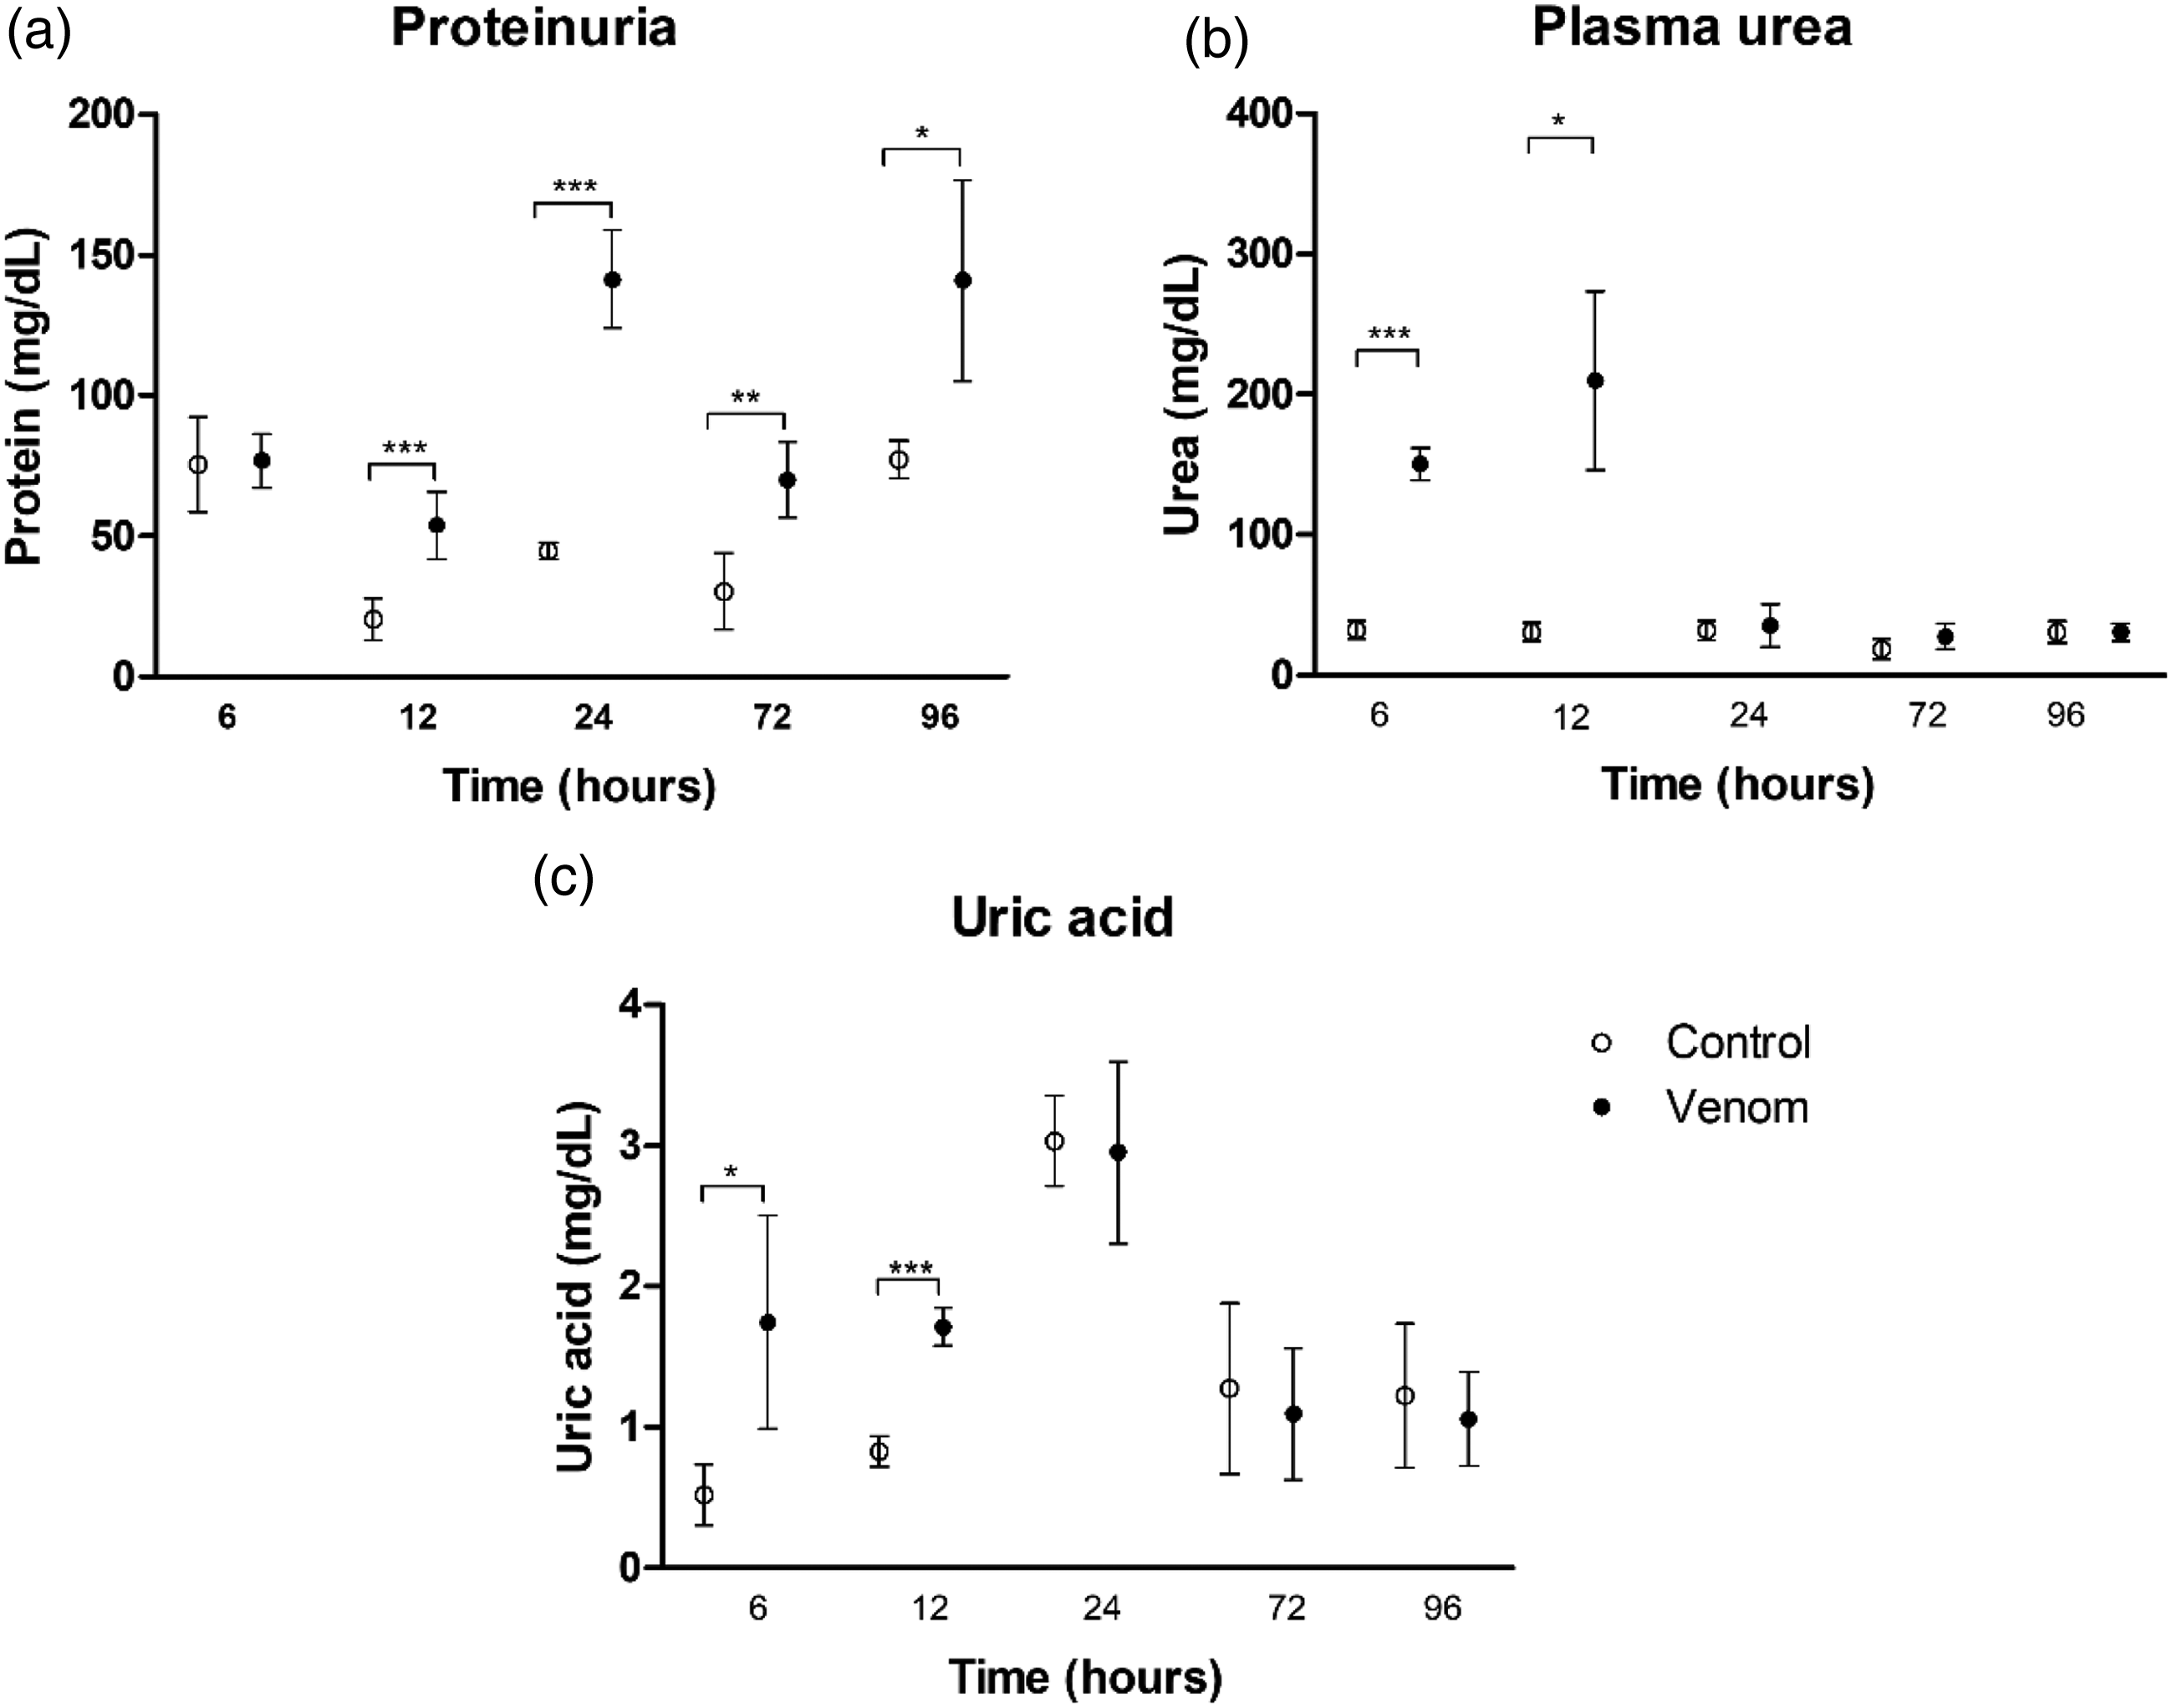
Protein levels in urine (a), urea levels in plasma (b), and uric acid levels in urine (c) of Swiss mice inoculated via i.m. with 80% of LD50 P. lansbergii lansbergii venom or saline solution as control. Urine samples were obtained from the metabolic cages and maintained in ice during the last 24 h before euthanasia, except for the 6 and 12-h groups in which urine was collected right before euthanasia at the corresponding time. Blood samples were obtained by heart puncture with a sterile syringe rinsed with heparin. Blood was centrifuged at 2500 g for 10 min at 4°C, and plasma was removed and stored at −80°C until used for analysis. The mean values and standard deviations were represented by single dot plots and error bars of n = 8 in venom and n = 6 in control groups. Comparisons between control and venom groups at each time point were performed using unpaired, two-tailed, t-student tests, where differences were considered significant at * p < 0.05, ** p < 0.01, and *** p < 0.001. Welch's correction was computed when variances were not equal between groups.
Metabolomic profiling and variability assessment
The volumes obtained from some urine samples were insufficient for metabolomic analyses. Thus, out of fourteen, only five samples were included for the 6 h groups (three from the mice treated with saline and two from the mice treated with venom), eight samples were included for the 12 h groups (four from each treatment), ten samples were included for the 24 h groups (five from each treatment), ten samples were included for the 72 h groups (five from each treatment), and twelve samples were included for the 96 h groups (six from each treatment).
Due to the high experimental variability expected from the different periods of venom injection, supervised chemometric methods by Partial Least Squares - Discriminant Analysis (PLS-DA) were developed according to the inoculation time (after 6, 12, 24, 72, and 96 h). Therefore, five multivariate classification analyses were developed, considering each period of inoculation separately. Figure 3 shows one-dimensional scores graphs from the latent variable 1 (LV1) axis (samples × LV1) with venom effect in red and control samples (under no venom effect) illustrated in blue color after 6 h (Figure 3(a)), 12 h (Figure 3(b)), 24 h (Figure 3(c)), 72 h (Figure 3(d)) and 96 h (Figure 3(e)).
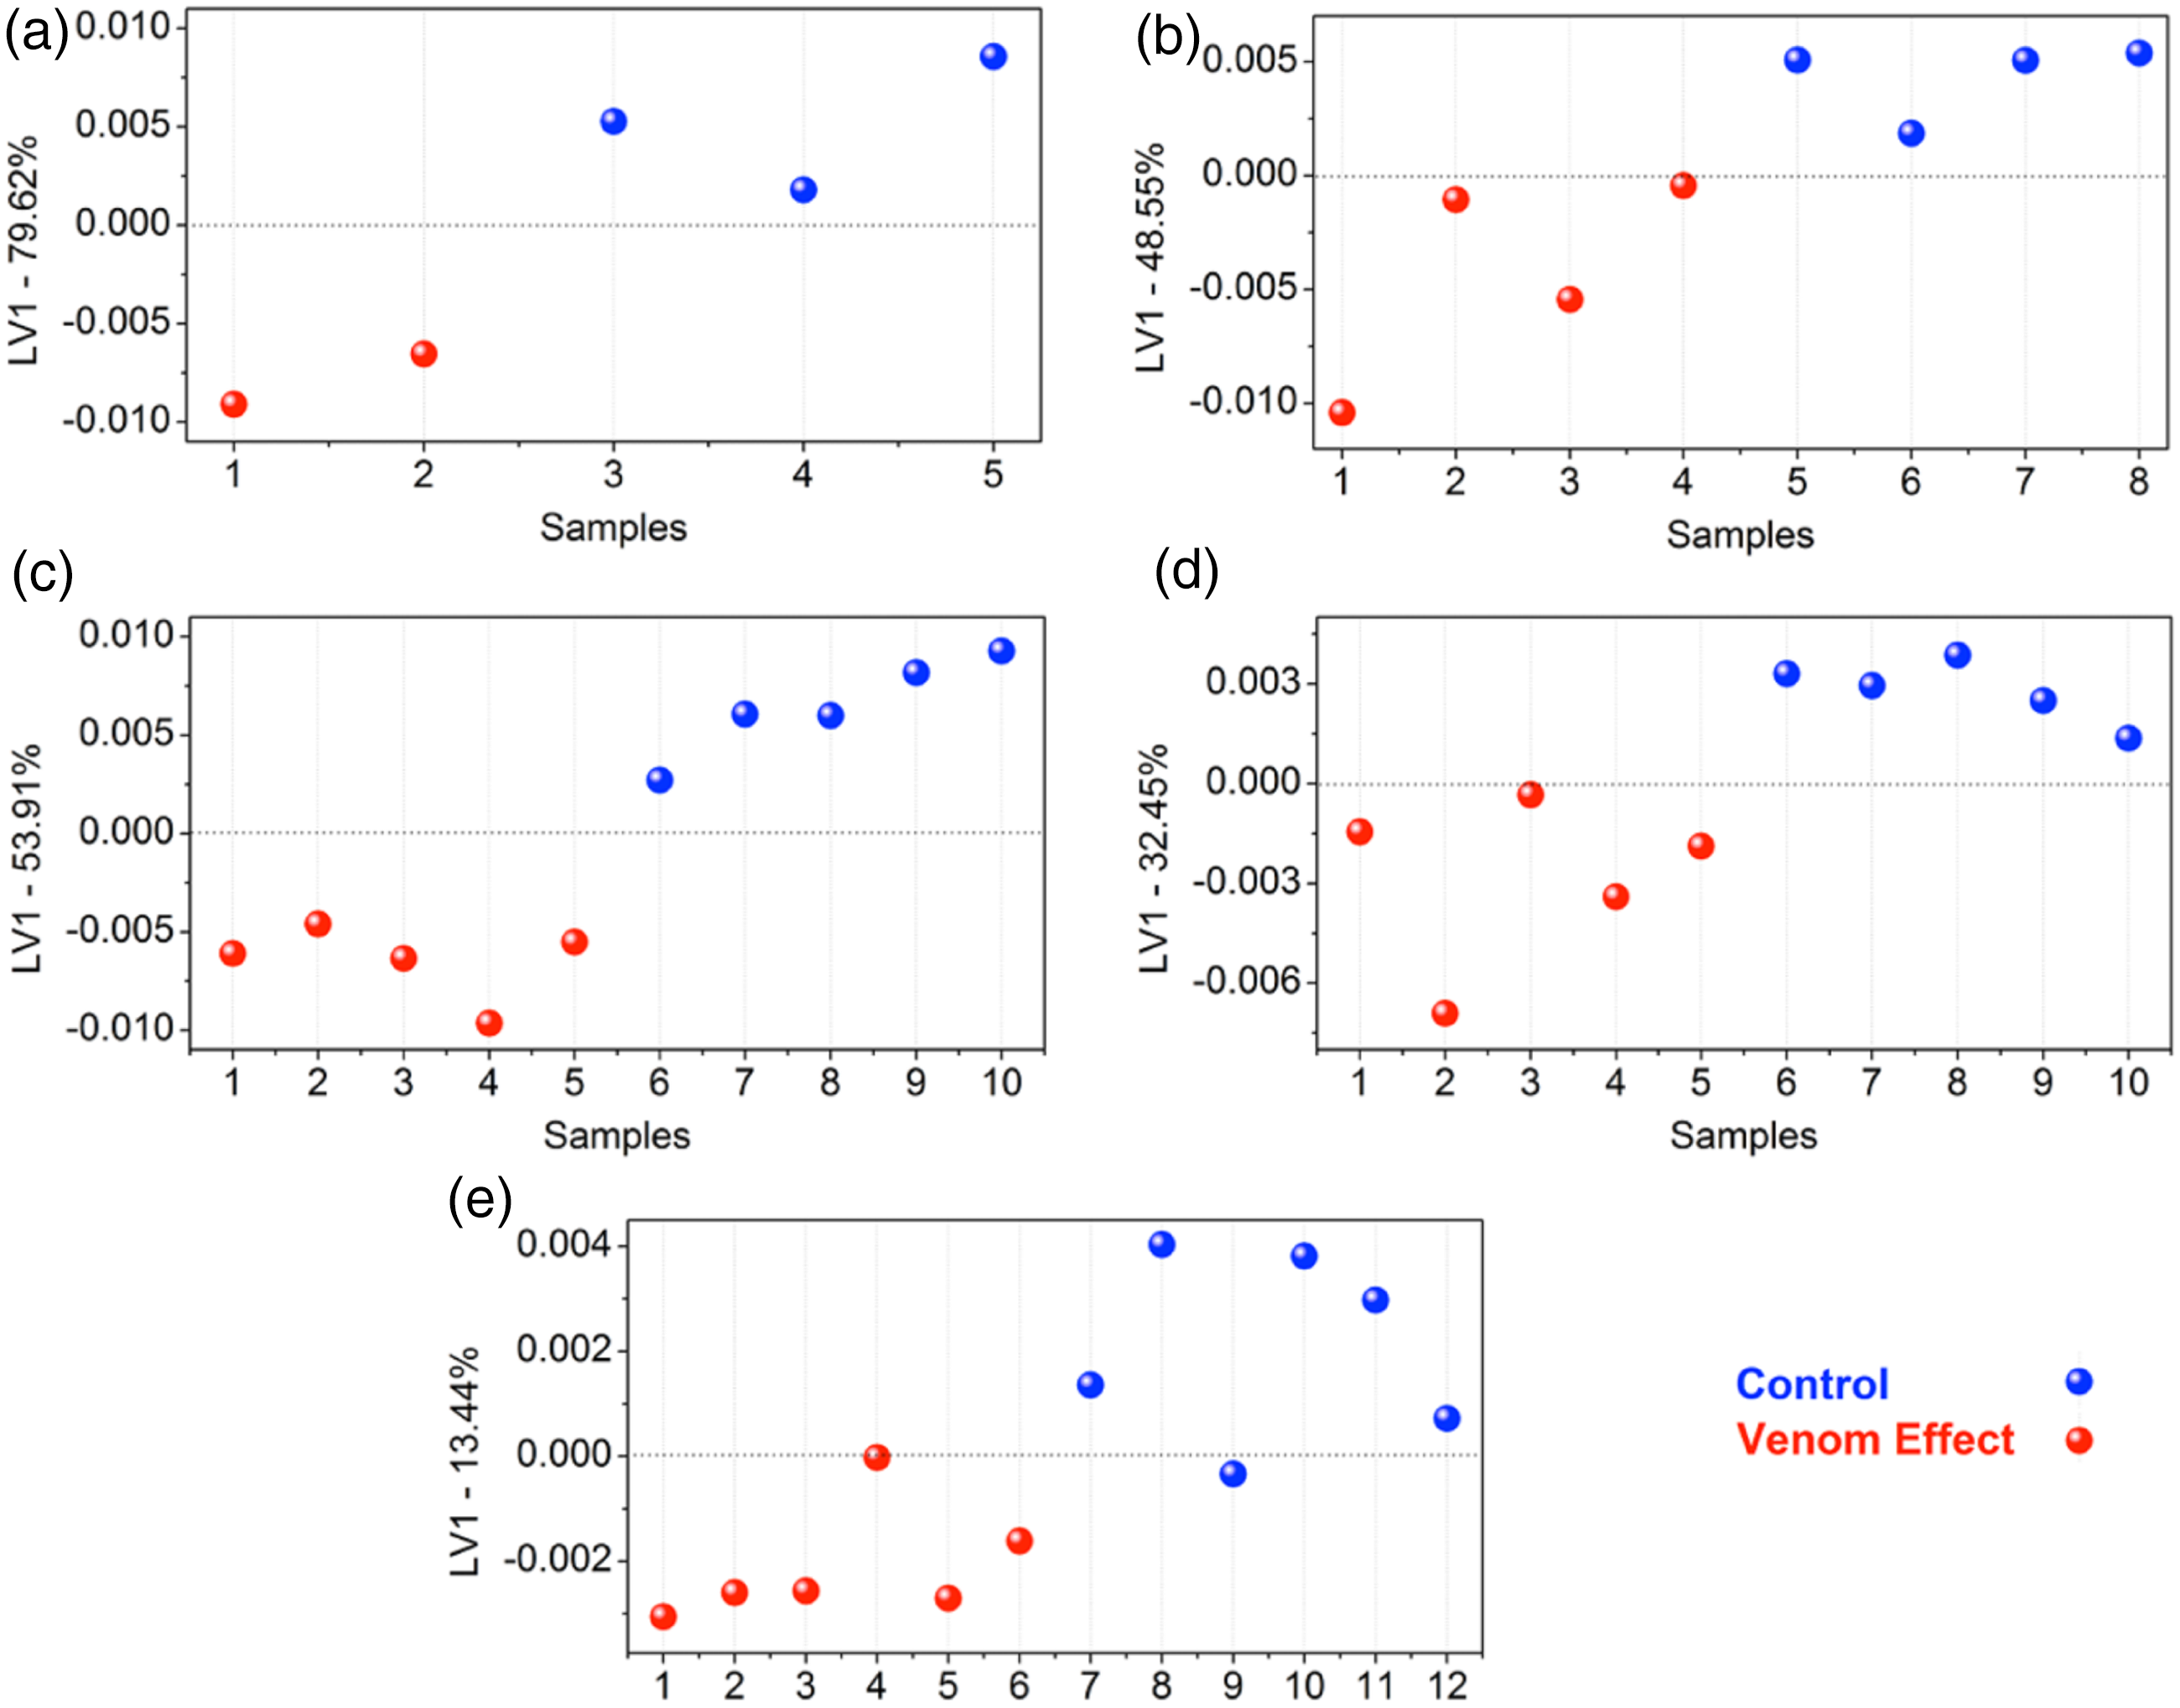
Graphical comparison of LV1 scores between urine samples from i.m. injected mice with 80% of LD50 P. lansbergii lansbergii envenoming (Venom Effect, red dots) and control group (Control, blue dots) at different time points: 6 h (a), 12 h (b), 24 h (c), 72 h (d), and 96 h (e). Urine samples were obtained from the metabolic cages and maintained in ice during the last 24 h before euthanasia, except for the 6 and 12-h groups in which urine was collected right before euthanasia at the corresponding time.
Later, the number of LV for each modeling was chosen following captured variance on LV, root mean square error of calibration (RMSEC), and cross-validation (RMSECV), as well as sensitivity, sensibility, and Matthews Correlation Coefficient (MCC). Thus, Figure 4 presents the respective LV1 loadings plotted in lines.

LV1 loadings plotted in lines showing the analytes that were differentially identified between the groups, with the control group as a reference. Relevant loadings refer to the first LV based on each stage of the experiment after 6 h (a), 12 h (b), 24 h (c), 72 h (d), and 96 h (e). The number of LV for each modeling was chosen by captured variance on LV, root mean square error of calibration (RMSEC), and cross-validation (RMSECV), as well as sensitivity, sensibility, and Matthews Correlation Coefficient (MCC).
The binary classification modeling presented the opposite compound behavior between urine from venom-injected mice and control mice. Initially, the venom effect influenced the increase of taurine, creatine, creatinine, and allantoin from 6 to 24 h. On the other hand, amounts of urea, citric, acetic, and lactic acids decreased under venom effect in the same period after injection. Later, the quantity of creatine, creatinine, allantoin, and citric acid increased after 72 h, and taurine decreased. Finally, after 96 h, only allantoin increased with the venom effect.
Histological analysis
Quantitative and qualitative analyses of tissue samples from the kidneys of envenomed mice revealed mild to moderate injuries only at early time points (from 6 to 12 h) compared to control samples. Figure 5 shows representative images of the histological findings at these times, including brush edge loss of the cells, tubular dilation, and interstitial edema. Images of the samples taken at other times were not included since no differences were observed between treatments (Table 1).

Histological analysis of kidney tissue stained with hematoxylin-eosin. Control samples were obtained from mice injected with NaCl 0.9% after 6 and 12 h (A and C, respectively). Samples of envenomed mice with P. lansbergii lansbergii venom were also obtained after 6 and 12 h (B and D, respectively). The images were captured using a DM2000 Leica Microscope coupled with a DFC295 Leica Camera Carl Zeiss AxioCam HRc Camera (Wetzlar, Germany) at 200X, and scale bars were included at 100 µm. Black arrows indicate renal congestion, yellow arrow shows inflammatory cells and green arrows indicate tubular dilatation.
Quantitative and qualitative kidney histopathology analysis of control and envenomed mice after 6, 12, 24, 72, and 96 h. The quantitative scoring system was: - (negative) = no injury; 1 = mild injuries; 2 = moderate injuries; 3 = intense injuries. The mean and standard deviation values were calculated using five randomly selected samples, and differences at * p < 0.05 were reported after the Mann-Whitney test. The quantitative scoring system was also classified by qualitative scores in the same samples: - (negative) = no injury; += mild injuries; ++ = moderate injuries; +++ = intense injuries.

Oxidative and inflammatory profiles analysis
The antioxidant activity (GSH concentrations) was found at low levels in kidney tissue throughout the evaluated time after envenoming compared to the control group (Figure 6(a)). Oxidative stress suggested by the malondialdehyde (MDA) method (Figure 6(b)) was only significantly higher at the earliest time point (6 h) after envenomation. Meanwhile, the proinflammatory activity (MPO) was substantially higher in the envenomed groups only at the later time points (72 and 96 h, Figure 6(c)).

Oxidative and inflammatory profiles of kidney tissue samples after injected mice with P. lansbergii lansbergii venom (n = 8) or saline solution (control, n = 6). (a) Reduced glutathione (GSH) levels were assessed using the DNTB (5-5′-dithio-bis- (2-nitrobenzoic acid)) method, as described inthe methodology. Absorbances were obtained at 412 nm in a Synergy H1 ELISA reader (Biotek®, Winooski, VT, USA), and its concentration was expressed as mg of GSH/g of tissue. (b) Oxidative stress was investigated by the degree of lipoperoxidation by measuring malondialdehyde (MDA) concentration, following the thiobarbituric acid reactive substances (TBARS) method. The absorbance was read at 535 nm using the spectrophotometer Synergy H1® (BioTek, Winooski, VT, USA). MDA concentrations were expressed in nanomoles per milligram of tissue (nmol/mg tissue). (c) Myeloperoxidase enzyme activity (MPO) was measured by the o-dianisidine method and expressed in units of myeloperoxidase enzyme per mg of kidney tissue. Absorbances were obtained at 450 nm for 5 min in a Synergy H1 ELISA reader (Biotek®, USA). The mean values and standard deviations were represented by single dot plots and error bars of n = 8 in venom and n = 6 in control groups. Comparisons between control and venom groups at each time point were performed using unpaired, two-tailed, t-student tests, where differences were considered significant at * p < 0.05, ** p < 0.01, and *** p < 0.001. Welch's correction was computed when variances were not equal between groups.
Discussion
The description of clinical symptomatology is essential for understanding the severity of snakebite envenoming and, thus, for the decision-making process regarding the best treatment approach. However, no published articles were found involving histopathological changes in an in vivo model of acute kidney injury (AKI) caused by Porthidium lansbergii lansbergii venom. Thus, more investigation is needed regarding accidents with these snakes in Colombia. Moreover, clinical information about the systemic effects of envenoming by this species in organs such as kidneys is scarce. Jiménez-Charris et al. 14 reported the morphological changes in mice kidneys and elevation of serum creatinine after 7 h of envenomation with P. lansbergii lansbergii snake venom using an intraperitoneal injection. Nevertheless, intraperitoneal access is not typical for venom in snakebite accidents, and the effects on biochemical markers and tissues days after envenoming remain unclear. Accordingly, this study analyzed the effects of envenomation trying to simulate one of the most frequent routes of venom access after a snakebite in people by performing intramuscular (i.m.) injections in the gastrocnemius muscles of Swiss Webster mice and taking blood, urine, and tissue samples at different time points up to 4 days.
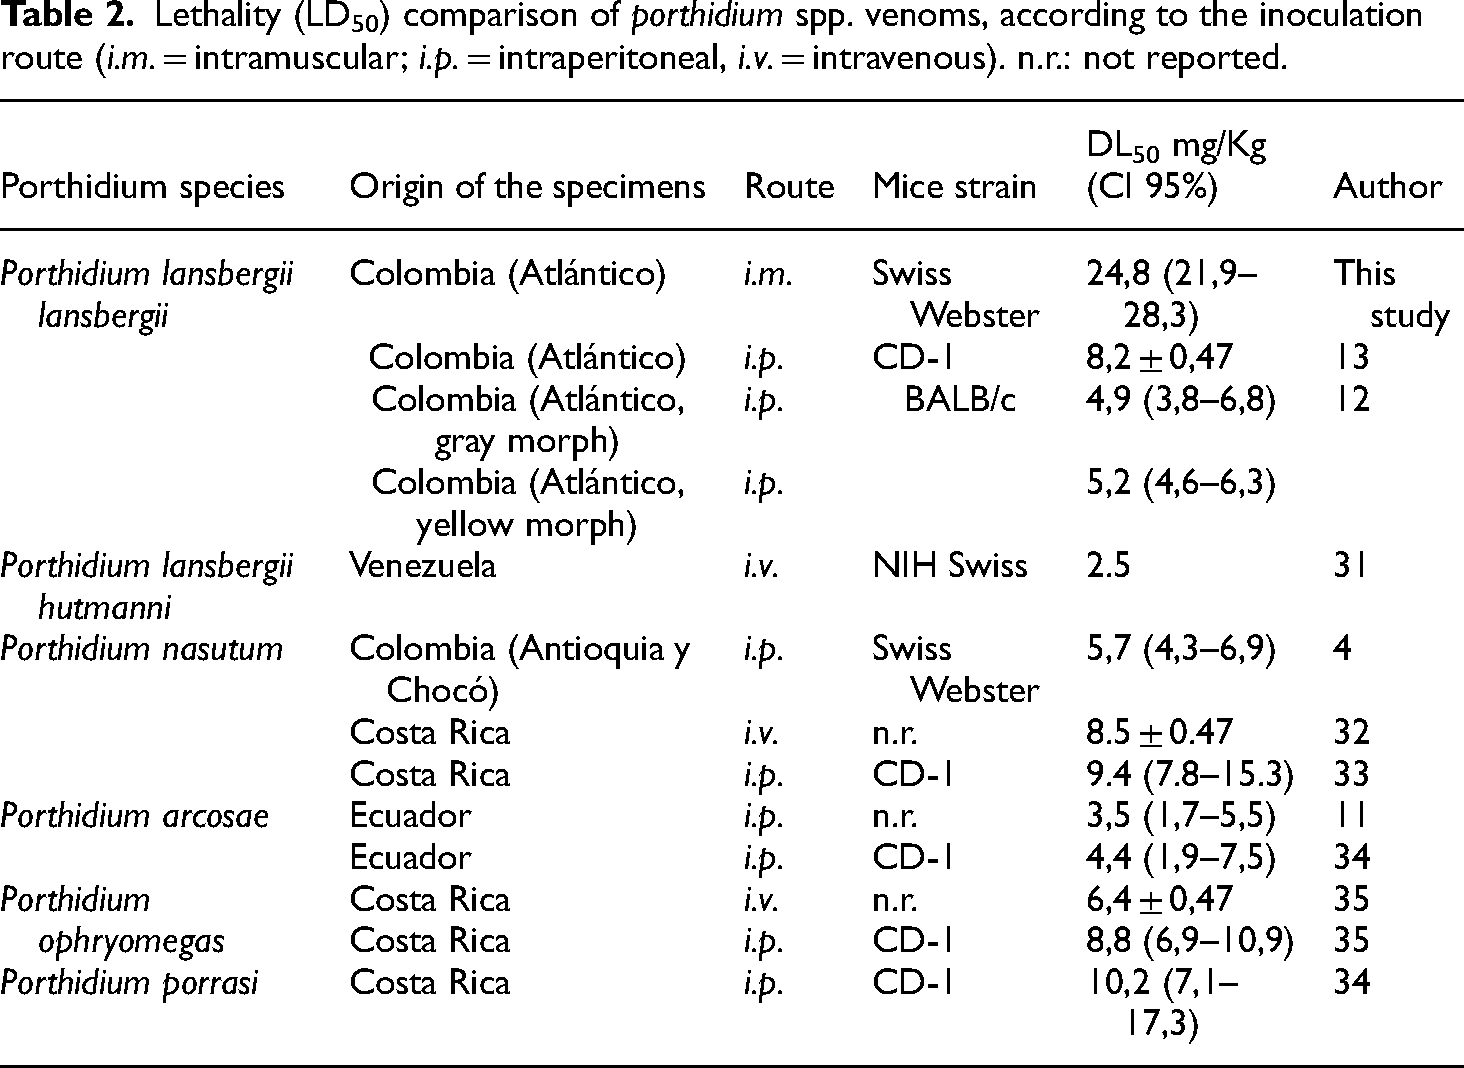
As expected, the calculated i.m. LD50 was much higher than those obtained with venom from similar snake species using other administration routes (Table 2) since the i.m. route is characterized by late body absorption and dissemination of toxins. 35 Interestingly, the lethality varied according to the administration routes and depending on the mouse strain used for its determination. This observation may be associated with differential responses of each strain's immunological systems and intrinsic variability in the susceptibility to intoxication.
Lethality (LD50) comparison of porthidium spp. venoms, according to the inoculation route (i.m. = intramuscular; i.p. = intraperitoneal, i.v. = intravenous). n.r.: not reported.
During the monitoring of envenomed mice, signs of pain and reduced mobility of the inoculated extremity were observed. Jiménez-Charris et al. 14 previously described these observations, where envenomed mice had “less healthy behaviors,” indicative of discomfort and clinical deterioration, probably caused by a hypodynamic condition due to multiple internal bleedings. These symptoms are typical of “bothropic envenoming” and are associated with the high presence of toxins such as metalloproteases and phospholipases A2 in the venom.6, 13 However, these observations do not reveal the severity of damages that may be happening to the internal organs or systems. An additional noteworthy finding related to the challenge encountered in obtaining blood samples via cardiac puncture in several attempts and subsequent dissections post-euthanasia showed severe internal bleeding. These findings are in concordance with previous characterizations of P. lansbergii lansbergii venom as highly hemorrhagic and to induce mice deaths by hypovolemic shock.13, 14
Biochemical markers analysis revealed early elevated creatinine, urea, and uric acid levels in the envenomed mice's plasma and low creatinine clearance. Multiple pathologic mechanisms share these patterns that could, if they persist, affect the tissue structure, leading to kidney injury.19, 36 In fact, damages to the renal cellular structure were found in the histological analyses at early times that may compromise the tubular or glomerular functions. 37 These results have been reported in in vivo experiments using whole venoms from other snakes of the Viperidae family, observed even a few hours post-envenomation, and have been related to the characteristic clinical manifestations of AKI,38, 39 also observed in most patients that suffered bites by Viperidae snakes. 40 Interestingly, urine biomarkers such as protein and creatinine persisted differentially elevated in the envenomed groups for a longer time than the biomarkers evaluated in plasma. This could be related to clearance mechanisms, suggesting that some venom components, such as metalloproteinases and phospholipases A2, which are significant components of P. lansbergii lansbergii venom, 13 have greater impacts on renal tissues as their effects persist in the renal system longer than in the circulatory system. 39 These findings could have implications for diagnostics, assessment, and monitoring of kidney injury, as renal damage is a common significant and lasting consequence of snake envenomation. For example, urine biomarkers might serve as more sensitive and long-lasting indicators of envenomation and its effects than plasma markers, which are especially valuable in cases where the time since the event is unknown or treatment is delayed. Monitoring these biomarkers could also guide the timing and duration of antivenom administration in clinical settings.41, 42
Reduced glutathione (GSH) is a water-soluble tripeptide (gamma-L-glutamyl-L-cysteinyl-glycine) that acts directly or indirectly in many critical biological processes such as the synthesis of proteins, metabolism, and cellular protection against toxic that causes oxidative stress.37, 43, 44 The reduction of levels of GSH in envenomed mice could be indicative of substances as part of the compensatory mechanisms that activate against envenomed mice can be associated with GSH. might be operational within the hemodynamic system aimed at restoring homeostasis; however, despite these mechanisms, injuries to the renal system may persist and could be detected in urine. GSH In envenomed mice, the reduction in the levels of GSH activity consistently decreased across all observed time intervals, suggesting that these compensatory mechanisms may be at work counteracting the elevated discharge of oxidizing agents resulting from venom-induced damage. The elevated malondialdehyde (MDA) levels detected only 6 h after envenomation supports this hypothesis. This molecule is a lipid peroxidation product in a highly oxidative stress environment. It indicates peroxidative tissue injury 30 since free radicals damage biological membranes, leading to the oxidation of polyunsaturated fatty acids present in these structures, mainly arachidonic acid. 45 Previous reports with venoms from Bothrops insularis have also reported early elevated MDA values in mice's kidney tissues as indicative of AKI. 46 Studies using an isolated kidney perfusion model under the effect of venom from snakes of the genus Bothrops and Bothropoides described results compatible with those presented in this study, demonstrating that only 90 min after venom application, oxidative stress was already leading to the synthesis of MDA.
Similarly, De Ornellas Strapazzon et al. 47 reported increased MDA levels in the plasma of patients after envenomation by B. jararaca and B. jararacussu at different time points. These data reaffirm that the MDA levels analysis is a reliable marker of oxidative damage suitable for monitoring a “bothropic envenoming” 48 and evaluating AKI in diverse models.43–49 To date, this is the first report on determining MDA levels in mice kidneys caused by the P. lansbergii lansbergii venom.
Together with the significant increase in MDA levels at early times, edema, tubular affections, and brush border edge loss in renal tissue samples were also noted in the histological analysis at 6 and 12 h after envenomation. These observations have been reported previously in biomodels of diabetic nephropathy, 50 or after expositions to toxic substances such as pesticides, 51 or snake venoms,42, 52, 53 and have been related to increasing levels of urea and creatinine in plasma. Gay et al. 53 described extensive vacuolization of epithelial cells, congestion, edema, desquamation, and necrosis accompanied by proteolytic degradation of type IV collagen after Bothrops alternatus envenomation. Dantas et al. 46 reported severe tubular damage, azotemia, increased MDA, and reduced renal GSH after B. insularis envenomation. The venom of P. lansbergii lansbergii acts comparably, in which tubular structures degeneration with vacuolization, loss of tubular architecture, and accumulation of luminal eosinophilic material were also observed.
In contrast, the myeloperoxidase (MPO) activity was significantly higher at 72 and 96 h. This enzyme is highly expressed in neutrophils, releasing it to the extracellular environment in the presence of pro-inflammatory stimuli.54, 55 These results suggest that inflammatory responses may exceed the compensatory mechanisms for oxidative stress at work at early hours (i.e. GSH), leading to a homeostasis imbalance at later hours. Antioxidant mechanisms likely function as a systemic response aimed at sustaining reduced oxidative stress levels from the damage caused by the venom as a systemic attempt to maintain lower levels of oxidative stress. 56 In studies with human patients or in vivo models of AKI after snakebites, low circulating levels of GSH have been associated with renal failure.46, 57 Since the biomarkers in the urine persisted longer than those in the blood, the metabolomic analyses of urines allowed the identification of additional molecules elevated in the envenomed mice samples. Our results showed that taurine may represent an interesting early biomarker that could complement traditional ones such as creatine or creatinine. In mammal models of AKI, this amino acid has been associated with a protective role after nephrotoxicity.58–60 Similarly to our results, increased taurine levels were found after mice septic induction. 61 In contrast, allantoin, an end-stage degradation product of purine catabolism, was detected at later hours. This molecule is produced via the peroxidation of uric acid and protein degradation that could be associated with decreased renal function.62, 63 Finally, regarding the histological analyses, Fuentes-Delgado et al. 50 also observed vascular dilation and brush border edge loss 2–4 weeks after treatment. At the same time, edema and MDA appeared at high levels only in the 7th week. Interestingly, a progressive recovery of renal structure was observed in the 8th week.
The limitations of this study are related to the high heterogeneity of the biomarker values obtained from the animal models despite maintaining stable conditions during the experiments. It is also important to note that a sub-lethal dose was used to accomplish the survival of the animals during the time of the experiments, and this may explain why no significant differences were found between groups in some of the evaluated parameters. Accordingly, more investigations will be needed to elucidate the mid-to-long-term effects of envenomation on renal structure and function and disclose damages that could become permanent and increase the risk of suffering chronic renal affections, and how this affects the daily life of people after a snakebite in Colombia.
Conclusion
The results of this study demonstrate that Porthidium lansbergii lansbergii envenoming generates acute renal alterations in murine biomodels related to histological damage and increases in markers of kidney damage and filtering capacity, mainly at early times (6–12 h). Proteinuria, creatinine, and taurine in urine are potential biomarkers for monitoring early injuries to renal tissue after a snakebite envenoming. Allantoin in urine may contribute to follow-ups at later hours. The information obtained in this study will provide an essential reference for understanding the alterations in kidney function due to P. lansbergii lansbergii envenoming in Colombia. Interestingly, the parameters evaluated in the biomodels showed that compensatory mechanisms might counteract some venom-induced damage. Still, the extent of the partial or total tissue recovery remains to be investigated.
Footnotes
Acknowledgements
We thank Thiago M. de Freitas and Francisco Cleber S. Ferreira for their technical assistance with determining the biochemical markers. We are also grateful to Universidade Federal do Ceará for providing all the infrastructure for experimental development.
Author contributions
All authors participated in the study design, data interpretation, and manuscript review. Leonel Montealegre-Sánchez, Mikael A. Lima, Alejandro Montoya-Gómez, Luis Solano-Redondo, Alexandre Havt, and Eliécer Jiménez-Charris were mainly responsible for resources and participated in the conceptualization and project administration. Leonel Montealegre-Sánchez, Mikael A. Lima, and Dayara O. Silva were responsible for manipulating biomodels, sample collection, and data generation and were aware of the group allocation at the different stages of the experiments. Karuza. M. Alves Pereira and Mario R. L. Mota prepared the tissue samples for staining and histological analysis. Edilberto Rocha Silveira, Nilce V. G. P. S. Brasil, and Elenilson. G. Alves Filho performed metabolomic analysis from the urine samples. All authors have seen and approved the paper's final version and agreed to its submission for publication.
ARRIVE Statement and ethics approval
The manuscript does not contain clinical studies or patient data. All procedures involving animals were carried out following the ARRIVE guidelines and complied with the regulations of the CONCEA (“Conselho Nacional de Controle de Experimentação com Animal”) review board. The CEUA (“Comité de Ética no Uso de Animais”) Committee of the Universidade Federal do Ceará granted ethics approval under the protocol number 4728160418: “Avaliação da fisiopatologia do envenenamento experimental por Porthidium lansbergii lansbergii em camundongos Swiss.”
Data availability statement
The authors declare that the data supporting this study's findings are available within the paper. Should any raw data files be needed in another format, they are available from the corresponding author upon reasonable request.
Declaration of conflicting interests
The authors declared no potential conflicts of interest with respect to the research, authorship, and/or publication of this article.
Funding
This study was approved and supported in September 2016 by the “Conselho Nacional de Desenvolvimento Científico e Tecnológico (CNPq, Fortaleza, Brazil)”, grant number 306760/2016-9. Part of this work was funded by a grant received by L. Montealegre-Sanchez from “Departamento Administrativo de Ciencia, Tecnología e Innovación” (Minciencias Colombia), grant number 647-2015.