
Abstract
A crucial stage in eukaryote gene expression involves mRNA splicing by a protein assembly known as the spliceosome. This step significantly contributes to generating and properly operating the ultimate gene product. Since non-coding introns disrupt eukaryotic genes, splicing entails the elimination of introns and joining exons to create a functional mRNA molecule. Nevertheless, accurately finding splice sequence sites using various molecular biology techniques and other biological approaches is complex and time-consuming. This paper presents a precise and reliable computer-aided diagnosis (CAD) technique for the rapid and correct identification of splice site sequences. The proposed deep learning-based framework uses long short-term memory (LSTM) to extract distinct patterns from RNA sequences, enabling rapid and accurate point mutation sequence mapping. The proposed network employs one-hot encodings to find sequential patterns that effectively identify splicing sites. A thorough ablation study of traditional machine learning, one-dimensional convolutional neural networks (1D-CNNs), and recurrent neural networks (RNNs) models was conducted. The proposed LSTM network outperformed existing state-of-the-art approaches, improving accuracy by 3% and 2% for the acceptor and donor sites datasets.
Introduction
Over the last 10 years, the field of genome sequencing has seen remarkable progress, enhancing our comprehension of gene functionality and genetic discrepancies. A pivotal aspect in broadening the coding potential of genes and promoting protein variety is gene splicing. In a standard splicing procedure, precursor messenger RNA (pre-mRNA) initially generated from a gene undergoes conversion to mature mRNA, leading to protein production. Genetic substances found in the nuclei of eukaryotic life forms, whether single or multi-celled, consist of exonic and intronic sequences. These are often termed coding and non-coding segments in the genomic sequence, respectively. The existence of introns that recurrently interrupt exon sequences has led to eukaryotic genes often being labeled as interrupted genes. The splicing site, situated between exons and introns, holds sequences that the spliceosome finds, as demonstrated in Figure 1. The spliceosome, a combination of small nuclear RNA and assorted proteins, conducts splicing. This complex adheres to a unique splice site sandwiched between the downstream or upstream areas of two successive introns and exons. The upstream region earns the title of the donor site (5′ splice site), and the downstream area is named as the acceptor site (3′ splice site). The categorization of donor and acceptor sites follows the GT-AG guidelines. Moreover, five small nuclear RNAs (U1, U2, U4, U5, and U6) mingle with more than 300 proteins, giving rise to a macromolecular spliceosome complex enzyme.1–3

A visual depiction of RNA splicing, illustrating the removal of introns from exons by snRNP and the subsequent joining of exons to create translatable mRNA. 4
Finding specific patterns or regions, pinpointing splicing sites, or splice junction locations is a complex issue in bioinformatics. Analyzing these genomic sequences is complicated due to their inherent diversity, complexity, and uncertainty.2, 5 Several machine learning and traditional feature matching-based solutions have been proposed in the literature to address these challenges, which are discussed in detail in section “Literature review.” However, traditional methods rely on heuristic rules based on sequence patterns. Furthermore, the splicing process is complex, involving multiple factors, such as transcription factors, RNA-binding proteins, and epigenetic modifications, that can affect splicing site selection; therefore, machine learning-based algorithms such as Naïve Bayes, KNN, and SVM
6
may not be able to capture this complexity. In this paper, an attempt is being made to address the identification of splicing sites using a deep learning-based framework with the following main contributions:
Standard methodology for splice site prediction was followed and aimed to develop a computational method for correct identification. The first step towards achieving precise detection involves data cleansing. The Cluster Database at High Identity with Tolerance (CD-HIT) technique is used to conduct this process, effectively removing sequence redundancies. Additionally, a one-hot encoding strategy was implemented before feeding the data into the deep learning model, allowing the model to find patterns in numerical data efficiently. A significant limitation of single features in genomic sequences is the presence of over a thousand nucleotides in a sequence, and using a small number of nucleotide compositions does not yield satisfactory results. To address this, an LSTM network is proposed that can effectively learn sequential patterns in the genomic sequence for precise classification. To evaluate the efficacy of various models for RNA sequence analysis, a comprehensive ablation study that included traditional machine learning approaches such as K-nearest neighbor (KNN), support vector machine (SVM), as well as convolutional neural networks (1D-CNNs) and recurrent neural networks (RNNs) models. Various experiments show that the proposed LSTM network surpasses state-of-the-art techniques by a significant margin in terms of accuracy, sensitivity, specificity, precision, and MCC scores.
As we continue to explore the frontiers of artificial intelligence, its integration into genomic research heralds a transformative era. The convergence of AI with genomics is enhancing our ability to decipher complex biological data and paving the way for more personalized and precise medical interventions. In this vein, our research represents a step towards harnessing the power of AI to unravel the intricacies of gene splicing, a critical process in understanding genetic functions and disorders. Looking forward, the evolution of AI in genomics promises advancements in predictive genetics, therapeutic target identification, and the development of novel diagnostic tools, thereby revolutionizing our approach to healthcare and disease management.
The rest of the paper is structured as follows: next section covers materials and methods, while section “Proposed methodology” discusses the evaluation criteria used to measure performance. Section “Experimental evaluation” presents the results and discussion, and section “Conclusion” concludes the paper.
Literature review
Bioinformatics is complex, including the discernment of specific patterns or locations—particularly identifying splicing or splice junction sites. This intricacy is further amplified when dealing with genomic sequences, as these sequences exhibit inherent complexity, a broad diversity, and an element of uncertainty.2,5 Given the constant flux and evolving nature of genomic sequences, these challenges add complexity to the already challenging task of their analysis. The bioinformatics research community has consistently advocated for developing computationally efficient strategies in response to these challenges. These strategies serve not only to mitigate the challenges posed by genomic sequences but also to supply efficient and practical solutions to the most pressing problems in the field. For instance, Xu et al. 4 proposed developing a novel model for splicing site identification. While revolutionary in its approach, this model uses the physical–chemical properties of PseDNC to deliver promising outcomes that are far superior to previous models. The literature on this topic reveals a scarcity of artificial neural network (CNN)-based approaches. While these methods are undeniably effective, their implementation is often hindered because these techniques are computationally intensive. This drawback, therefore, limits the potential scalability of these methods, thereby reducing their overall effectiveness in addressing the challenges posed by genomic sequences. Kishore et al. 7 presented a deep neural network model for accurate splice junction prediction, demonstrating its ability to precisely predict cryptic splicing caused by noncoding genetic variants, showcasing the potential of such advanced methods in overcoming the field's challenges.
Iqbal and Hayat 1 sought to address this gap by introducing a hybrid feature model known as iSS-hyb-mRmR. This model ingeniously amalgamates pseudo-trinucleotide and pseudo-tetra nucleotide feature approaches, creating a unique and effective blend of techniques. They then employed the minimum redundancy and maximum relevance (mRmR) technique, a well-known method for feature selection. The selected features were then classified via the KNN algorithm, a machine-learning method renowned for its effectiveness in pattern recognition. Similarly, Chen et al. 8 introduced the iSS-PseudoDNC model. This model was designed with a particular emphasis on efficiency and accuracy, resulting in impressive accuracies of 87.73% and 85.45% for acceptor and donor sites, respectively. Meanwhile, Han et al. 9 expanded the breadth of the field by designing a hybrid model utilizing two feature extraction methods, namely the position weight matrix (PWM) and the increment of diversity (ID). These features were meticulously processed through an SVM classifier to produce the hybrid model results, thereby showing the effectiveness of combining different methods. In RNA splicing site prediction, Hua and Sun 10 proposed a two-layered model utilizing an SVM. This model shows the potential of SVM methods in dealing with complex bioinformatics problems. Complementing this, Ogura et al. 11 put forward the back propagation neural network (BPNN) for RNA sequence prediction, offering another avenue for exploration. Lumini and Nanni 12 took a different approach, successfully determining splicing sites using an SVM classifier. Pertea et al. 13 introduced the GenSplicer model, a versatile tool applied to two species: Arabidopsis thaliana and human DNA samples. Demonstrating the utility of feature extraction methods, Burge and Karlin 14 employed a Maximal Dependence Decomposition (MDD) method, subsequently using a decision tree for classification. The efficacy of this approach was further improved by integrating it with the Markov model, as demonstrated by Salzberg et al. 15 Adding to the expanding portfolio of SVM applications, Zhang et al. 16 leveraged SVM to generate sequence information for the splicing of primary human mRNA, with their primary objective being the prediction of splice sites.
Biochemical experimental procedures have historically played a critical role in splice site identification (SSI). While providing invaluable insights, these procedures must be improved to avoid unreliability, inflated costs, and time consumption. Complete reliance on these techniques is inadvisable. Incorporating different computational methods into an automated technique could offer a more efficient and effective means of splicing site detection. However, the development of such techniques is still a daunting challenge. Many methods for splice site identification have been developed, many of which have shown noteworthy results. However, while promising, these methods still need further enhancements to boost their predictive efficiency. Bioinformatics is a landscape ripe for innovation and discovery, with each breakthrough bringing us closer to overcoming its complex challenges.
Proposed methodology
This section comprehensively describes the proposed methodology for splice site identification. The method consists of several key steps, from preprocessing genome sequencing data into a one-hot representation. Subsequently, three distinct classification techniques are employed. The first technique uses a 1D Convolutional Neural Network (CNN), while the second utilizes a vanilla Recurrent Neural Network (RNN) network. A novel Long Short-Term Memory (LSTM) architecture is introduced explicitly for accurate splice site identification. For a visual representation of these techniques, refer to Figures 2–4, which outline the overall frameworks.
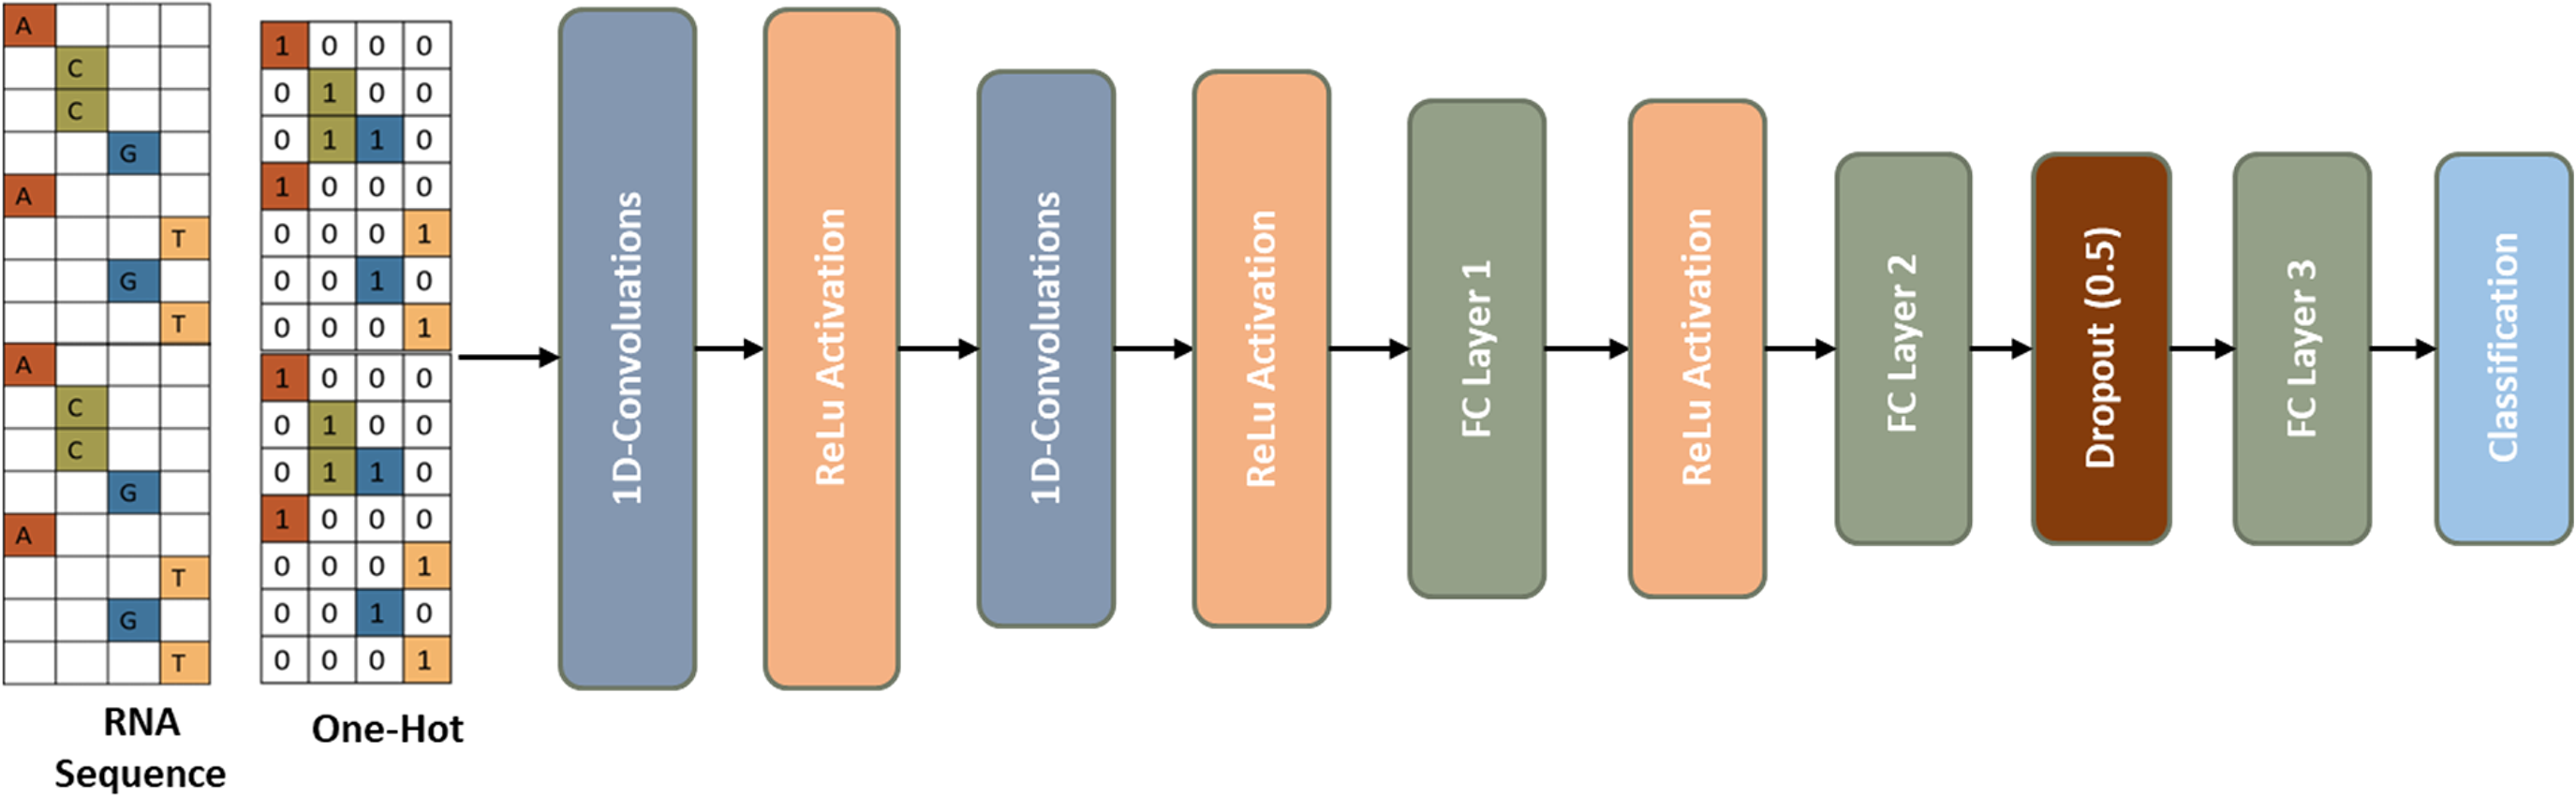
An illustrative view of the proposed 1D-CNN network explicitly designed for the task of splice site identification.

A graphical depiction of the proposed framework for the task of splice site identification.
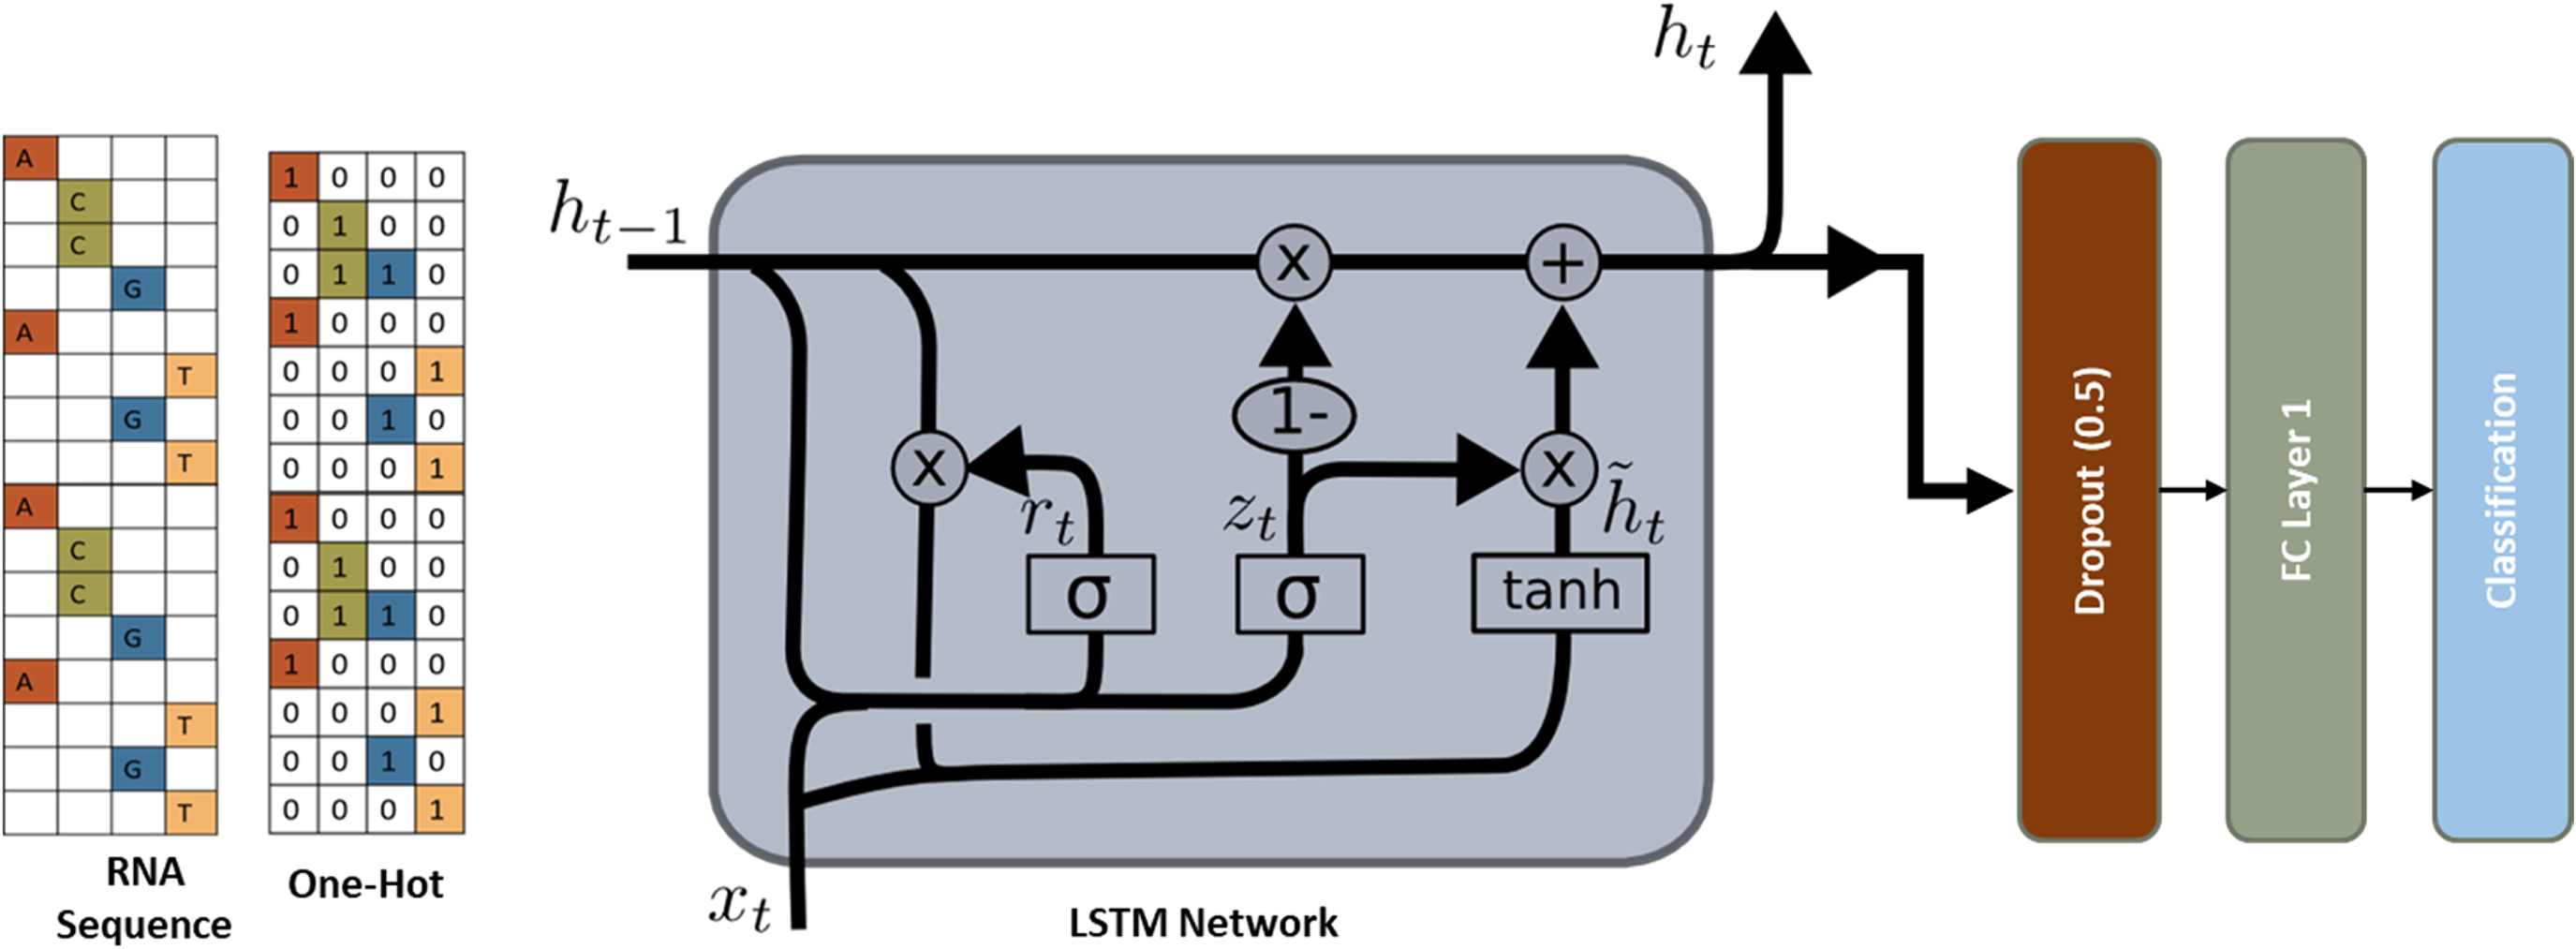
Diagram of LSTM network architecture, designed to identify splice sites in mRNA sequences.
mRNA data preprocessing
The analysis of textual data is vital in mRNA research for various purposes, including nucleotide and protein sequences. Machine learning and deep learning methods have demonstrated their effectiveness in numerous text analysis tasks, such as topic classification, spam identification, and sentiment evaluation. 17 In the framework, CNNs are employed for feature extraction, followed by RNNs and LSTM for categorization. This system accepts numerical tensors as input, specifically 2D image pixel data. However, mRNA sequences are expressed as alphabetical characters in a 1D textual format. As a result, it is essential to convert these alphabetical characters into numerical representations for CNN processing.
Researchers have used various techniques in text analysis to transform alphabetical sequences into numerical forms. One approach is to use lookup tables, in which each word in a specific vocabulary is given a corresponding vector. This method, known as word vectors, has a fixed vocabulary length in the lookup table-based representation. Word2vec is another technique that uses a neural network to learn vocabulary and produce word embeddings based on the positions of words in sentences. These representations are useful in data analysis because they offer a large-scale vocabulary, and each word can have different meanings depending on the context. However, with only four characters in nucleotide sequences, a one-hot encoding scheme 18 is adopted to convert nucleotide sequences into numerical values.
In one-hot encoding, binary variables are assigned to each character, with one variable set to 1 and the others set to 0 to signify the character. For example, in an mRNA sequence with four characters, four binary variables will be in the one-hot sequence, each standing for a character. For the “AGCT” sequence, the one-hot encoding can be figured out using Equation (1).

1D-CNN model for SSI
CNNs have been primarily tailored for two-dimensional image data analysis, encompassing tasks like object identification, video data prioritization, and more. 19 The effectiveness of CNNs is attributed to their trainable filters, which are programmed to pull out the most distinguishing features for a specific task during the learning phase. Harnessing this characteristic, many researchers have applied CNNs in the shape of 1D-CNNs to a wide range of data analytics fields, including but not limited to natural language processing, prediction of electricity energy usage, 20 and analysis of RNA sequences. 21 Taking a leaf from these methodologies, our approach also employs 1D-CNN for splice site detection tasks. CNN has proven to be one of the most reliable deep learning methods for raw data feature extraction, given its ability to select features autonomously by adjusting the filters in the integrated layers.
In the case of mRNA datasets, the sequences often have considerable length, making it challenging to capture long-term associations between these sequences. Hence, a CNN proves to be the optimal choice for classifying such data types.
In the context of 1D-CNNs, the filters engage with the one-dimensional input through a method known as a sliding window. Assume that the mRNA preprocessed one-hot sequence is the input, denoted as “x,” with four channels “c” in a single-dimensional format. Each of these channels corresponds to adenine (A), cytosine, guanine (G), and thymine (T). The product of the 1D convolution operation on “x” for layer “l” generates feature maps, which can be mathematically represented as per the equation below:

The proposed framework shown in Figure 2 starts with two 1D convolutional layers, each followed by a rectified linear unit (ReLU) activation. After these layers are three fully connected layers and a softmax layer to output the classification probabilities. This layered architecture enhances the model's ability to extract the critical features and make correct classifications.
RNN model for SSI
While the 1D-CNNs have proven to be decisive in extracting features from data, they often need to catch up in capturing sequential dependencies within the data, which is crucial in processing mRNA sequences. The research community is shifting its approach to RNNs to tackle this limitation. RNNs are tailored explicitly for sequential data analysis, which includes tasks such as human action and activity recognition and forecasting of electricity energy consumption. The main strength of RNNs lies in their recursive nature, which, during the training phase, is configured to distil the most salient features for a specific task. Utilizing this feature, many researchers have applied RNNs to a broad spectrum of data analytics arenas.
Inspired by these methodologies, our approach also harnesses the power of RNNs for splice site detection. RNNs have proven to be some of the most trustworthy deep learning techniques for raw data feature extraction, owing to their ability to automatically detect temporal patterns in sequential data. When dealing with mRNA datasets, the sequences tend to be notably long, making capturing the long-term dependencies between these sequences challenging. Thus, an RNN is the ideal choice for classifying such data types.
Incorporating the RNN architecture into the context of your project would involve explaining the iterative process of the model as it moves through each time step of the sequence. An update to the earlier description might look like this:
In the context of RNNs, units interact with sequential input in a time-stepped manner. The mRNA is splatted preprocessed one-hot sequence, denoted as “x,” into “n” time steps. At each time step “t,” only the corresponding input segment xt is processed alongside the output from the earlier step, ht−1. This process can be mathematically illustrated as follows:

The output from the final time step is then passed to the output layer:

As represented in Figure 3, the proposed model configuration begins with an RNN layer forming 512 hidden units. This is followed by a dropout layer for regulation purposes. After these layers, there is a fully connected layer and a classification layer to deliver the prediction. This layered arrangement heightens the model's capability to extract pivotal features and make precise classifications.
LSTM network for SSI
While RNNs are adept at handling sequential data, they encounter a fundamental issue, the vanishing gradient problem. 22 During the backpropagation process, as the sequence length increases, the gradients used to update the model's weights can become increasingly small. This is primarily due to the repeated multiplication of gradients through each time step, leading to an exponential decay.
Mathematically, the error is calculated as the partial derivative of the loss function concerning the network weights during backpropagation. This is given as:
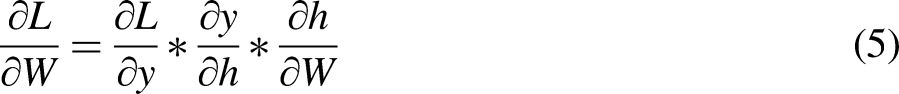
LSTMs solve this problem by introducing a cell state passed through time steps and gating mechanisms that regulate information flow. This cell state supplies a highway for the gradient, allowing it to bypass many transformations that could otherwise make it vanish. The LSTM cell is defined as:


These equations show that the cell state ct can be directly influenced by the cell state at the earlier time step ct−1, with the forget and input gates controlling what information is removed or added. As such, the vanishing gradients problem is significantly mitigated, allowing the model to learn from long sequences more effectively.
This feature of LSTMs makes them particularly beneficial for tasks involving long-range dependencies, such as the mRNA sequence analysis in our study. To address the vanishing gradient problem inherent in traditional RNNs, an LSTM layer is incorporated into the proposed model, leading to improved performance in capturing long-term dependencies and offering correct sequence classification.
Therefore, to overcome the limitations of RNNs and improve the performance of the proposed model, LSTM units are opted for in the final model architecture, as shown in Figure 4. By incorporating an LSTM layer followed by a dropout layer, a fully connected layer, and a softmax layer, the proposed model effectively learns the dependencies in the long mRNA sequences and classifies them accurately.
Experimental evaluation
In this section, an extensive evaluation of the proposed method is conducted using acceptor site datasets. The experiments were conducted in a Python 3.8 environment using Tensorflow Keras to implement 1D-CNN, RNN, and LSTM models. Matplotlib is used for plotting, sklearn for confusion matrix, accuracy score, and ROC calculation. The experiments were performed on a system with a Windows 10 platform, an i7-10750H CPU @ 2.60 GHz processor, and 16 GB RAM.
Dataset
We tested our model on a dataset called NN269,6,23 which is made up of 269 human gene sequences. This dataset includes 4922 sequences that are not real splicing sites (we call these “false”) and 1324 sequences that are real splicing sites (we call these “true”) for where the splicing starts. It also has 5552 false sequences and 1324 true sequences for where the splicing ends. In these sequences, the starting point (donor site) is made up of 15 building blocks (nucleotides), with a specific pattern “GT” appearing in the middle (8th and 9th positions). The ending point (acceptor site) sequences are longer, with 90 nucleotides, and have the pattern “AG” towards the end (69th and 70th positions).
We split these sequences into two groups for training and testing our model. For the starting points, the training group has 5256 sequences, including 1116 true and 4140 false ones. The testing group has 990 sequences with 208 true and 782 false ones. For the ending points, the training group includes 5788 sequences with 1116 true and 4672 false ones, and the testing group has 1089 sequences, including 208 true and 881 false ones.
Evaluation metrics
The primary aspect of classification involves enhancing the learning algorithm's quality, which is assessed through performance evaluation metrics. Numerous methods have been employed in the literature to improve specific and general domains. Various cross-validation techniques are applied to evaluate the quality of a statistical model, with k-fold (Jackknife) being the most used. The Jackknife test is often conducted due to its unique features, such as producing distinct outcomes and maintaining consistency. However, it demands more time to evaluate the performance of learning algorithms. To decrease the execution time while preserving the quality of the Jackknife test, the proposed work employs the k-fold cross-validation technique, which has also been utilized by Refs.24–28 The prediction quality of the suggested model can be assessed as follows:


In addition to the evaluation metrics, the ROC (receiver operating characteristic) curve and confusion matrix are essential tools for assessing the performance of a classification model. The ROC curve is a graphical representation of the trade-off between a classifier's true positive rate (sensitivity) and the false positive rate (1 - specificity) as its discrimination threshold is varied. The area under the ROC curve (AUC) is a widely used measure of the classifier's performance, with values closer to 1 showing better performance.
On the other hand, a confusion matrix is a table that summarizes the number of correct and incorrect predictions made by a classifier for each class in a classification problem. It allows for a more detailed analysis of the classifier's performance by calculating various metrics such as true positive (TP), true negative (TN), false positive (FP), and false negative (FN) rates. These metrics can be used to calculate added performance evaluation measures such as precision, recall, F1-score, and Matthew's correlation coefficient (MCC), which are particularly useful when dealing with imbalanced datasets.
Evaluation of the proposed method on acceptor sites dataset
Table 1 presents the evaluation of the proposed method on the acceptor sites dataset, where the performance of the proposed method is compared against traditional machine learning techniques such as Naïve Bayes, KNN, and SVM. Table 1 reports each classifier's accuracy, sensitivity, specificity, precision, and MCC. The proposed method forms 1D-CNN, RNN, and LSTM, outperforming traditional machine learning techniques in accuracy, sensitivity, specificity, precision, and MCC. The results show that the LSTM classifier achieved the highest accuracy of 98.52%, with high sensitivity and specificity scores of 98.88% and 96.82%, respectively, and a precision score of 0.94. These results suggest that the proposed method is effective in accurately predicting acceptor sites and could be helpful in the development of new bioinformatics tools for finding DNA sequences that play essential roles in biological processes.
Comparison of the proposed method with traditional machine learning techniques on acceptor sites dataset.

The proposed systems's results are shown in bold.
Ablation study on acceptor sites dataset
The confusion matrices provided in Figure 5 show that the LSTM classifier performs better than the RNN and 1D-CNN classifiers. The LSTM classifier has the highest number of true positives and true negatives, as well as the lowest number of false positives and false negatives, showing a higher overall accuracy. On the other hand, the RNN classifier performs slightly worse than the LSTM classifier but still outperforms the 1D-CNN classifier. The RNN classifier has a higher number of true positives and true negatives compared to the 1D-CNN classifier and a lower number of false positives and false negatives. These results suggest that the LSTM and RNN classifiers are more suitable for the splicing sites classification problem than the 1D-CNN classifier.

Confusion matrices for the acceptor sites dataset's 1D-CNN, RNN, and LSTM classifiers.
Figure 6 presents the ROC curves for the three classifiers, 1D-CNN, RNN, and LSTM, used to classify a given dataset. The ROC curve is a graphical representation of the trade-off between a classifier's true positive rate (sensitivity) and the false positive rate (1-specificity) as its discrimination threshold is varied. A higher AUC suggests the better performance of the classifier in terms of sensitivity and specificity. From Figure 6, it can be seen that the LSTM classifier outperforms both the RNN and 1D-CNN classifiers with an AUC value of 0.99. This shows that the LSTM classifier has a better trade-off between sensitivity and specificity compared to the other two classifiers. The RNN classifier also performs well with an AUC value of 0.98, showing superior performance in terms of sensitivity and specificity. The 1D-CNN classifier, however, has the lowest AUC value of 0.96, showing lower sensitivity and specificity than the other two classifiers. Overall, the results suggest that the LSTM classifier is the most suitable classifier for the classification problem of splicing sites. It has the highest AUC value, showing a better trade-off between sensitivity and specificity. However, the RNN classifier also performs well and may be a suitable alternative to the LSTM classifier. The 1D-CNN classifier, on the other hand, may not be the best choice for this classification problem as it has a lower AUC value than the two different classifiers.

ROC curves for the acceptor sites dataset using 1D-CNN, RNN, and LSTM classifiers.
Evaluation of the proposed method on donor sites dataset
Table 2 presents the evaluation of the proposed method on the donor sites dataset, where the performance of the proposed method is compared against traditional machine learning techniques such as Naïve Bayes, KNN, and SVM. The table reports each classifier's accuracy, sensitivity, specificity, precision, and MCC. The SVM classifier performs well, achieving an accuracy of 95.20% with high sensitivity and specificity scores of 97.20% and 93.20%, respectively. The proposed method comprises 1D-CNN, RNN, and LSTM, outperforming the SVM in accuracy, sensitivity, specificity, precision, and MCC. The results show that the LSTM classifier achieved the highest accuracy of 98.53%, with high sensitivity and specificity scores of 98.50% and 95.50%, respectively, and a precision score of 0.95.
Comparison of the proposed method with traditional machine learning techniques on donor sites dataset.

The proposed systems's results are shown in bold.
Comparison with state-of-the-art methods
Table 3 compares the performance of different methods for splicing site identification on donor and acceptor site datasets. The Blast model 29 performs poorly, with an accuracy of 40.23% and 39.62% for donor and acceptor sites datasets. The iSS-PseDNC method 30 achieves better results, with an accuracy of 85.45% and 87.73% for donor and acceptor sites datasets, respectively. The iSS-Hyb-mRMR method 1 further improves the performance, achieving an accuracy of 93.26% and 94.12% for donor and acceptor sites datasets, respectively. The iSS-PC method 4 also performs well, with an accuracy of 90.56% and 91.11% for donor and acceptor sites datasets, respectively. The composite features with the SVM method 6 achieve high performance, with an accuracy of 95.20% and 97.50% for donor and acceptor sites datasets. However, the proposed method using deep learning techniques outperforms all other methods, achieving an accuracy of 98.53% and 98.52% for donor and acceptor sites datasets, respectively. These results suggest that the proposed method is a highly effective and correct approach for splicing site identification, outperforming the current state-of-the-art methods.
Comparison of the proposed method for splicing site identification on donor and acceptor sites datasets.

The proposed systems's results are shown in bold.
These results suggest that the proposed method is effective in accurately splicing site identification and could help develop new bioinformatics tools for finding DNA sequences that play essential roles in biological processes.
Conclusion
In this paper, a deep learning-based framework is presented for the correct and efficient identification of splice site sequences. The proposed model uses LSTM to learn sequential patterns from RNA sequences and employs one-hot encoding to identify patterns in numerical data efficiently. A comprehensive ablation study showed that the proposed model outperforms traditional machine learning approaches and state-of-the-art techniques for splice site identification.
Our future work aims to apply advanced transformer models, notably BERT and GPT, for splice site identification. Given their remarkable achievements in various natural language processing tasks, these models hold the potential to significantly augment our ability to decode and comprehend splice site sequences. Additionally, we are considering integrating epigenetic factors and other related biological elements into our framework. This integration aims to refine the accuracy and reliability of splice site identification. Our ongoing efforts promise to steer future bioinformatics and gene expression analysis research toward new horizons, leveraging the evolving landscape of machine learning, deep learning and explainable deep learning technologies.
Footnotes
Declaration of conflicting interests
The authors declared no potential conflicts of interest with respect to the research, authorship, and/or publication of this article.
Funding
The authors received no financial support for the research, authorship, and/or publication of this article.