
Abstract
The primary objective of this trial was to study the effects of stress caused by stocking density in tilapia (Oreochromis niloticus) cultured in the in-pond raceway system (IPRS). Fingerlings (Initial body weight = 30.00 ± 1.20 g) were reared at different stocking densities i.e. low stocking density (n = 13,000; 1.77 kg/m3), medium stocking density (MSD) (n = 17,000; 2.32 kg/m3), and high stocking density (HSD) (n = 21,000; 2.86 kg/m3), all confined within the raceways of the IPRS. Each group was studied in triplicates. The observed growth revealed a regression in the HSD treatment, evident in its reduced weight gain per fish per day, in contrast to other treatments. Survival rate across all treatments was above 99%. Notably, the HSD treatment exhibited an elevated level of cortisol; however, this intensified crowding stress did not significantly undermine the nutritional value of the fish in HSD and other experimental treatments. Furthermore, an elevation in the levels of superoxide dismutase, catalase, and glutathione peroxidase was noted within the HSD treatment in comparison to the other treatments to reduce the damage caused by reactive oxygen species. As the trial proceeded, functions of digestive enzymes like amylase, protease, and lipase diminished consistently across all treatments. This could possibly signify a deliberate redirection of energy resources toward stress alleviation rather than the usual digestive processes. In summation, it can be reasonably deduced that a stocking density of approximately 2.32 kg/m3 (MSD) emerges as the optimal threshold for effectively cultivating tilapia within an intensive aquaculture framework.
Introduction
Aquaculture is one of the fastest growing industries in the world, and Asia is responsible for approximately 90% of the total global production. 1 In light of the current food security challenges, relying solely on traditional farming methods is no longer sufficient to meet the substantial increase in demand for animal protein. To accomplish this, it is essential to integrate intensive systems that make use of modern expertise in pond construction, feed formulation, and stocking densities. 2 One such modern and intensive technology is the in pond raceway system (IPRS), which combines various aquaculture methods like recirculating systems, pond culture, raceways, and cage culture to boost fish production. 3 IPRS is particularly innovative because it focuses on conserving water through careful treatment and recycling. This technology has already seen success in several countries and has also been used in our current study. 4 In intensive culture systems like IPRS, better yield would be adopted by stocking at high density without compromising on fish growth and health. The magnitude of stocking density stands as a barometer of farm productivity and ensuing financial gains 5 It is important to highlight that achieving the right number of fish in a pond is crucial for assessing its economic viability. 6 However, major development in intensive farming also leads to problems such as water pollution,7,8 ecosystem damage, 9 disease outbursts, 10 and antibiotic remainders. 11 However, intensive production systems like IPRS have their drawbacks such as its high cost which makes it economically unsuitable option for small and medium farmers. Moreover, these systems need a continuous supply of power, intense biosecurity monitoring which would be limitations in several countries.
High stocking density (HSD) often has a detrimental effect on the physiology of fish, resulting in a reduced growth rate. Increasing the number of fish within a confined space tends to have an adverse impact on their growth performance12,13 by deteriorating water quality, influencing social behavior, and causing changes in metabolic rates due to the stress associated with overcrowding.14,15 To measure the influence of stocking density on fish physiology, parameters like blood composition and alkaline phosphatase (ALP) levels are commonly used. 16 It has been observed that HSD can negatively affect certain blood parameters including hematology and blood biochemistry 17 and induce chronic stress by elevating cortisol and glucose level.18–20 Stress, particularly associated with high stocking rates, is characterized by the suppression of immune responses. 21 Physiological stress, such as overcrowding conditions, can lead to oxidative stress, manifested by an elevated production of reactive oxygen species (ROS). 22 Elevation in metabolic rate to compromise the damage caused by stress can further contribute to increase in ROS production. These free radicals accumulate rapidly and are responsible for various types of oxidative damage in the cells.23,24
The GIFT tilapia (Oreochromis niloticus) has high endurance for stress, remarkable adaptability to diverse habitats, robust reproductive potential, accelerated growth kinetics, and efficacious feeding tendencies.25,26 Globally tilapia is on fourth largest cultivated species in aquaculture. 27 There is a compelling demand to enhance aquaculture development to meet the rising global demand for fish. Global production of tilapia in year 2020 was seven million tonnes. 28 Tilapia has been subjected to cultivation across various culture models, often at high stocking densities. Previous studies on tilapia rearing encompassed an array of stocking densities in IPRS, such as 0.28 kg/m3–0.85 kg/m3, 29 2.40 kg/m3,4 and 0.57 kg/m3. 30 Different stocking densities raised in tank system was 0.0000019 kg/m3–2.04 kg/m3, 31 0.0024 kg/m3–0.016 kg/m3, 32 0.58 kg/m3–1.46 kg/m3, 33 and 1 kg/m3–15 kg/m3. 34 In cage culture, cultured densities were 0.87 kg/m3–2.63 kg/m3, 35 1.45 kg/m3–5.8 kg/m3, 36 and 2.25 kg/m3–9.15 kg/m3. 37 In Hapa culture, tilapia was stocked at 0.008 kg/m3 −0.02 kg/m3, 38 and 0.03 kg/m3–0.15 kg/m3. 39 Variant densities reared in biofloc system were 2.00 kg/m3–7.68 kg/m3, 40 1.94 kg/m3–7.78 kg/m3 41 and 0.72 kg/m3–1.44 kg/m3. 42 Multiple culture system stocked different densities but the specific density of tilapia of HSD cultured in present study has not been reared yet in IPRS.
The primary focus of this study is to investigate the optimum stocking density of tilapia and to study the effects of varying tilapia population densities on growth, nutritional quality, stress physiology, and antioxidant activity. The objective of current study is to emphasize the significance of emerging intensive farming system and propose the optimal culturing condition for tilapia against the traditional pond culture system.
Intensive aquaculture utilizes advanced technologies and selective breeding to optimize the fish strains for superior growth in demanding farming conditions. High yields depend on maintaining optimal water quality, while effective feeding strategies, considering frequency and portion sizes, play a vital role in enhancing productivity. Rigorous biosecurity measures, coupled with regular health assessments and swift interventions during disease outbreaks, are crucial to sustaining optimal growth rates. Therefore, present study selected the in-pond raceway system (IPRS) to investigate the optimum density for tilapia to present practical solution farmers.
Materials and methods
Experimental design
Rationale of the current study was grounded on prior work. 4 The investigation took place on a commercial site, with the selected stocking densities determined in collaboration with the farmer through mutual agreement (Figure 1). This study was commenced after ethical approval from Lahore College for Women University (Zoo/LCWU/932). GIFT Tilapia fingerlings n = 153,000 (initial weight = 30.00 ± 1.20 g) for this study were procured from a local fish hatchery which imported them from Thailand. There were three different stocking density treatments i.e. in low stocking density (LSD) treatment (n = 13,000, 1.77 kg/m3), in medium stocking density (MSD) (n = 17,000, 2.32 kg/m3) and in HSD (n = 21,000, 2.86 kg/m3). Fish were cultured in all these treatments for 171 days (June–November). They were fed with commercial feed (Protein: 30.43 ± 0.28%, Moisture: 11.17 ± 0.14%, Ash: 7.40 ± 0.34%, Fat: 5.67 ± 0.08%, Fiber: 3.97 ± 0.14%) at the proportion of 2% of their body mass on daily basis, twice a day. Random weight check of fish was performed on monthly basis in each treatment. Parameters of water quality such as water temperature (oC), pH and dissolved oxygen (DO) (mg/L) were noted daily (from 0.15 m and 1.22 m depths) after an interval of 4 hours from 8:00 AM until 12:00 AM (Figure 1).

A sketch showing the IPRS production system utilized in the current study. The dimensions of the raceways can be observed in the uppermost section of the image. Each raceway is equipped with fixed auto feeder. Arrows within the image indicate the direction of water flow, illustrating the movement from the White-Water Units towards the Quiescent Zone. IPRS: in-pond raceway system.
Sampling and analysis
From each triplicate, a simple random sampling of 20 fish according to probability sampling method was done after every month during the trial. In the process of simple random sampling, no specific inclusion or exclusion criteria were applied, as substantial differences in fish weight and other morphological aspects that would warrant such criteria were not identified. All selected samples exhibited a comparable morphological appearance, ensuring homogeneity within the sampled population. The sample size was determined considering the financial benefit of the proprietor of the commercial farm used in present study. Additionally, financial constraints to farmer and project budget precluded any expansion of the sample size. Fish were anesthetized using clove oil (0.8 ml/1000 ml) (Sigma-Aldrich). Blood was collected from the caudal vein for different analysis in two tubes. One tube coated with ethylenediamine tetra acetic acid (for hematology) while second tube contained clot activator (for all other analysis). Blood samples were centrifuged at 5000 rpm for 15 min and plasma was collected and stored at −20 oC. The weight and length of each fish were measured. Fish muscle samples were collected and stored at – 20 °C for whole body composition, fatty acids, and amino acids analysis following the guidelines of Association of Official Analytical Chemists (AOAC).
43
Muscle samples were dehydrated in an oven at 80°C until a consistent dry weight was reached. These dried samples were then processed for further chemical analysis. The Kjeldahl apparatus (PCSIR, Pakistan) was used to determine the crude protein, while crude lipids were identified using the Folch method
44
using the Soxhlet apparatus (PCSIR, Pakistan). The ash content in muscles was determined using the furnace burning method. For quantifying the amino acid contents of fish muscles, an amino acid analyzer (Biochrome 30+, Biochrome Limited, Cambridge, UK) was used, and the analytical procedures were in accordance with those outlined by.
45
The intestinal samples were first weighed and homogenized in 0.86% sterile normal saline solution (1 : 9). This mixture was centrifuged at 5000 rpm for 15 min. Supernatant was collected and stored at −20 °C for subsequent analysis. All analyses were done in triplicate. Condition factor (K), specific growth rate (%) (SGR), hepatosomatic index (HSI), fish weight gain, survival rate, feed conversion rate (FCR), and total gain in productivity were measured by using the given formulae.


Hematological analysis
Hematological parameters such as hemoglobin (Hb) (g/dl), white blood cells (WBCs) (103/µL) count such as neutrophils (%), eosinophils (%), lymphocytes (%) and monocytes (%), red blood cell (RBC) (106/µL) count, the content of hematocrit (HCT) (%), platelets (103/µL), mean corpuscular volume (MCV) (femtoliter), mean corpuscular hemoglobin concentration (MCHC) (g/dl) and mean corpuscular hemoglobin (MCH) (pg) were determined through auto-hematology blood analyzer (Sysmex-KX-21, Japan) calibrated for this study.
Biochemical analysis
Plasma separated after centrifugation was transferred to separate Eppendorf tubes. Each sample was run in three replicates. Triglyceride (TG) (mg/dl) was estimated through a TG colorimetric assay kit (Thermo Fisher Scientific, USA, CAT No. EEA028) following the protocols of the manufacturer. The assay range was (0.14–10 mmol/L) and its sensitivity was 0.14 mmol/L. Calibration was up to optical density of 510 nm. The level of albumin (Alb) (g/dl) was determined through the use of bromocresol green dye binding technique, utilizing an albumin kit (LOT. DR379E249; ANMOL-LAB Pvt. Ltd, India). The assay range was (0.16 g/dl −6 g/dl) and its sensitivity was 0.14 mmol/L. Calibration was up to optical density of 600 nm. The quantification of ALP (Unit/L) (U/L) was carried out using commercial kit (Thermo Fisher Scientific, USA, CAT No. EEA002, E.C. 3. I. 3.1.). The assay range was (0.13–50 King Units/100 mL) and its sensitivity was 0.13 King Units/100 mL. Calibration was up to optical density of 510 nm. Aspartate aminotransferase (AST) (U/L) was estimated through commercial ELISA kit (Thermo Fisher Scientific, USA, CAT No. MAK055, E.C. 2.6. 1.1.). The assay range was (1.1–72.3 IU/L) and its sensitivity was 1.1 IU/L. Calibration was up to optical density of 510 nm. Activity of alanine aminotransferase (ALT) (U/L) was measured using commercial ELISA kit (Sigma-Aldrich US, CAT No. MAK052, E.C. 2.6. 1.2.). Calibration was up to optical density of 570 nm. Urea activity was measured using commercial ELISA kit (DiaSys Diagnostic Systems, Germany, CAT No. 131019910021). The wavelength for this assay was (340 nm −410 nm). Urea activity was measured using commercial ELISA kit (DiaSys Diagnostic Systems, Germany, CAT No. 131019910021). The wavelength for this assay was (340 nm −410 nm). Creatinine activity was measured using commercial ELISA kit (DiaSys Diagnostic Systems, Germany, CAT No. 117119910021). The wavelength for this assay was (505 nm–571 nm). Linear calibration was followed. The concentration of glucose (GLU) (mg/dl) was measured by using laboratory blood glucose analyzer.
Cortisol assay
The concentration of cortisol (ng/ml) in blood plasma was measured using ELISA (Calbiotech, USA, CAT No. CO368S, CID 5754) having a sensitivity of 1.16 ng/ml. The intra-assay and inter-assay precision were 3.8% and 8.65%, respectively. The detection limit was 0–800 ng/ml. The cross-reactivity of cortisol is 100%. The absorbance value was read on the ELISA reader at 450 nm.
Antioxidants assay
Plasma catalase (CAT) (U/ml) activity was determined using a commercial ELISA Colorimetric Activity Kit (Thermo Fisher Scientific, USA, CAT No. EIACATC, EC 1.11.1.6) having an analytical sensitivity of 0.052 U/ml. CAT activity was calculated by adding two standard deviations to the average optimal density measured in comparison to a zero standard, with each assay performed 20 times. The absorbance was read at 560 nm at 37 °C. A bovine catalase standard is provided to generate a standard curve for the assay. Range of standard curve was 0.15–5.0 U/ml. The activity of superoxide dismutase (SOD) (ng/ml) was measured by using ELISA kit (PARS BIOCHME, China, CAT No. PRS-02005hu, EC 1.15.1.1) with an assay range of 0.3 ng/ml–10 ng/ml. Total 10 set of standard wells on ELISA-coated plates were used as standard. The absorbance value of SOD was read at 450 nm and 37 °C; for malondialdehyde (MDA) (nmol/ml) ELISA kit (PARS BIOCHME, China, CAT No. PRS-00991hu, CAS 542-78-9) with an assay range of 0.3 ng/ml–7 nmol/ml. Total 10 set of standard wells on ELISA-coated plates were used as standard. The absorbance value of MDA was read at 450 nm and 37 °C. Activity of glutathione peroxidase (GPx) (IU/ml) was measured by using ELISA kit (PARS BIOCHME, China, CAT No. PRS-00680hu, EC 1.11. 1.9) with an assay range of 3 IU/ml–200 IU/ml. The absorbance value of GPx was read at 450 nm and 37 °C. Total 10 set of standard wells on ELISA-coated plates were used as standard.
Digestive enzymes assay
For digestive enzyme analyses, the supernatant of processed whole intestine samples was utilized. Activity of lipase (U/L) was assayed with a commercial ELISA kit (Sigma Aldrich, USA, CAT No. MAK046, EC 3.1.1.3) with a detection limit of 5 U/L to 250 U/L at 37 °C and 570 nm of wavelength. Amylase (U/L) activity was measured using a commercial ELISA kit (Sigma Aldrich, USA, CAT No. MAK009A, EC 3.2. 1.1.) with a detection limit of 0.2439 U/L–2200 U/L at 37 °C and 405 nm of wavelength. The activity of protease was determined following instructions of Walter. 46 Casein 1% w/v was used as substrate in 0.2 M phosphate buffer at pH 7.0. One unit of protease indicates the amount of enzyme that releases 1 µg/ml/min of tyrosine determined at 660 nm of wavelength.
Statistical analysis
For all the statistical analyses, SPSS v.29 software was used. Data were shown as Mean ± SE for all the parameters. Kolmogorov–Smirnov test was performed to assess the normality of data. Levene test were performed to check the homogeneity of variance of data. The effect of stocking density and time (months) on different parameters was determined by repeated measures ANOVA to measure the data integrity. Repeated measure ANOVA was used to determine whether there is a statistically significant effect of between subject factor (stocking density) on different parameters. It also indicated whether a within subject factor (months) has a statistically significant impact or not. Along with that, it also provided statistical two-way interaction between the two factors i.e. within subject (months) and between subject (density) (time*stocking density). Repeated Measures ANOVA enhances statistical power and precision by reducing data variability, making it more effective than separate ANOVA tests due to its consideration of the correlation between repeated measures, ultimately leading to more accurate assessments of the independent variable's true effects. Samplings were repeated on the same stocking density group every month which also makes this statistical test the most appropriate for the analysis. To reject the null hypothesis, a 0.05 probability level was used which indicates significant (p < 0.05) or insignificant (p > 0.05) effect of stocking density, months, and combined effect of month*density. Degree of freedom (df) mentioned along each parameter was calculated as the sample size minus the number of restrictions. In case of stocking density, df was 2 as there were three treatment groups. In the case of months, it was 5 as there were 6 months. For the combined effect of month*density, df was 10 (2 × 5).
Results
Water temperature, pH, and dissolved oxygen
Water temperature in all three treatment groups varied within the range of 33.95 ± 0.41 °C–20.51 ± 0.20 °C during the grow out period (Table 1). Water pH was within the range of 7.20 ± 0.87–8.87 ± 0.03 in all groups. The level of DO (mg/L) in LSD treatment was 3.14 ± 0.32–10.86 ± 1.41. In MSD treatment, it was in the range of 3.19 ± 0.42–10.78 ± 1.32 while in HSD treatment, it lies within 3.23 ± 0.45–10.79 ± 1.29. Mean of data collected at two different depths have been given as mean of two values (at 0.5 ft and 4 ft).
Monthly variations (mean ± SE) in water temperature, pH, and dissolved oxygen (mg/L) in all density groups, measured at four different times in 24 h between June till November. Mean value of each parameter, measured at depth of 0.5 ft and 6 ft noted at four different times over 24 h has been presented.

LSD: low stocking density; MSD: medium stocking density; HSD: high stocking density.
Growth
The total harvested biomass was highest in HSD as compared to MSD and LSD (Table 2). Daily weight gain/fish was observed highest in low-density treatment (4.62 g) while lowest in high-density treatment (4.42 g). FCR of all three groups were in range of 1.21–1.26. Survival rate has been observed to be higher than 99% in all three groups.
Summary of production and other parameters in low stocking density (LSD), medium stocking density (MSD), and high stocking density (HSD) groups.

FCR: feed conversion rate.
Condition factor (%), specific growth rate (SGR) (%), and hepatosomatic index (HSI) (%)
Condition factor (df2, F = 302.44), SGR (df2, F = 170.70), and HSI (df2, F = 859.48) were significantly (p = 0.000) different between density treatment groups (Figure 2). Significant monthly variations (p = 0.000) in condition factor (df5, F = 50,053.32), SGR (df5, F = 9891.33), and HSI (df5, F = 434.30) were also observed between three treatments. Other than this, density*time also had a significant effect (p = 0.00) on condition factor (df10, F = 35,288.90), SGR (df10, F = 456.45), and HSI (df10, F = 420.22). The highest value of condition factor in the month of June was observed in MSD (11.50 ± 0.77). Range of HSI in all groups was 0.97 ± 0.04%–2.21 ± 0.05% while SGR in all the treatment groups was in the range of 446.1 ± 2.53%–650.45 ± 3.09%.

Monthly variations in the concentration of condition factor, hepatosomatic index, and specific growth rate (mean ± SE) of tilapia in low stocking density (LSD), medium stocking density (MSD), and high-density (HSD) treatments over the period of 6 months.
Chemical composition of muscles
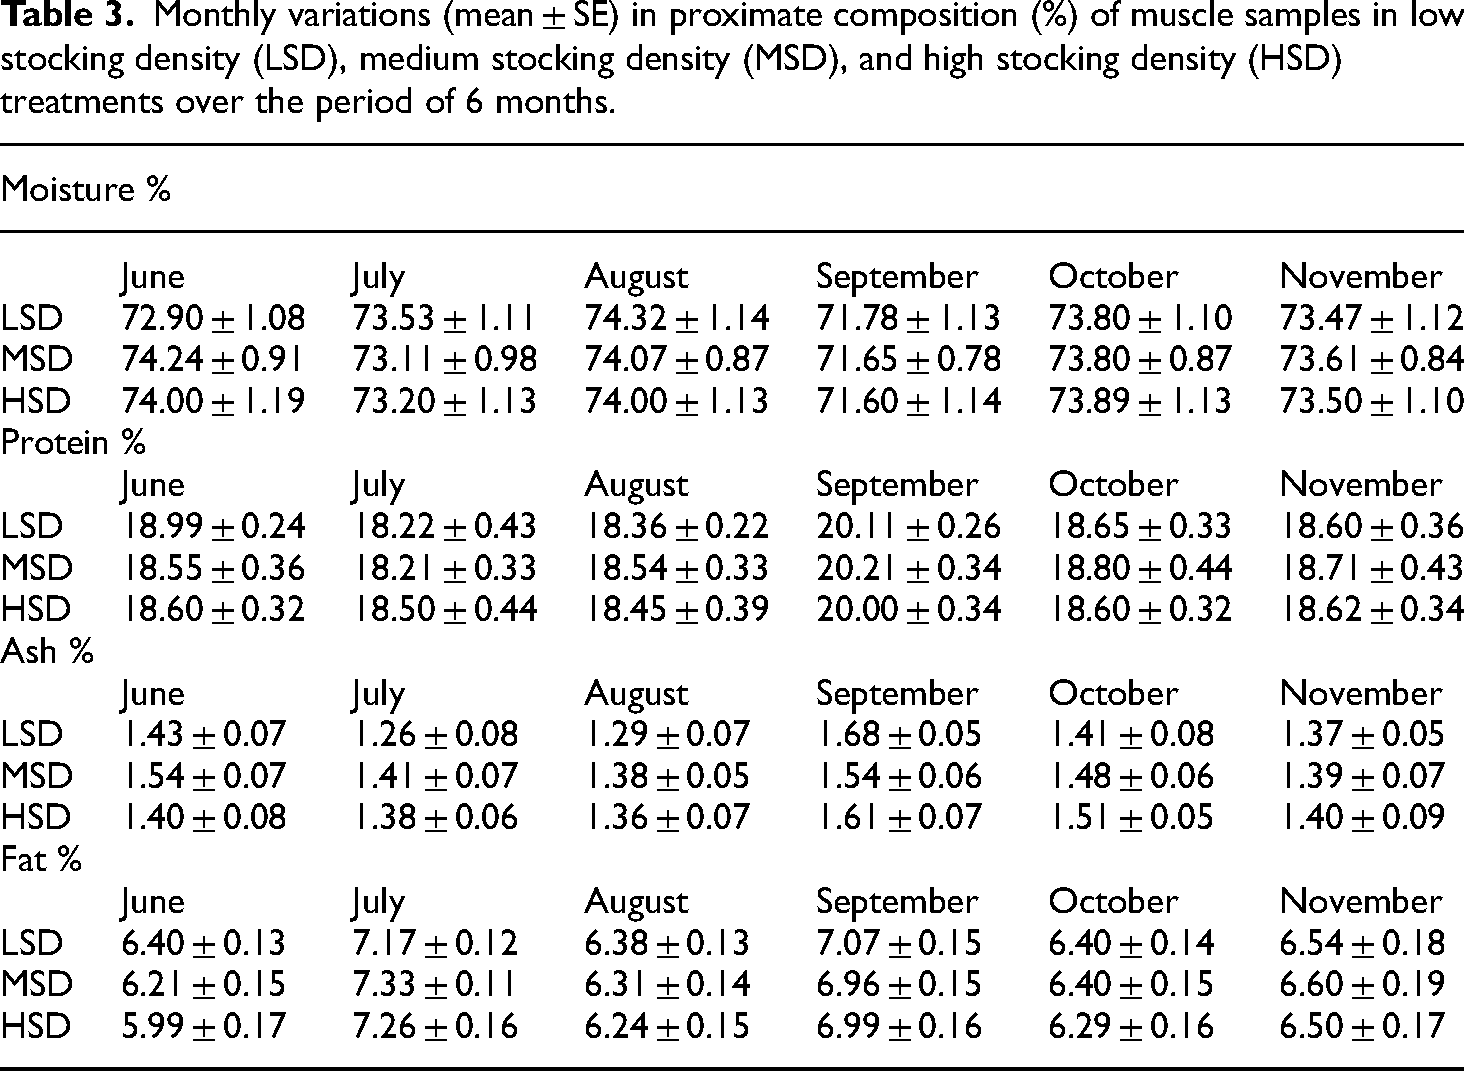
The content of moisture (df2, F = 0.039, p = 0.961), crude protein (df2, F = 0.12, p = 0.883), crude ash (df2, F = 1.41, p = 0.245), and crude fat (df2, F = 2.12, p = 0.123) was insignificantly different between all density treatments (Table 3). Monthly significantly difference (p = 0.000) in content of moisture (df5, F = 6.600), crude protein (df5, F = 34.20), crude ash (df5, F = 12.04), and crude fat (df5, F = 40.27) was observed between all treatments. Density*time also had an insignificant effect on in content of moisture (df10, F = 0.33, p = 0.970), crude protein (df10, F = 0.51, p = 0.878), crude ash (df10, F = 1.44, p = 0.155), and crude fat (df10, F = 0.59, p = 0.818). In all the treatments, the content of crude protein ranged between 20.21 ± 0.34%–18.21 ± 0.33%. Range of crude ash was 1.26 ± 0.08%–1.68 ± 0.05% in all the density treatment groups.
Monthly variations (mean ± SE) in proximate composition (%) of muscle samples in low stocking density (LSD), medium stocking density (MSD), and high stocking density (HSD) treatments over the period of 6 months.
Profile of amino acids
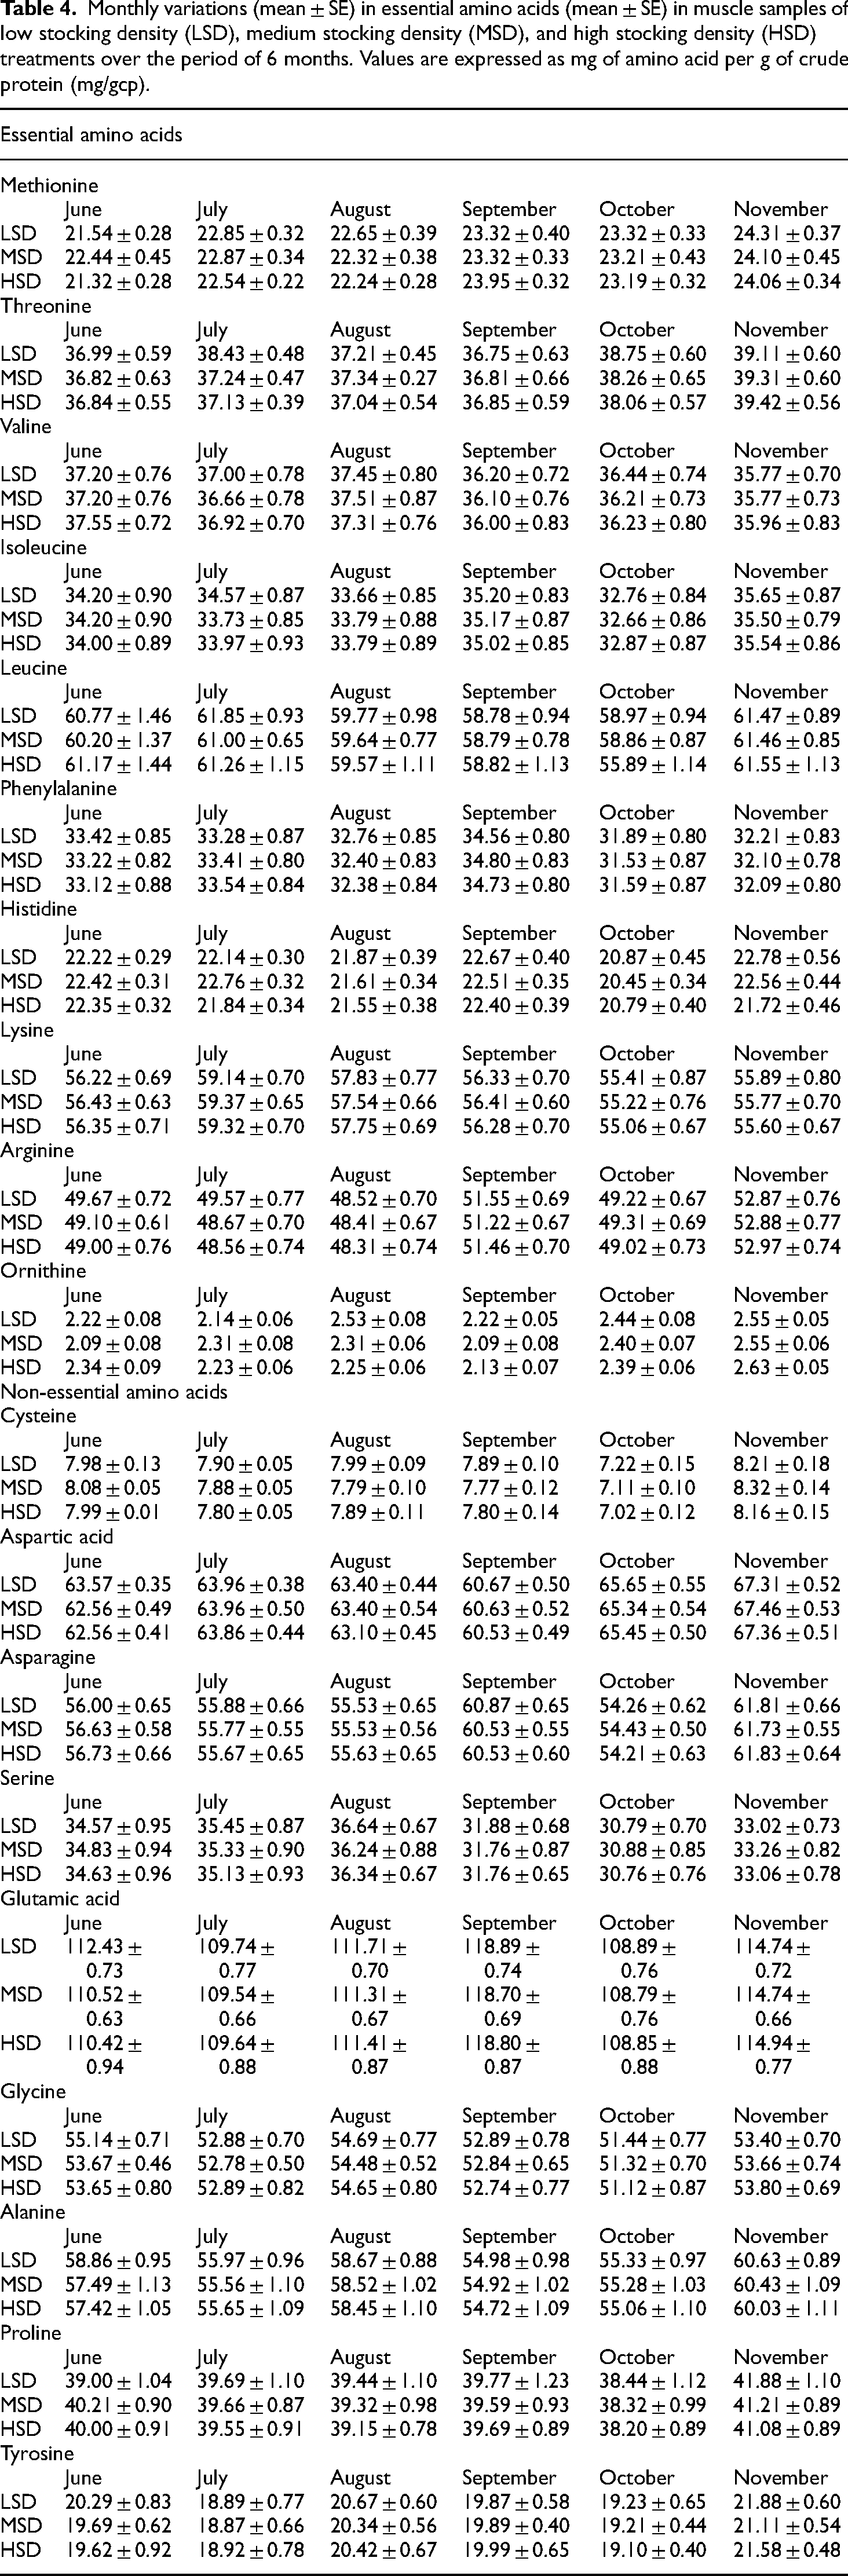
An insignificant difference (p > 0.05) has been observed in the profile of amino acids (essential [EAA] and non-essential [NEAA]) between three-density treatment groups (Table 4). A significant difference (p = 0.000) has been observed in the profile of amino acids (essential [EAA] and non-essential [NEAA]) between monthly values. The interactive effect of density × time on the content of all amino acids was also insignificant (p > 0.05) except in ornithine (p = 0.000). Leucine, lysine, and arginine showed the highest values among EAA while ornithine was the lowest in all the treatments. Glutamic acid showed the highest value among NEAA in all groups.
Monthly variations (mean ± SE) in essential amino acids (mean ± SE) in muscle samples of low stocking density (LSD), medium stocking density (MSD), and high stocking density (HSD) treatments over the period of 6 months. Values are expressed as mg of amino acid per g of crude protein (mg/gcp).
Profile of fatty acids
Repeated measure ANOVA indicated a significant difference (p < 0.05) in the content of fatty acids between all density treatments except in heptadecenoic acid (df2, F = 0.35, p = 0.704), linoleic acid (df2, F = 1.83, p = 0.163), and eicosadienoic acid (df2, F = 1.30, p = 0.274) (Table 5). Significant difference (p = 0.000) in the content of fatty acids between monthly values was observed. The combined effect of density*time on fatty acids was also significant (p = 0.000) except in pentadecyclic acid (df10, F = 1.29, p = 0.229), linoleic acid (df10, F = 1.53, p = 0.123), and in decosahexanoic acid (df10, F = 1.12, p = 0.337). Among all fatty acids, the content of polyunsaturated fatty acids (PUFAs) was higher as compared to monounsaturated and saturated fatty acids. In PUFAs, levels of a-linolenic acid, eicosapentanoic acid (EPA), and decosapentanoic acid were higher in all treatments.
Monthly variations in saturated fatty acids (mean ± SE) in total lipids extracted from muscles samples of low stocking density (LSD), medium stocking density (MSD), and high stocking density (HSD) treatments over the period of 6 months. Values are expressed as percentages of total fatty acids.

Digestive enzymes activity
Insignificant difference among density treatment was observed in the activity of amylase (df2, F = 0.62, p = 0.538) and protease (df2, F = 2.22, p = 0.111). But in lipase (df2, F = 3.16, p = 0.045), it was found to be significant (df2, F = 2.22, p = 0.111) (Figure 3). Monthly variations in the activity of amylase (df5, F = 109.59), lipase (df5, F = 152.87), and protease (df5, F = 171.17) were also significant (p = 0.000). In addition to this, collective effect of density*time on amylase (df10, F = 13.35, p = 0.000), lipase (df10, F = 35.16, p = 0.000), and protease (df10, F = 1.91, p = 0.040) was also significant. The enzymatic activity of amylase, lipase, and protease increased throughout the trial and maximum activity was observed in November.

Monthly variations in the concentration of digestive enzymes (mean ± SE) determined in intestine samples of low stocking density (LSD), medium stocking density (MSD), and high stocking density (HSD) treatments over the period of 6 months.
Profile of cortisol
The levels of cortisol differed insignificantly between three-density treatments (df2, F = 1.94, p = 0.145) (Figure 4). The variance between 6 months was significant (df5, F = 1465.73, p = 0.000). In addition to this, effect of density*time was also significant (df10, F = 9.69, p = 0.000). The concentration of cortisol during the initial months (June and July) of the trial was lower. However, its level increased afterward and remained high till end of the study. A major increase in the level of cortisol was noted at the end of trial period i.e. October at HSD.

Monthly variations in the concentration of cortisol (Mean ± SE) determined in plasma samples of low stocking density (LSD), medium stocking density (MSD), and high stocking density (HSD) treatments over the period of 6 months.
Blood biochemistry and hematology
A significant effect of stocking density between all three-density treatment was observed on the content of Hb (df2, F = 76.44, p = 0.000), WBC (df2, F = 5.15, p = 0.007), RBC (df2, F = 11.93, p = 0.000), MCV(df2, F = 6.02, p = 0.003), MCHC (df2, F = 9.88, p = 0.000), monocytes (df2, F = 5.36, p = 0.005), eosinophils (df2, F = 24.95, p = 0.000), TGs (df2, F = 18.07, p = 0.000), ALT (df2, F = 24.97, p = 0.000), AST (df2, F = 26.39, p = 0.000), ALP (df2, F = 7.37, p = 0.001), albumin (df2, F = 18.55, p = 0.000), and glucose (df2, F = 9.70, p = 0.0000) (Table 6). Content of HCT (df2, F = 1.67, p = 0.190), MCH (df2, F = 1.13, p = 0.323), platelets (df2, F = 0.26, p = 0.767), neutrophils (df2, F = 1.54, p = 0.216), and lymphocytes (df2, F = 1.11, p = 0.330) were insignificantly different between density treatment. Monthly significant difference (p = 0.000) was observed on the blood biochemistry and hematology analysis. Besides independent effects of density and time on hematological and biochemical parameters, the interactive effect of density*time on Hb (df10, F = 19.98, p = 0.000), RBC (df10, F = 3.17, p = 0.001), neutrophils (df10, F = 3.03, p = 0.001), lymphocytes (df10, F = 2.06, p = 0.025), monocytes (df10, F = 2.69, p = 0.003), eosinophils (df10, F = 19.61, p = 0.000), ALT (df10, F = 2.73, p = 0.003), ALP (df10, F = 2.73, p = 0.003), albumin (df10, F = 6.80, p = 0.000), and glucose (df10, F = 3.26, p = 0.000) were significant different. Interactive effect of density*time on WBC (df10, F = 0.25, p = 0.990), HCT(df10, F = 0.07, p = 1.000), MCV (df10, F = 0.39, p = 0.950), MCH (df10, F = 1.48, p = 0.141), MCHC (df10, F = 1.82, p = 0.053), platelets (df10, F = 0.11, p = 1.000), TGs (df10, F = 1.21, p = 0.280), and AST (df10, F = 0.68, p = 0.742) were insignificant different.
Analysis of blood hematological and biochemical parameters (mean ± SE) in plasma samples, collected from low stocking density (LSD), medium stocking density (MSD), and high stocking density (HSD).

WBC: white blood cell; RBC: red blood cell; MCV: mean corpuscular volume; MCHC: mean corpuscular hemoglobin concentration; AST: aspartate aminotransferase.
Antioxidant assay
Effect of stocking density on the levels of CAT (df2, F = 510.88, p = 0.000), SOD (df2, F = 3458.23, p = 0.000), GPx (df2, F = 2042.40, p = 0.000), and MDA (df2, F = 5.76, p = 0.004) was significant different between density treatment (Table 7). The variance in the monthly values of CAT (df5, F = 305.37), SOD (df5, F = 897.49), GPx (df5, F = 761.44), and MDA (df5, F = 79.00) was significant (p = 0.000). Impact of density*time also effected the levels of antioxidants i.e. CAT (df10, F = 16.03), SOD (df10, F = 134.37), and GPx (df10, F = 21.35) was significantly different (p = 0.000) while in MDA (df10, F = 0.61), it was insignificantly (p = 0.801). The levels of these antioxidants increased with each passing month of the trial and were the highest towards the end of the study i.e. November. Collectively, in all the treatments, the concentration of CAT, SOD, MDA, and GPx was within the range of 0.79 ± 0.01 U/ml to 2.65 ± 0.01 U/ml, 0.26 ± 0.01 ng/ml to 0.93 ± 0.03 ng/ml, 0.17 ± 0.01 nmol/ml to 0.91 ± 0.03 nmol/ml and 3.16 ± 0.11 IU/ml to 6.90 ± 0.12 IU/ml, respectively.
Analysis of tilapia antioxidant activity including catalase, superoxide dismutase, and glutathione peroxidase and malondialdehyde (mean ± SE) cultured at low stocking density (LSD), medium stocking density (MSD), and high stocking density (HSD).

SOD: superoxide dismutase.
Discussion
In intensive farming, IPRS proves to be an efficient system for attaining high yield and gaining the desired protein source to fulfill their nutrition demands. Present study was conducted on IPRS in which different stocking densities were reared with high aeration for attaining elevated yield. In current study, total harvested biomass observed was 48.41 kg/m3, 62.81 kg/m3, and 75.06 kg/m3 in LSD, MSD, and in HSD treatment respectively. Similar investigations focusing on tilapia have also reported significantly higher harvested biomass when cultivated in raceways, ranging from 22.15 kg/m3 29 to 57.33 kg/m3. 4 Under the IPRS framework, a diverse range of harvested yields were achieved encompassing from 27 to 60 kg/m3, resulting in a combined total biomass of 47,140 kg across seven separate raceways. 47 Limited information exists on IPRS. This study exclusively investigates into growth-related data within the domain of the specific intensive farming system, IPRS. We focus on maintaining objectivity by refraining from comparing the results of our study with those from other intensive farming operations. Rather, our concentration is solely directed towards evaluating the growth and biomass aspects inherent to IPRS. Since 2013, this intensive aquaculture technique successfully raising tilapia at a density of 136 kg/m3, in addition to Grass carp (Ctenopharyngodon Idella) at a density of 100 kg/m3. In another context, channel catfish displayed a yield of 7506 kg/ha with a stocking density of 199 kg/m3, while hybrid catfish delivered an impressive 13,034 kg/ha with a cultured density of 214.7 kg/m3 across seven raceways. 48 In a separate case, hybrid catfish were introduced into eight raceways and achieved a remarkable biomass of 33,531 kg. 49 Upon comparing current study findings with prior IPRS data, it became evident that the overall health conditions of the fish as well as pond management, water quality, and feed management, all met the established industry standards.39,47,48
The survival rate of tilapia in our current trial exceeded an impressive 99%, marking a significant improvement over previous IPRS studies on tilapia, where survival rates ranged from 86.23% 29 to 43–92%, 50 92%, 51 and 94.1%. 52 The survival rates of channel catfish (Ictalurus punctatus) raised in IPRS settings varied from 47% to 69.1%, 53 83.7%,48,54 98%, 52 58.9%, 49 85.6%, 55 and 54.4% to 83.6%, 56 with an additional range of 67.5% to 81.4%. 57 Notably, hybrid channel catfish exhibited a remarkable 89.10% survival rate under the IPRS conditions.48,54 In current study, the average growth rate of tilapia was noted within the range of 4.42 to 4.62 g/fish/day encompassing all three-density treatments. Similar outcomes were documented for tilapia raised in the IPRS, where they displayed an average growth rate of 4.67 g/fish/day. 4 In contrast to present study findings, prior research did not demonstrate such rapid growth. Channel catfish, for example, exhibited growth rates ranging from 1.43 to 1.78 g/fish/day, 53 1.1 to 1.8 g/fish/day,48,54 2.50 g/fish/day, 49 3.50 g/fish/day, 57 and 1.00 to 2.50 g/fish/day. 56 In alternative IPRS designs and cage settings, growth rates ranged from 2.63 to 2.77 g/fish/day. 55 Hybrid catfish displayed an average growth rate of 1.60 to 2.20 g/fish/day.48,54 When it came to tilapia raised in IPRS, their growth rate translated to a gain of 2.60% to 3.07% per day. 47
In the current research, a significant emphasis was on assessing the nutritional value of fish. This involved analyzing their protein content, amino acid profile, and lipid composition. Interestingly in high-density conditions, there was an increased presence of total PUFA including α-linolenic acid, EPA, and DHA. This suggests that even with the elevated stocking density the nutritional quality of tilapia remained uncompromised.4,48,58 These findings also pointed to an optimal range for the n-3 and n-6 fatty acid ratio which is typically recommended to be between 1.6 and 2.0 for freshwater species. 59 A similar trend was noticed in largemouth bass raised in high-density raceways. 60 Furthermore, the amino acid profile encompassing both essential and non-essential amino acids within the density treatment under high-density conditions fell within an optimal range affirming the effectiveness of the system. Previous research on tilapia has also reported an ideal range for total essential amino acids.61–63 It is worth noting that the value recommended for total sulfur amino acids in the context of human nutrition is 22 mg/g of crude protein, a benchmark that present study successfully met under high-density conditions. 64 In the current study, there were no quantitative differences observed in amino acids among the density groups. These findings align with previous research on grass carp (ctenopharyngodon idellus) which also showed no changes in total amino acid and total essential amino acid levels under HSD. The increased levels of essential amino acids might meet heightened energy demands and promote functional protein synthesis as a response to crowding-induced stress. Additionally, the higher content of non-essential amino acids observed in this study suggests an adaptive mechanism of gluconeogenesis to increase energy availability. 65
The function of digestive enzymes plays a vital role in determining how effectively fish utilize the nutrients in their diet ultimately affecting their growth and overall health. 66 In current study, no variations in amylase and protease activity among all three-density treatments were observed which aligns with previous research on Puntius sarana (P. sarana). 67 However, there was decreased in lipase activity in response to HSD in current study. Decrease in lipase activity was due high mass as fish placed in high-density conditions may experience stress which can disrupt their endocrine system which directly affect their digestive system.68,69 To adapt to these stress conditions, fish tend to rely more on their primary energy sources directly impacting their growth. 70
The assessment of stress levels can be conducted by observing changes in catecholamine levels, fluctuations in corticosteroid hormone levels, and alterations in blood profiles.71,72 The results from current trial showed an increase in cortisol levels in the raceways particularly at high stocking densities, when compared to lower stocking density conditions. These findings were consistent with earlier research studies.21,73–75 Stress-related factors stimulate the production of catecholamines which in turn trigger processes like gluconeogenesis and glycogenolysis leading to elevated glucose levels. 16 Present study also revealed higher levels of glucose and cortisol in the raceways, in line with similar observations in various species.74,76–83 Elevated cortisol levels due to HSD were also noted in many species. 73 , 75 ,81,83,84
There is a clear connection between increased hemoglobin levels and stress because stress triggers the release of adrenaline leading to an excessive production of RBCs. This excess of RBCs prompts specialized cells to generate more hemoglobin cells to maintain optimal blood oxygen levels.85,86 The rise in hemoglobin levels also results in hyperglycemia, initiated by the release of cortisol into the bloodstream which in turn triggers hepatic glycogenesis.29,87 In current study, elevated hemoglobin levels in the HSD treatment were observed consistent with prior research on other species like.21,29,73,76,88 Additionally, ALT and AST which are widely recognized aminotransferases, function as indicators of potential disruption in hepatopancreatic function and are also employed as markers of stress. 89 Increased ALT levels typically indicate unhealthy liver condition due to stress.90,91 In present study, high level of ALT and AST, along with decreased albumin levels, in response to HSD were observed. These findings are in line with previous research conducted on species.17,92
The evaluation of fish immune response is closely tied to their antioxidant capabilities. These mechanisms serve as a defense against the generation of harmful free radicals and ROS which are direct indicators of stress and can potentially harm various tissues and organs. 93 Two crucial antioxidant enzymes namely superoxide dismutase (SOD) and catalase (CAT) play a pivotal role in maintaining a balance in ROS production. 94 In present study, indicate high levels of antioxidant enzyme activity in high-density conditions including SOD, catalase and glutathione peroxidase. This finding aligns with prior documented research. 76 Similar trends were also noted in other species. 81 ,83,89,92,95–97 HSD also displayed a rising trend in catalase. 98 While high levels of catalase and SOD activity were noted in. 99 Furthermore, elevated levels of SOD, catalase, and glutathione peroxidase were observed in.51,98,100–107
The study holds significance in exploring the optimal stocking density for tilapia and examining its impact on growth, nutritional quality, stress physiology, and antioxidant activity. The primary objective of the current research is to underscore the importance of the emerging intensive farming system and recommend optimal cultivation conditions for tilapia as opposed to the conventional pond culture system. With the successful achievement of the study objectives, it has been demonstrated that IPRS represents an efficient technology for enhancing aquaculture production. Owing to financial constraints, study was unable to employ more paradigms of stocking density. The study was further limited to analyze several other parameters due to financial constraints in this project, although all necessary parameters were measured. It is expected to investigate more stocking density paradigms in future.
Conclusion
The findings of this study affirm that cultivating tilapia at elevated densities within the intensive IPRS system. Optimum stocking density for culturing tilapia in present study was noted to be MSD (2.32 kg/m3) without compromising growth and health of fish. Under high-density conditions, an average final biomass of (2.86 kg/m3) was attained, accompanied by notable survival rates, while preserving the quality of fish, there was slight decline in growth of fish at HSD. Nevertheless, under various stocking densities, nutritional quality, survival rate, immunity, and disease resistance remained uncompromised. In light of these insights, it can be definitively inferred that these intensive rearing circumstances present a viable approach for cultivating tilapia at substantial stocking densities, enabling the attainment of desired yields without compromising their health. The findings of this study suggest that successful intensive aquaculture, characterized by HSD for tilapia, has the potential to transform the aquaculture industry. This transformation could result in increased production efficiency, economic viability, optimized resource utilization, and improved food security. Furthermore, future research should explore the potential of tilapia and other species to achieve a final biomass of 75–150 kg/m3. Additionally, the study should assess the expression of genes related to fish stress signaling pathways. In this context, the incorporation of additives such as turmeric, curcumin, phytol, and N-acetyl cysteine could be utilized as a dietary supplement to mitigate stress in intensive farming on a large scale.
Footnotes
Acknowledgment
The authors acknowledge Higher Education Commission of Pakistan, and R.S.N. Janjua for their support in this study.
Declaration of conflicting interests
The authors declared no potential conflicts of interest with respect to the research, authorship, and/or publication of this article.
Funding
The authors received no financial support for the research, authorship, and/or publication of this article.
Author biographies
Wajeeha Komal is completing an extensive project on improving production of tilapia under different regimes of high stocking density.
Shafaq Fatima’s research work is related to different aspects of aquaculture and fisheries. Specialized research areas are in fish physiology, immunology, nutrition, reproduction, aquaculture production systems, toxicology and fish diseases. Over the last few years, Fatima has been involved in investigating alternative protein sources for warm water fish species such as carps and pangasius. Considering the international situation of food security and sustainability, it is very important to have alternative plant and animal protein sources. Moreover, Fatima’s recent interests are in aquaculture extension involving modern production systems and improving their efficiency to get higher production.
Qandeel Minahal has played a crucial role in the successful completion of an extensive project aimed at enhancing the production of Labeo rohita under various high stocking density conditions. Her dedicated efforts and expertise were key factors in this project success too.
Razia Liaqat has successfully completed a project on Pangasius hypophthalmus, aiming to enhance their growth, immunity and disease resistance. Her expertise and significant contributions were instrumental in the successful completion of this task.