
Abstract
To ensure both optimal health and performances, monitoring physiological and psychological states is of main importance for athletes. It is well known that monitoring heart rate variability and using validated questionnaires is useful for monitoring both the health and training status of athletes of different sports. Motorsports such as rally require high levels of physical and mental preparation thus information about psychophysiological status of rally athletes is fundamental. The aim of this study was to assess the autonomic regulation, stress, recovery conditions of one driver and one co-driver competing at the Italian National Rally Championship during their competition period. Heart rate variability parameters, acute recovery and stress states were assessed the day before, during the two days of race and the day following the races. Results showed that driver and co-driver had a sharp decrease of mean RR intervals, root mean square of successive differences between normal heartbeats, and standard deviation of the N-N interval during race days, while the stress index showed the inverse trend, and this behaviour was clearly visible in the Poincaré plots and power spectrum density graphs. The acute recovery and stress states questionnaire showed significant differences in recovery and stress scoring for the driver but not for the co-driver, although the trends were similar. This study describes the psychophysiological demands of a rally competition period suggesting that a daily evaluation of heart rate variability, recovery, stress states is useful for monitoring health status in rally athletes and could be implemented to make decision about training and recovery strategies.
Keywords
Introduction
Monitoring training loads, recovery, and stress of athletes is fundamental in the sport competition period as well as during training phases throughout the year. 1 Training load can be divided into an external load, defined as the work performed by the subject (e.g. total distance covered, performed repetitions with a certain amount of weight), and internal load which is the stress imposed on the subject (estimated using metrics such as heart rate response or rate of perceived exertion), and a combination of these two is very useful to monitor the health status of athletes.2,3 In addition, multiple variables need to be taken into account to design specific training programmes and evaluate athletes’ state, such as maximal capacities, 4 autonomic nervous system (ANS) response, and psychophysiological states.5–9
For instance, motorsports require high capacity to respond and adapt to the continuous changes in the environmental situation during a race. 10 The different stressors representing motorsports, (e.g. noise, carbon dioxide exposure, thermal stress, vibration, visual-spatial change) can affect both physical and psychological conditions of the athlete. 11 Indeed, drivers and co-drivers are exposed to several psychomotor stressors potentially leading to rapid fatigue and diminished driving performance. 12 Thus, considerable levels of cognitive and physical preparation are required for these athletes to be successful.
ANS assessment provides insights into training adaptation and recovery. Among various methods, heart rate variability (HRV) has emerged as a non-invasive, easily employable and reliable tool.13–16 HRV is a physiological phenomenon represented by periodic variations in the time interval between heartbeats (i.e. RR intervals). 17 It is well established that HRV analysis can provide direct information regarding the parasympathetic system contribution, and the indirect involvement of the sympathetic system. 18 Low HRV values are an index of ANS inefficiency and overtraining, whereas higher levels indicate positive adaptations of the ANS to training.19,20 HRV variables are usually obtained from short-term (i.e. 5–10 min) RR interval recordings in supine or seated position. 21 Accounting for HRV recovery while programming training protocols leads to better results, 22 and changes in HRV can predict performance. 23 Indeed, it was demonstrated that changes in ultra-short HRV measures were associated with increased performance in futsal players. 23 Among the different variables used to evaluate HRV, the square root of the mean squared difference of successive RR intervals (RMSSD), and the standard deviation of NN (SDNN) intervals represent a robust index of autonomic function and they are often considered to monitor recovery and performance in athletes. 24 Other variables could be used to assess the contribution of the sympathetic branch on HRV regulation. For instance, the stress index (also known as the sympathetic index) is used as an index of strain that illustrates the sympathetic regulation activity.25,26 Another nonlinear method to analyze HRV both quantitatively and qualitatively is the analysis of the Poincaré plot. The Poincaré plot is a two-dimensional scatter plot constructed by plotting consecutive RR intervals, that is RRn (i.e. the time between two successive R peaks, on the x-axis) vs. RRn + 1 (i.e. the time between the next two successive R peaks, on the y-axis). 27 This plot displays the correlation between consecutive samples in a graphical manner. In addition, the Poincaré plot provides a means to make a qualitative analysis of HRV: This plot can be evaluated in a qualitative way using their visual pattern whereby the shape of the plot is categorized into functional classes that indicate heart conditions. 28 The plot provides summary information as well as detailed beat-to-beat information on the behaviour of the heart. 29 Indeed, this type of analysis provides further information on the standard time-domain of HRV signal. 30
Other than time domain and nonlinear results, frequency domain metrics are used to evaluate HRV. The two main frequency domain parameters obtained from spectral analysis are highly used: Low frequency (LF) power (0.04–0.15 Hz) represents both sympathetic and vagal influences, and the high frequency (HF) power (0.15–0.40 Hz), that reflects the modulation of parasympathetic tone. 31 Thus, the power spectrum density (PSD) analysis represents an additional useful means to evaluate HRV along with time domain methods. 32
Nevertheless, psychometric scales are useful to provide psychological information about the athlete's state, and among these, the Acute Recovery and Stress Scale (ARSS) has been shown to be sensitive in monitoring recovery-stress imbalances in elite athletes. 33 The use of objective physiological parameters as HRV along with psychometric tools could represent a strong method to assess the physical and mental status of athletes. Thus, in this study, we assessed autonomic regulation using the time domain, nonlinear method, and frequency domain, along with recovery and stress state (using the ARSS), of two elite rally athletes (driver and his co-driver) to examine physiological demands before, during, and after a competition period. To the best of our knowledge, this is the first descriptive study in which a comprehensive HRV profile, stress and recovery state are evaluated in an integrated manner, to assess health and training status in elite rally athletes.
Materials and methods
Participants
One male rally driver (25 years, 73 kg, 172.0 cm, body mass index (BMI) = 24.68) and his co-driver (23 years, 75 kg, 184.2 cm, BMI = 22.10) competing at the Italian National Rally Championship (Targa Florio rally) volunteered to participate in this study. Anthropometric measurements were performed in the morning by a certificated level 1 ISAK anthropometrist, as previously described.34,35 Subjects wore light clothing and had fasted for at least 12 h before the assessments. Height was measured to the nearest 0.1 cm, and body weight was measured to the nearest 0.1 kg using a stadiometer with a balance-beam scale (Seca 200, Seca, Hamburg, Germany). In addition, HRV parameters were obtained, and the ARSS questionnaire was administered the day before the competition (test day), during the competition period (race days 1 and 2) and the day after (rest day). Every race day, 6 tests were carried out, lasting from a minimum of 4 min to a maximum of 16. The race ended with first place in the Italian Junior championship. The study timeline is reported in Figure 1. Participants were healthy, non-smokers, with no history of cardiovascular or metabolic diseases. They had been elite rally athletes (Italian National Rally Championship) for one year at the time of the present investigation. Moreover, participants were asked not to engage in strenuous exercise, or drink alcohol or caffeine before and during the monitoring days since such stressors can affect physiological measurements. 36 Additionally, participants were advised to achieve the optimal amount of sleep (7–9 h) as recommended by the American Academy of Sleep Medicine and Sleep Research Society guidelines. 37

Schematic representation of the study design. HRV, acute recovery and stress states were measured before, during, and after a competition period using the Bodyguard 2 and the ARSS questionnaire, respectively. All the measures were obtained in the morning, at rest and at the same time of the day (between 6:30am and 7:30am). HRV: heart rate variability; ARSS: Acute Recovery and Stress Scale; TD: test day; RD1: race day 1; RD2: race day 2; RestD: rest day.
They performed 3 days of supervised athletic preparation (both strength and endurance-based training) per week and one drive test with a video check before every competition. Of note, the present data arose as a condition of the monitoring procedures regularly performed by the team. The technical staff approved the conduction of the study. Because of the retrospective nature of the analyses without interfering with the training routine, signatures of the informed consent form were not required. 38 The procedures were performed in accordance with the ethical standards of the Helsinki Declaration and all physical performance data were anonymized before analyses to ensure participants confidentiality.
Heart rate variability analysis
The RR intervals were acquired using Bodyguard 2 (Firstbeat Technologies Ltd, Jyväskylä, Finland) wearable device that was positioned according to the manufacturer's instructions. Bodyguard 2 records the ECG signal with electrodes, processes the signal with an integrated algorithm and provides beat-to-beat RR intervals as an output with a 1 ms resolution. Briefly, the device end was attached to the right side of the body under the collarbone whereas the cable end was attached to the left side of the body on the rib cage. Participants wore the devices for a period of 4 consecutive days (test day, race days 1 and 2, and rest day). The HRV data were analyzed using Kubios HRV Standard 3.4.0 software. All the signals were inspected for artefact, and the threshold-based algorithm available in Kubios software was applied if needed. 39 Regarding time-domain analysis, mean RR intervals, SDNN, RMSSD and the stress index (i.e. the square root of Baevsky's stress index) were obtained. Baevsky's stress index was calculated as follows:

where in the above, AMo is referred to as mode amplitude denoted in terms of %, Mo here is the mode (the most recurring RR interval) and M × DMn represents the variation scope reflecting a degree of RR interval variability of the heart. 40
HRV was analyzed every morning at rest (5-min window), thus excluding exercising/competition periods, as previously reported. 41
Poincaré plots were also obtained for an additional qualitative analysis of HRV. The RR interval Poincaré plot appears as an extended cloud of points oriented along the line of identity (i.e. RRn = RRn + 1). Thus, the shape of the plot is measured as the dispersion of points perpendicular to the line of identity, and along the line of identity. When the plot is adjusted by the ellipse-fitting technique, three important measures are obtained: the SD1, which is the standard deviation perpendicular to the line of identity, the SD2, which is the standard deviation along the line of identity, and the ratio between SD2 and SD1 (SD2/SD1) that measure the unpredictability of the RR series. 42 Regarding frequency-domain, LF, HF and LF/HF (that is highly correlated with SD2/SD1) were measured using an autoregressive (AR) algorithm.
Acute Recovery and Stress Scale
The ARSS consists of 32 adjectives describing physical, emotional, mental, and overall aspects of recovery and stress. 33 These descriptions were evaluated using a Likert-type scale ranging from 0 (does not apply at all) to 6 (fully applies). After familiarization, the participants were asked to fill the questionnaire without any external help every morning (7–7:30 am).
Statistical analysis
The Kolmogorov-Smirnov was used to check for data distribution. Then, the analysis of variance (ANOVA) test was performed to check for differences in ARSS on the four consecutive days. The Tukey post-hoc analysis was used for multiple comparisons. Analyses were executed using SPSS 27.0 (SPSS, Inc., Chicago, IL, USA). All values are presented as mean values ± standard deviations. Statistical significance for ARSS measurements was set at p < 0.05.
Time-domain (mean RR intervals, SDNN, RMSSD, stress index), nonlinear results (SD2/SD1), and frequency-domain (LF, HF, and LF/HF) data are expressed as single timepoint values for a descriptive purpose. The Poincaré plots and PSD graphs were used for additional qualitative data interpretation.
Results
Time-domain results
Results showed that mean RR intervals, SDNN, and RMSSD had a sharp decrease in both, driver and co-driver during the two days of competition (race day 1 and 2), compared to the test day and the rest day. Specifically, the lowest and highest values were measured during the race day 2, and rest day, respectively. The stress index showed an opposite trend, increasing during the two days of the race in both the driver and co-driver. All the values regarding the time-domain measurements are reported in Table 1.
Descriptive data regarding time-domain parameter. All the data are obtained from a 5-min recording at rest. Sample frequency acquisition was 1000 Hz.
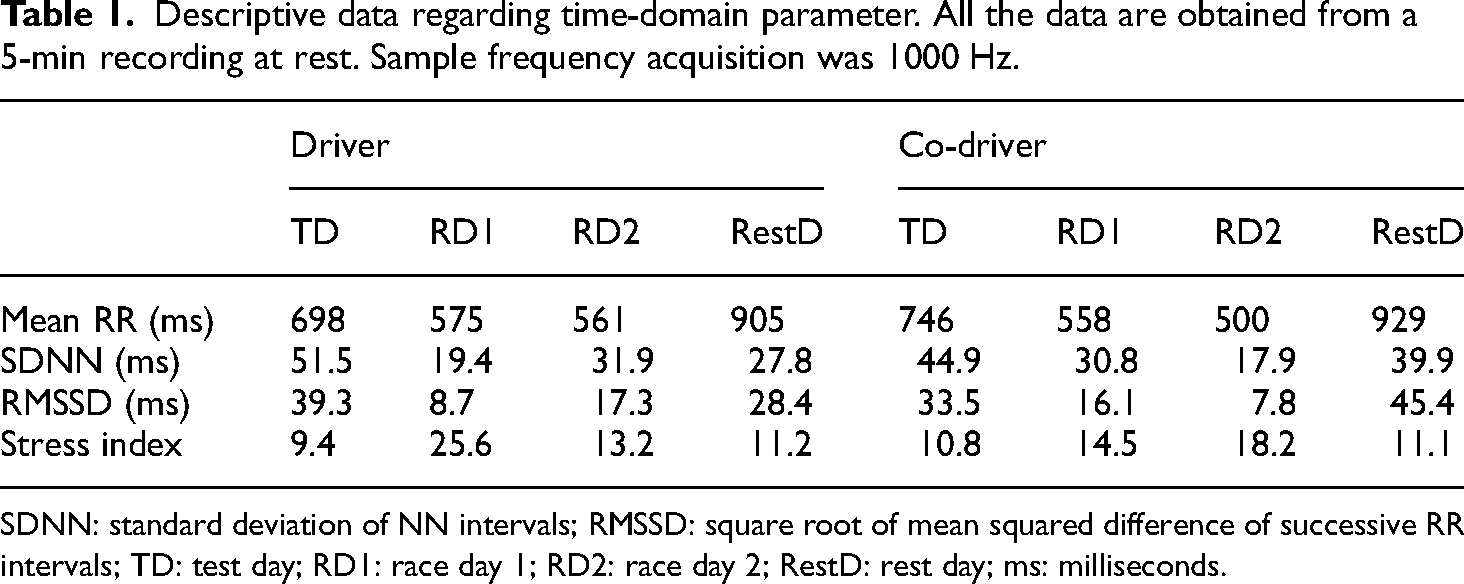
SDNN: standard deviation of NN intervals; RMSSD: square root of mean squared difference of successive RR intervals; TD: test day; RD1: race day 1; RD2: race day 2; RestD: rest day; ms: milliseconds.
Poincaré plots
Poincaré plot shapes for both driver and co-pilot had the widest aspect (reflecting a high parasympathetic influence) during the rest day (Figure 2(a), (d), (e), and (h)). In addition, during the two days of the race, the plots showed the narrowest appearance, (Figure 2(b), (c), (f), and (g)) indicating high sympathetic activity. From a quantitative point of view, we also considered the ratio between SD2 (Figure 2, orange lines along the line of identity) and SD1 (Figure 2, blue lines perpendicular to the line of identity) was considered, reflecting the relative sympathetic branch influence in the regulation of HRV. Indeed, regarding the driver, the SD2/SD1 was 2.424, during the test day, 4.318 and 3.551 during the race days and 1.654 on the rest day. The SD2/SD1 for the co-driver was 2.483 during the test day, 3.699 and 4.460 during the two consecutive race days respectively, and 1.445 during the rest day.

Poincaré plots representing the graphical trend of consecutive RR interval (RRn vs. RRn + 1) during the 5-min rest recording during the four days of monitoring from driver (a, b, c, d) and co-pilot (e, f, g, h). SD1: standard deviation perpendicular to the line of identity of the plot; SD2: standard deviation along the line of identity of the plot; TD: test day; RD1: race day 1; RD2: race day 2; RestD: rest day.
Power spectrum density
The PSD graphs provide a qualitative way to analyze the relative involvement of the sympathetic/parasympathetic branches from a frequency-domain point of view. In Figure 3, the grey part in the graphs represents the very low frequency (VLF) band, the orange one indicates the LF band and the blue one represents the HF band.
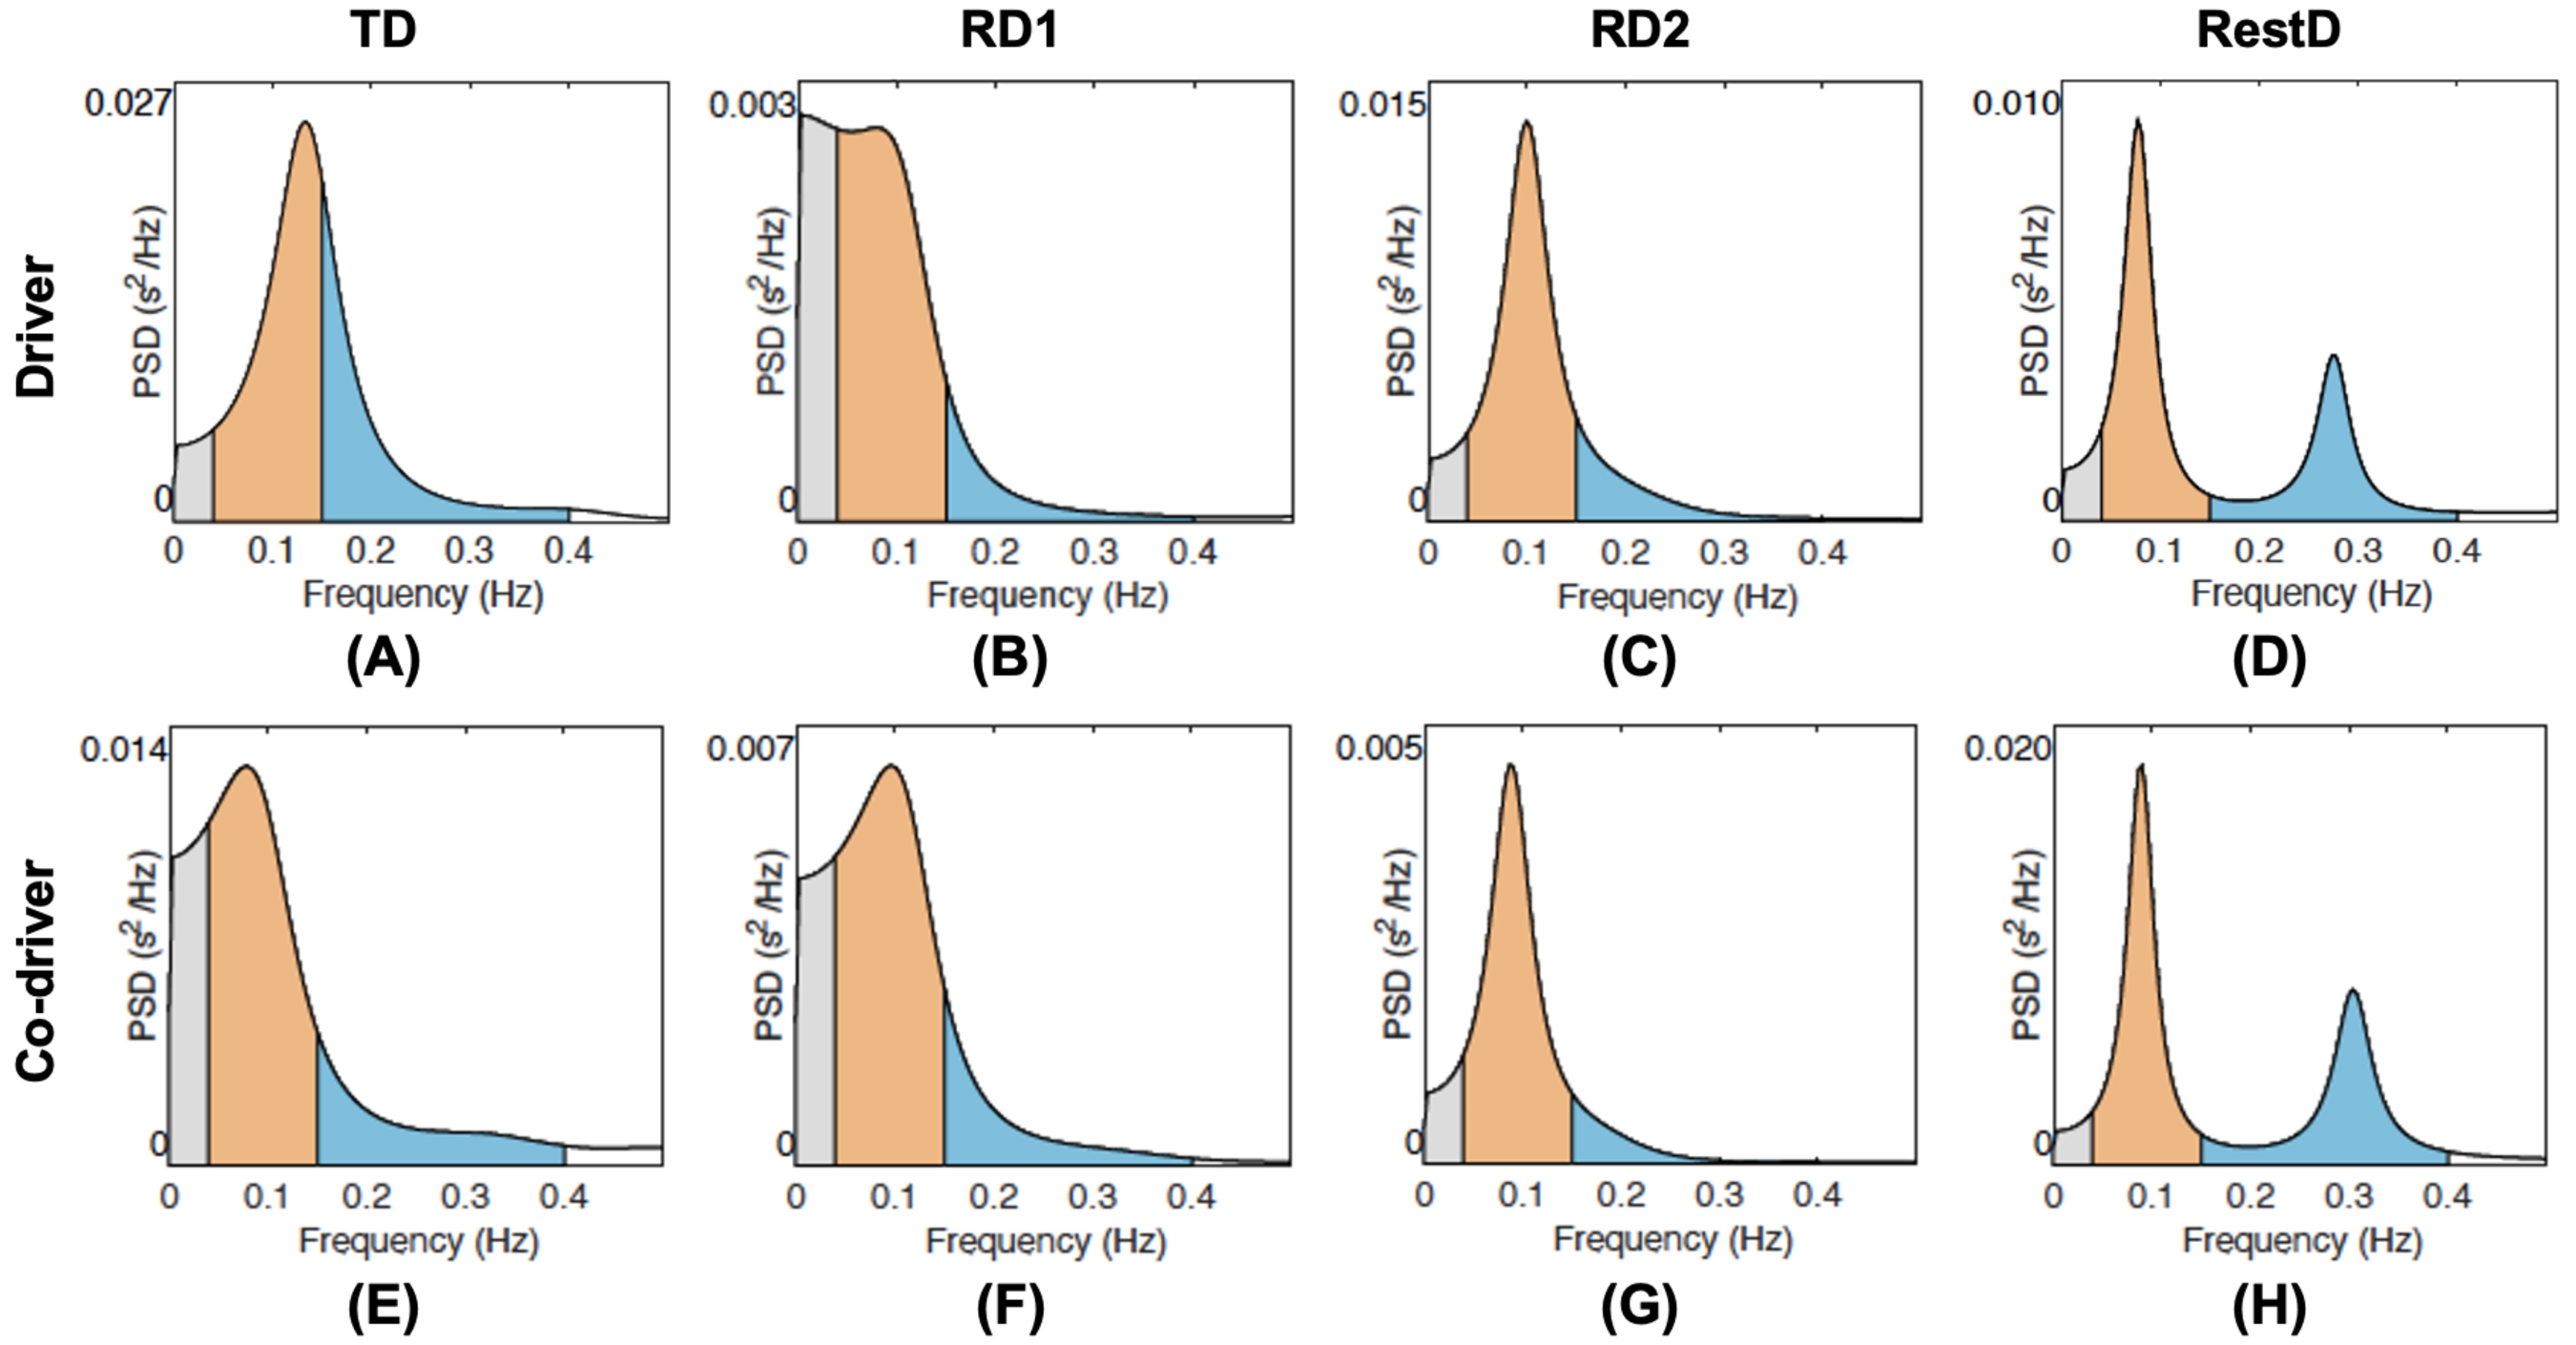
PSD graphs reporting the frequency-domain results from the 5-min rest recording during the four days of monitoring from driver (a, b, c, d) and co-pilot (e, f, g, h). The grey, orange and blue components of the graphs represent the VLF band, LF, and HF bands, respectively. TD: test day; RD1: race day 1; RD2: race day 2; RestD: rest day. PSD: power spectrum density; VLF: very low frequency; LF: low frequency; HF: high frequency.
Results showed the highest peaks in the HF band for both driver and co-pilot (indicating a vagal tone) during the rest day (Figure 3(a), (d), (e), and (h)). On the contrary, during the two days of race, the PSD showed the highest peaks in the LF bands, (Figure 3(b), (c), (f), and (g)) indicating a high sympathetic activity. Regarding the test day, LF and HF bands showed a more balanced aspect for both the driver and co-pilot (Figure 3(a) and (e), respectively).
Regarding the driver, the LF/HF was 1.72 (LF = 63.23, HF = 36.74) during the test day, 5.82 (LF = 85.32, HF = 14.67) and 4.3 (LF = 81.11, HF = 18.88) during the race days and 1.61 (LF = 61.65, HF = 38.31) in the rest day. The LF/HF for the co-pilot was 3.17 (LF = 75.99, HF = 23.97) during the test day, 3.91 (LF = 79.62, HF = 20.36) and 6.55 (LF = 86.76, HF = 13.24) during the two consecutive race days, and 1.35 (LF = 57.44, HF = 42.51) during the rest day.
Acute Recovery and Stress Scale
The ANOVA showed that ARSS recovery ratings were significantly different for the driver during the 4 days of measurements (Figure 4(a), P < 0.001). Tukey's post hoc test showed that the driver had significantly lower recovery scores during race day 2 compared to race day 1 (P < 0.01) and the test day (P < 0.001). Stress scores were statistically different as well, for the driver (Figure 4(b), P < 0.001). On the test day, the driver showed a lower level of stress compared to race day 2 (P < 0.001) and the rest day (P < 0.05). In addition, stress levels were higher during race day 2 compared to race day 1 (P < 0.05).
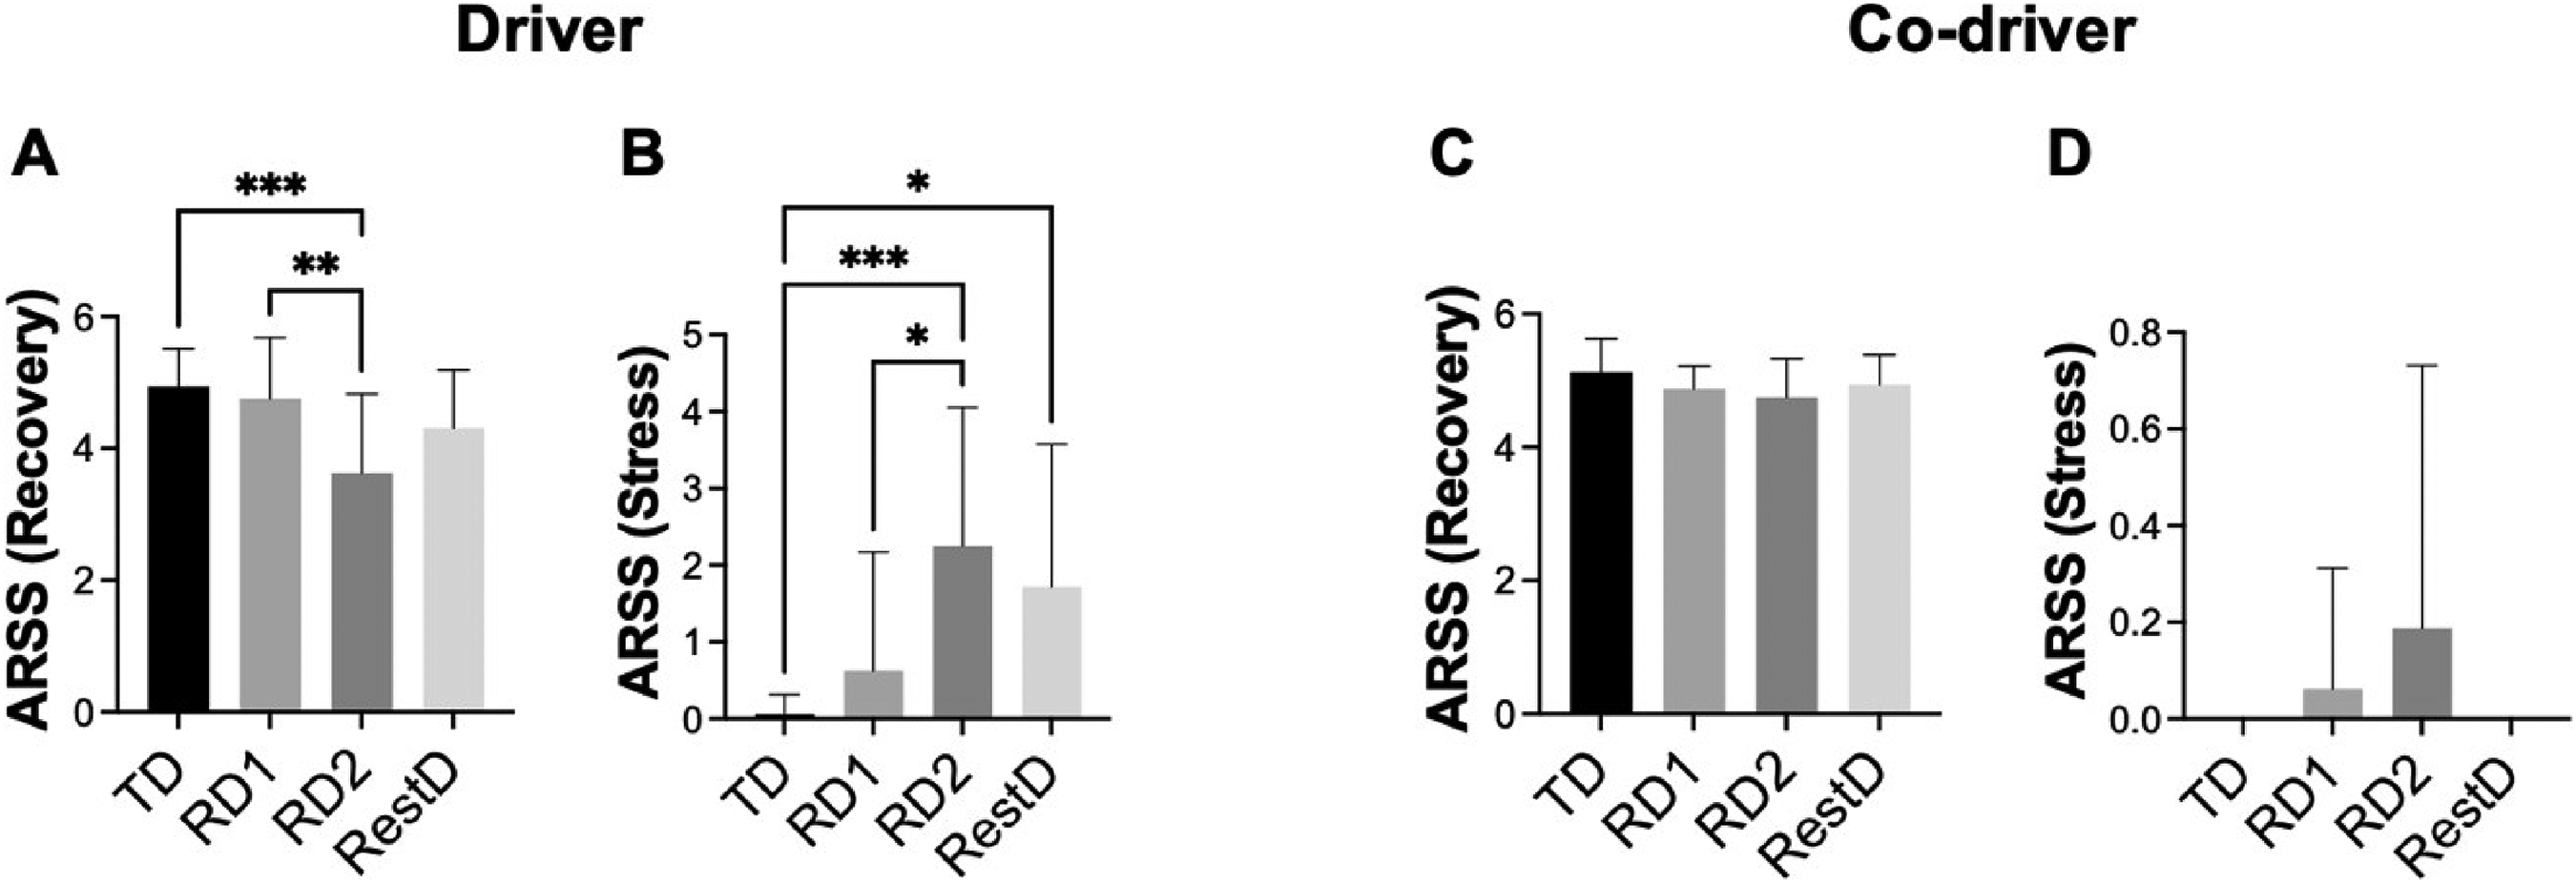
Acute Recovery and Stress Scale results. (a) Recovery scoring for the driver; (b) stress scoring for the driver; (c) recovery scoring for the co-pilot; (d) stress scoring for the co-pilot. Results are expressed as mean ± standard deviation. *P < 0.05; **P < 0.01; *P < 0.001.
On the other hand, the ANOVA did not show significant differences neither in the recovery (Figure 4(c)) nor in the stress ratings (Figure 4(d)), for the co-driver, although the trend was similar to that of the driver.
Discussion
The present investigation assessed, for the first time, the autonomic regulation, recovery and stress state of a driver and his co-driver in motorsport, to examine physiological and psychological demands before, during and after the competition period.
The main findings of the present study were: (a) Time-domain variables (i.e. mean RR intervals, SDNN, and RMSSD) showed a sharp decrease during the race days compared to test day and rest day, while the stress index showed an increase in both participants; (b) accordingly, nonlinear results (i.e. SD2/SD1) and frequency-domain data (i.e. LF/HF) were higher during the competition days; (c) ARSS showed significant difference in recovery and stress scores for the driver but not for the co-driver although HRV variables were similar between the two subjects.
It has been shown that racing drivers show increased heart rate, core body temperature, and oxygen consumption during the race compared to resting values.43,44 In this regard, the present study adds two important new parameters (i.e. daily HRV and subjective feelings of stress and recovery) to the motorsport athletes’ profile.
Recent studies demonstrate that daily measurement of HRV parameters is significantly correlated with athlete fitness. 41 In the present investigation, the autonomic responses of the driver and the co-driver were similar during the four days, but the driver had the highest stress index and lowest SDNN, and RMSSD during race day 1 while the co-driver had a similar response on race day 2. However, the subjective stress score measured by ARSS, highlighted that the driver had a significantly higher subjective stress on race day 2 compared to race day 1, while relatively low levels of stress were reported by the co-driver. It is well known that cognitive load can affect performance,45,46 thus probably the major responsibility for the driver during the race could lead to these differences in subjective stress feelings, which also remained higher on the day after the race. The ARSS recovery ratings for the driver were significantly decreased on race day 2, compared to race day 1 and the test day, probably due to the increase in stress. On the other hand, the co-driver showed low signs of stress on race day 2 only, as highlighted by the ARSS, and this was probably due to psychological factors. Also, both time-domain and frequency-domain, on the rest day seem to indicate that the co-driver had a faster recovery, perhaps due to a lower physical demand and stress in the days before and during the race compared to the driver.
In this regard, our results show the sensitivity of daily HRV analysis to record important changes that also mimicked the same trend of ARSS results. Previous work showed that accumulated physical and mental stress during training and competitions results in a transitory decrement in physical performance and impaired physical functions after competition.47,48 Thus, this type of monitoring may prove to be useful to check such a situation and possibly make a decision (e.g. adjusting training load) to avoid performance decrease.
It is well known that individualized monitoring, based on intraindividual differences is a key factor to optimize athletes’ skills and abilities, to adopt appropriate adjustments and to prevent overtraining.49,50 For this purpose, using both objective and subjective measurements of stress and recovery on a daily basis could be a good option rather than using only one of the two approaches.
In the present study, the Poincaré plots showed sharp modifications according to the different physiological states. Based on the shape of the Poincaré plot (i.e. the ellipse), it is easy to understand the relative involvement of the parasympathetic and sympathetic branches of the ANS.27,42 The results showed that the ellipses on the Poincaré plot shapes for both driver and co-driver had the widest aspect (reflecting a high parasympathetic influence) during the rest day. Specifically, the ellipses showed a more “rounded” shape because of the high SD1. Of note, the width of a Poincaré plot (SD1) has been described as a direct measure of parasympathetic activity, 29 with a wider SD1 indicating higher parasympathetic tone. On the other hand, the sympathovagal balance is correlated to the ‘length’ of the Poincaré plot (SD2). 51 During the two days of race, the ellipses showed the narrowest appearance, being elongated along the line of identity, indicating a high sympathetic activity.
The analysis of the PSD highlighted the different involvement of the parasympathetic and sympathetic branches during the four days of recording. 52 Indeed, the neural regulation of HRV is orchestrated by the interplay of the sympathetic and vagal systems. This interaction is easily explored by assessing HRV in the frequency domain with spectral analysis. 53 In this study, for both the driver and co-pilot, the HF band showed the highest peaks during the rest day. Conversely, during the two days of the race, the LF bands reported the highest peaks in the PSD graph, indicating a high sympathetic outflow. Interestingly, LF and HF during the test day showed a more balanced behaviour for both driver and co-pilot. Importantly, these results corroborate previous findings demonstrating the main role of sympathetic nervous system output and the hormonal influences derived from the anxiety, anticipation, and competitive nature of motorsport. 54
Finally, this work put the accent on an integrated approach for monitoring health and performance status in rally athletes, which includes objective physiological (HRV) and subjective psychobiological (ARSS) measurements. However, the present manuscript represents a pilot investigation, thus overall analysis and statistical results should be considered with caution keeping in mind that future studies related to this topic should be performed. In addition, other measures such as breathing rate, skin temperature, core temperature, and blood glucose should be implemented in studies involving such a population since they could be important to classify physiological responses in racing drivers. 55 Importantly, a higher sample size is needed to investigate the systematic efficacy of this type of analysis in detecting stress and recovery state in elite rally athletes. Also, performing a longer monitoring and recording data for more days after an event would be of value.
Conclusions
This study, although preliminary, suggests important practical indications: First, HRV monitoring and subjective psychometric scales may be used in combination, to assess the autonomic and stress status of rally drivers and co-drivers on a daily basis, and to adopt individualized strategies to improve recovery and readiness for the competition. Second, using qualitative methods (i.e. Poincaré plots and PSD graph) along with quantitative data could be a helpful tool to easily visualize HRV control in practical settings. These results confirm how the ANS balance could be informative of physiological and psychological conditions and that this information is closely related to subjective feelings of stress and recovery. Also, these preliminary data suggest how the two different roles (i.e. driver vs co-driver) could also impact differently on HRV regulation and stress. Nevertheless, further studies are needed to confirm the present results and to implement these methods in daily practice, including wider samples and checking their sensitivity in response to training plan modifications.
Footnotes
Author contributions
Conceptualization was done by ADC, CP, LSA, SC, GG and PI. Methodology was done by ADC, CP and PI. Software was handled by ADC, CP and PI. Validation was done by ADC, CP, LSA, GG and PI. Formal analysis was carried out by ADC, CP and PI. Investigation was done by ADC, CP, and PI. Resources were handled by ADC, CP and PI. Data curation was done by ADC, CP and PI. Writing—original draft preparation was done by ADC, CP, SC, GG and PI. Writing—review and editing was done by ADC, CP, LSA and PI. Visualization was done by LSA and PI. Supervision was carried out by LSA, GG and PI. Project administration was done by PI. All authors have read and agreed to the published version of the manuscript.
Data availability statement
All data are contained within the present article.
Declaration of conflicting interests
The author(s) declared no potential conflicts of interest with respect to the research, authorship, and/or publication of this article.
Funding
The author(s) disclosed receipt of the following financial support for the research, authorship, and/or publication of this article: This research was funded by ex 60%—Italian Ministry of University and Research.
Institutional review board statement
The study was conducted in accordance with the Declaration of Helsinki.
Informed consent
Because of the a posteriori nature of the analyses without interfering with the training routine, a signature of the informed consent form was not required.
Author biographies
Andrea Di Credico holds a PhD in Translational medicine. In his research work, he integrates anatomy, integrative physiology and molecular biology for the study of different human systems (cardiovascular, muscular, nervous).
Cristian Petri is a PhD student in Physical Activity and Sport Science at the Universidad Pablo de Olavide in Sevilla. His research focuses on integrating physical activity, health, performance, and human nutrition.
Stefania Cataldi is a professor of Sport and Exercise Sciences. Her research focuses on physical fitness, psychophysical wellbeing, and adapted physical activity.
Gianpiero Greco holds a PhD in Neuroscience and Translational Medicine. He is professor of Sport Sciences and Research Methodology and his research focuses on physical fitness, physical activity, body composition, psychophysical health, adapted physical exercise, and sports performance.
Luis Suarez Arrones, PhD is professor at the Pablo de Olavide University and specialist in training and testing in soccer. His research has focused on training, physiology and assessment in team sports.
Pascal Izzicupo, PhD, is a professor in Sport Sciences. His research focuses on kinanthropometry, body composition, physical fitness, and physical activity, encompassing both sports and physical activity for health.