
Abstract
Foggy images affect image analysis and measurement because of their low definition and blurred details. Despite numerous studies on haze in natural images in hazy environments, the recovery effect is not ideal for processing hazy images in sky areas. A dark channel priori technique for processing haze images with sky areas where atmospheric light values are misestimated and halo artefacts are produced, as well as an improved dark channel priori single-image defogging technique based on image segmentation and joint filtering, are proposed. First, an estimation method of the atmospheric illumination value using image segmentation is proposed to obtain the atmospheric illumination value. The probability density distribution function of the haze-grey image was constructed during image segmentation. The probability density distribution function of the grey image value, the K-means clustering technique, and the method for estimating atmospheric illumination values are combined to improve image segmentation techniques and achieve the segmentation of sky and non-sky areas in hazy images. Based on the segmentation threshold, the number of pixels in the sky and non-sky areas, as well as the normalisation results, were counted to calculate the atmospheric illumination values. Second, to address the halo artefact phenomenon, a method for optimising the image transmittance map using joint filtering is proposed. The image transmittance map was optimised by combining fast-guided filtering and weighted least-squares filtering to retain the edge information and smooth the gradient change of the internal region. Finally, gamma correction and automatic level optimisation are used to improve the brightness and contrast of the defogged images. The experimental results show that the proposed technique can effectively achieve sky segmentation. Compared to the traditional dark-channel prior technique, the proposed technique suppress halo artefacts and improve image detail recovery. Compared to other techniques, the proposed technique exhibited excellent performance in subjective and objective evaluations.
Keywords
Introduction
Image quality affects the analysis and recognition of subsequent images as an essential means of obtaining visual information. 1 During bad weather, fog in the atmosphere reduces visibility, resulting in colour distortion of the captured image and severe loss of image information, leading to difficulties in solving problems in the field of computer vision.
Image-defogging techniques have been widely used in recent years to obtain high-quality images and ensure the accuracy of computer vision techniques. An effective image-defogging technique can improve image information and contrast, as well as solve the problem of image colour distortion. The visual effects of foggy images and the corresponding non-foggy images are shown in Figure 1. Image defogging techniques primarily include enhancement-, restoration-, and deep-learning-based defogging approaches.
2
Enhancement-Based Defogging Approaches. Defogging methods based on image enhancement use mathematical methods to enhance the image's contrast, colour, and other features, as well as improve the image's information entropy to highlight helpful information, such as scenery or targets in the image. These include histogram equalisation,
3
retinex theory,
4
homomorphic filtering,
5
and wavelet-based methods.
6
However, this method does not completely remove fog from fogged images; it only enhances the clarity, contrast, and other indicators and may lose some of the information in the image. Restoration-Based Defogging Approach. Restoration-based defogging approvals, based on the physical process of degradation of foggy images collected under hazy meteorological conditions, reverse the degradation process of images by building a degradation model and compensating for the distortion of degraded images according to the optimal estimation of parameters to reduce information loss, thereby improving image quality. These include methods based on the depth relationship,
7
the characteristics of atmospheric light polarisation
8
and prior knowledge.
9
However, such methods produce colour deviations with abrupt changes in the depths of field and transition areas. Deep Learning-Based Defogging Approaches. Cai et al. proposed the DehazeNet network, which used a convolutional neural network (CNN) to learn the mapping relationship between foggy images and medium transmission images, and subsequently used an atmospheric scattering model to restore images.
10
Because of the limitation of the training data, that is, only considering the situation in which the medium transmission diagram in the local area is the same, it cannot reflect the characteristics of the medium transmission diagram of the actual foggy image, which affects the network's learning of the global image characteristics. Ren et al. used a multiscale CNN (MSCNN) to learn the mapping relationship between foggy images and medium-transmission maps.
11
First, they trained a coarse, medium transmission map of foggy images, then refined the coarse, medium transmission map using an exemplary, medium transmission network, and finally used the atmospheric scattering model to restore clear fogless images. However, because the network uses pooling and up-sampling to maintain the image size, it limits the range of the neurones’ receptive fields to the input image and the learning of the global information of the network image.

Visual effects of fogged images and corresponding fogless images.
He et al. identified that at least one colour channel of some pixels in a non-sky area had a very low pixel value through the observation and statistics of a large number of outdoor fog-free images, 9 indicating that fog made the dark pixels of degraded images bright. Based on this prior estimation of the media transmission map, fog-free images were restored using an atmospheric scattering model. This method was ineffective when dealing with sky regions and objects with high light intensity, such as snowy mountains and white clouds. Owing to the complexity of this technique, it performed slowly. To improve the efficiency, Tarel et al. used median filtering, 3 Yu et al. used joint bilateral filters, 12 Gibson et al. used standard median filters, 13 and He et al. used guided filtering to improve the technique. 14 Zhu et al. studied the fog-free areas of foggy images and identified that prior to colour attenuation, the scene depth was proportional to the difference between brightness and saturation. 15 Based on this knowledge, a regression model was constructed to estimate the scene depth for image defogging. When this technique processed images with a large number of white areas, the depth of field was misestimated, which affected the defogging. Khmag et al. proposed a novel single-image haze-removal technique based on edge and fine texture preservation, which used the mean vector L2-norm, which is the core of window sampling, to estimate the transmission map, which can achieve better visual quality from the hazy image. 16 Wang et al. proposed a hybrid method that combined fuzzy theory and weighted estimation to remove haze from an image. 17 This method automatically identified possible atmospheric light and removed halo artefacts around sharp corner edges. However, atmospheric light estimation is biased, and the processing of distant scenes is not sufficiently transparent. Khmag et al. proposed clustering-based natural image denoising using a dictionary learning technique in the wavelet domain to achieve image denoising, and the use of a second-generation wavelet transform in the proposed technique promoted sparsity and multiresolution representations. 18
In summary, image-defogging techniques suffer from colour and edge distortion problems. A dark channel priori technique for processing haze images containing sky areas where atmospheric light values are misestimated and halo artefacts are produced, and an improved dark channel priori single-image defogging technique using image segmentation and joint filtering are proposed. In this study, an estimation method for the atmospheric illumination value using image segmentation was proposed to accurately obtain the atmospheric illumination value, and a method for optimising the image transmittance map using joint filtering was proposed to solve the halo artefact phenomenon. In addition, the defogging results are further enhanced using gamma correction and an automatic level optimisation technique. The major contributions of this study are as follows:
An estimation method of atmospheric illumination value using image segmentation is proposed to obtain atmospheric illumination value. This study combines the probability density distribution function of the grey image value, the K-means clustering technique, and a method for estimating atmospheric illumination values to improve image segmentation techniques. The number of pixels in the sky and non-sky areas and the normalisation result are counted based on the segmentation threshold, atmospheric light value estimation method using the number of pixel points is proposed to achieve atmospheric light value. A method for optimising the image transmittance map using joint filtering was proposed to solve the halo artefact phenomenon. A transmission map was obtained by combining fast guide and weighted least-squares filtering. Minimum preserving down-sampling was applied in fast guide filtering to increase the computational efficiency of the proposed technique, and weighted least squares filtering was used to preserve image edges and suppress halo artefacts. Gamma correction and automatic level optimisation are applied to maintain the uniform brightness in the de-fogging results.
The remainder of this paper is organised as follows. Section 2 introduces methods relevant to the defogging technique. Section 3 introduces the proposed technique and implementation process. Section 4 analyses the experimental results. Finally, the conclusions are presented in Section 5.
Materials and methods
Atmospheric scattering model
Scattering of particles in the atmosphere is the leading cause of haze. Whether observed with the human eye or from images captured, the contrast and visual field of foggy scenes are always reduced. The atmospheric scattering model explains the imaging process of fog images and various elements of fog images.
19
The atmospheric scattering model is illustrated in Figure 2. The model believes that the main reasons for image degradation are as follows. First, the brightness and contrast of the target imaging results are reduced owing to the attenuation of the target reflected light under the absorption and scattering of suspended particles. Second, ambient light, such as sunlight, is scattered by the scattering medium in the atmosphere to form the background light. Typically, the intensity of this part of the background light is greater than that of the target light, causing the imaging results of the detection system to be ambiguous. The model is expressed as follows:


Atmospheric scattering model diagram.
Under uniform atmospheric conditions, the transfer function is expressed as follows:

Dark channel prior
He et al. analysed several clear outdoor images and obtained statistical rules for fogless images.
9
The statistical rule indicates that for most clear fog-free images without a sky area, the pixel value intensity of at least one colour channel is a subfield and close to 0. A prior theory of dark channels was proposed based on the atmospheric scattering model, which was used to restore foggy images to image scenes without haze. The prior theory of dark primary colours can be expressed as shown in (3).

Assuming that the atmospheric light value A is known and combining Equations (1) and (3), the transfer function t(x) can be expressed as follows:

Soft matting was applied to optimise the transmissivity in He's method to solve the image-blocking effect. Finally, the expression J(x) is given by (5) as follows:

Gamma correction
Gamma-rays are essential features of digital imaging systems. It defines the relationship between the pixel value and actual brightness.
20
The Gamma function is widely used in image vision. Its specific function is expressed in (6) as follows:


Influence of different λ values on gamma function image.
It can be observed from Figure 3 that with the decrease of parameter λ, the grey value of the image gradually increases. When 0 < λ < 1, the image pixel value increases, and when λ > 1, the image pixel value decreases. Therefore, to obtain a higher pixel grey value, we must control the value of parameter λ at [0,1].
Proposed methodology
Disadvantages of dark channel prior technique
The dark-channel prior technique is a breakthrough in the field of image defogging. The dark channel prior technique has a simple principle, good restoration effect, and wide application scenarios in the process of defogging single natural images. As shown in Figure 4(a), image details are restored, and image clarity is improved after defogging using the dark channel prior technique.

Effects of the dark channel prior technique on foggy images in different situations.
Although the dark channel prior technique has wide application scenarios in the process of defogging single natural images, it has limitations, particularly for processing foggy sky images containing sky areas, sky colour distortion, and block effects that occur when the image containing the sky area is defogged. The main disadvantages of this method are as follows:
In the image transmittance map optimisation process, the dark channel prior technique assumes that the transmittance in the filtering window remains unchanged, and the soft method is used to optimise the image transmittance map. However, the transmissivity of the image edge region has an evident mutation, and the defogging image optimised by the softening method exhibits evident artefacts in the edge area. As shown in Figure. 4(b), the image after fog removal produces halo artefacts with an abrupt change in the depth of the field. In the dark channel prior technique, the pixel value corresponding to the first 0.1% of the pixel points in the dark channel is considered as the atmospheric illumination value in the estimation process of atmospheric illumination value. The atmospheric illumination value was estimated when processing the hazy image in the sky region, resulting in different degrees of distortion and blocking effects in the sky area of the image after fog removal. As shown in Figures 4(c) and 4(d), the image after fog removal appears distorted and has a blocking effect in the sky region, whereas the image after fog removal has a lower brightness.
An improved dark channel a priori single-image defogging technique using image segmentation and joint filtering is proposed to estimate the wrong atmospheric light value and produce halo artefacts when processing a hazy image containing the sky area. Figure 5 shows the specific structure of the proposed technique, the dark channel prior technique is improved from the estimation of atmospheric illumination value and transmission optimisation. In the aspect of atmospheric illumination value estimation, an estimation method of atmospheric illumination value using image segmentation is proposed to obtain atmospheric illumination value, combining the probability density distribution function of the grey image value, the K-means clustering technique, and a method for estimating atmospheric illumination values to improve image segmentation techniques. To suppress the halo artefacts, a method for optimising the image transmittance map based on joint filtering is proposed. The image transmittance map was optimised by combining fast-guided filtering and weighted least-squares filtering to retain the edge information of the image and smooth the gradient change of the internal region. Finally, gamma correction and automatic level optimisation are used to improve the brightness and contrast of the defogged images.

The specific structure of the proposed technique.
Calculate atmospheric light value based on image segmentation
An estimation method for the atmospheric illumination value using image segmentation is proposed to improve the traditional threshold segmentation requiring multiple attempts. The threshold acquisition process is shown in Figure 6. The image is divided into sky and no-sky areas, and an atmospheric light value estimation method using the number of pixel points is proposed to obtain the atmospheric light value.

Estimation process of atmospheric illumination value.
The K-means clustering method is a partition-based clustering technique. 21 Generally, the Euclidean distance is used as an indicator to measure the similarity between sample data; the greater the similarity, the smaller the distance. The K-means clustering technique typically must determine the initial clustering number K and constantly update the location of the cluster centre according to the similarity between the data object and cluster centre. The image segmentation effect of the K values of the different clustering centres is shown in Figure 7.
Comparison of different K values. (a) Haze image, (b) binarized image when K < 5, (c) binarized image when K = 5, (d) binarized image when K > 5.
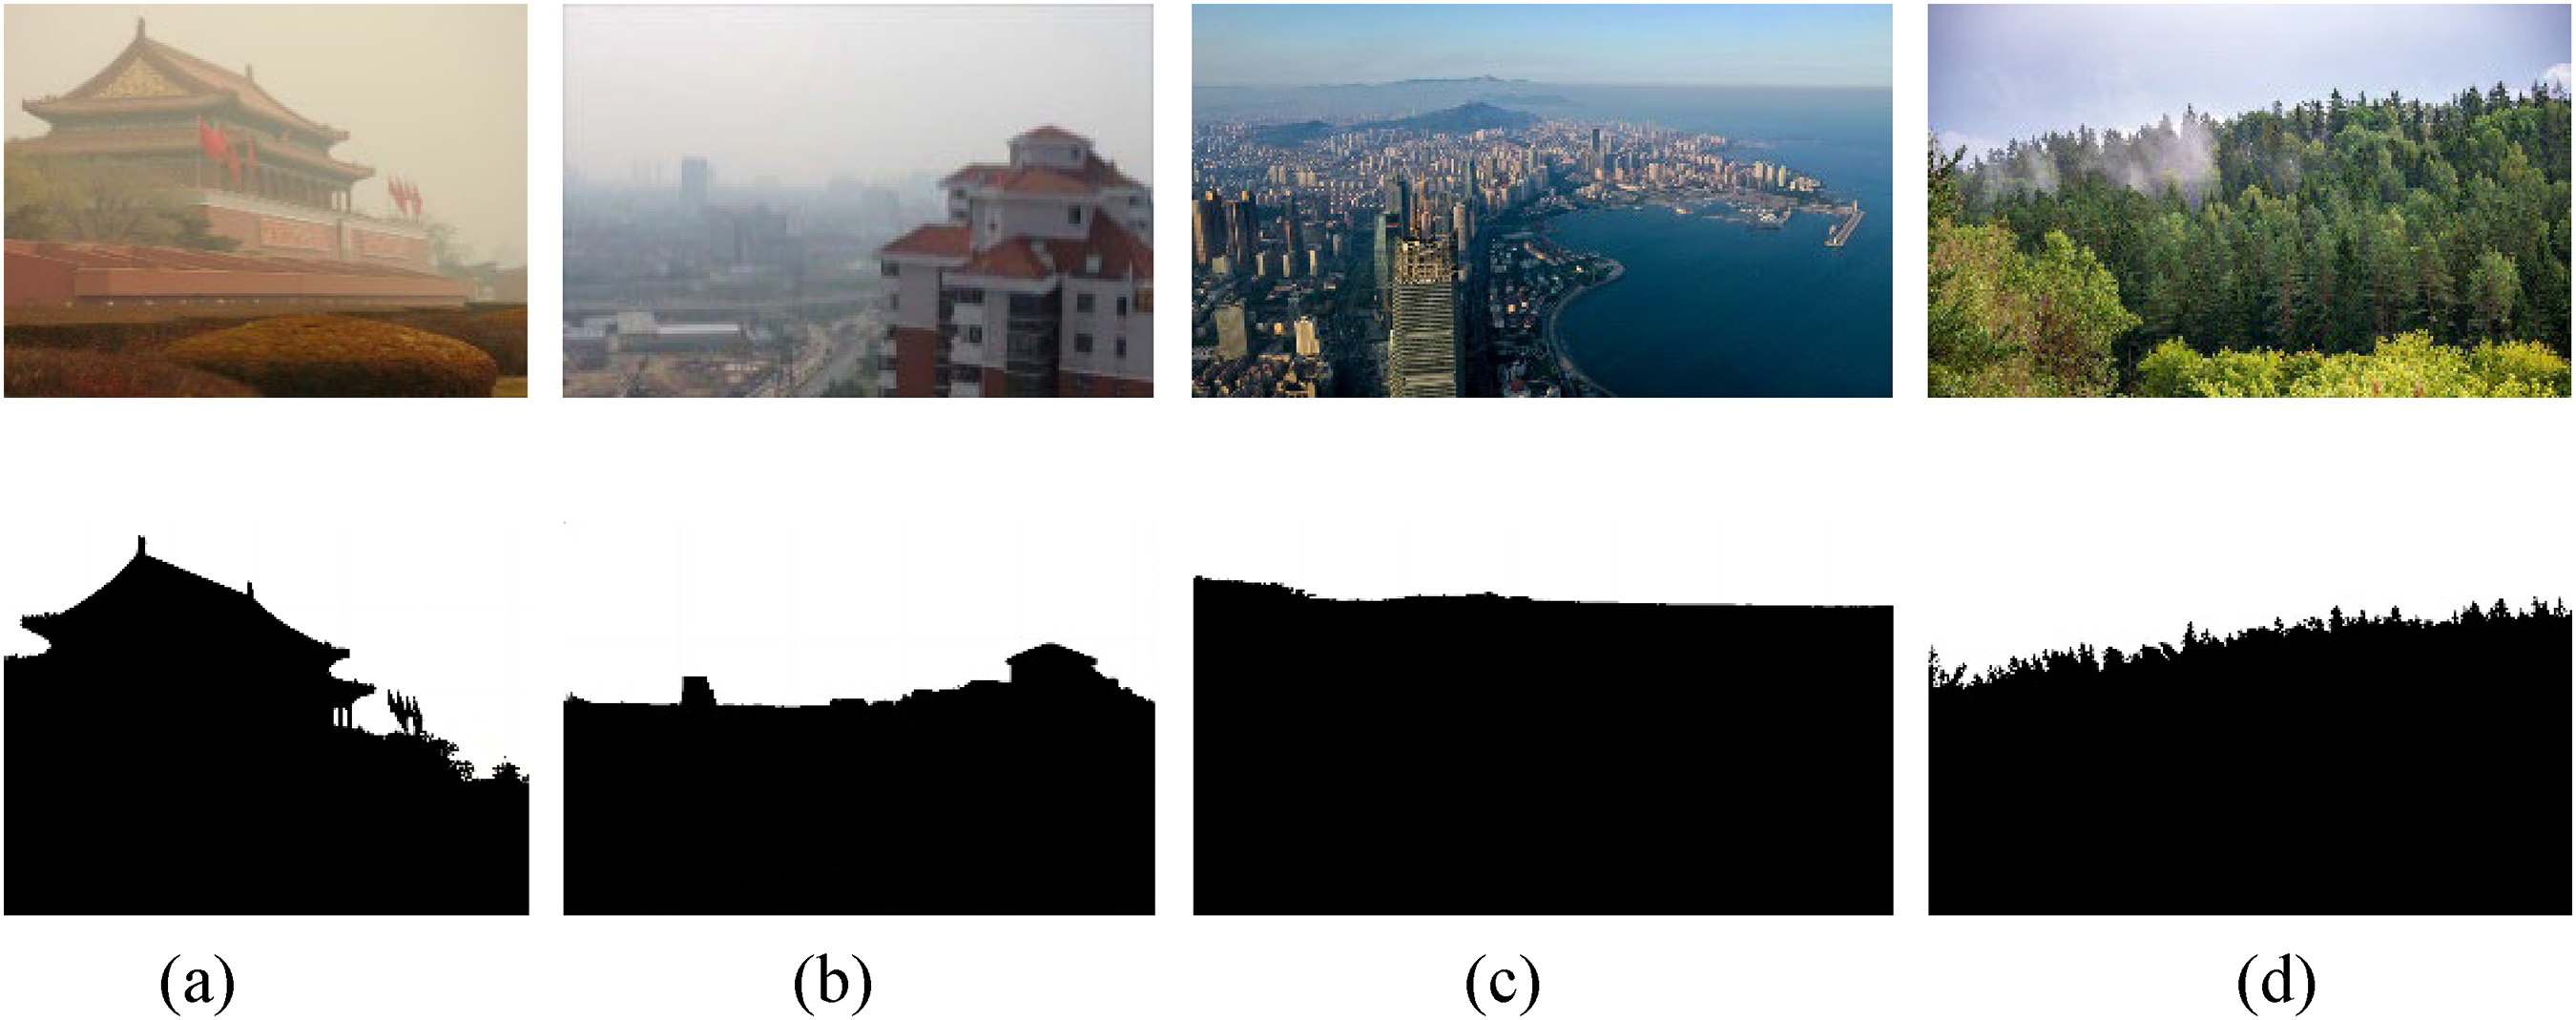
Although a good segmentation effect was proven in several experiments when the number of cluster centres was K = 5, the segmentation remained unsatisfactory when dealing with haze concentrated in the transition area at the edge of the image. The sky area of the image was segmented incorrectly because of the similar colour characteristics of the sky and fog areas, as shown in Figure 8. In Figures 8(a) and 8(b), the fog area was incorrectly divided into sky areas.
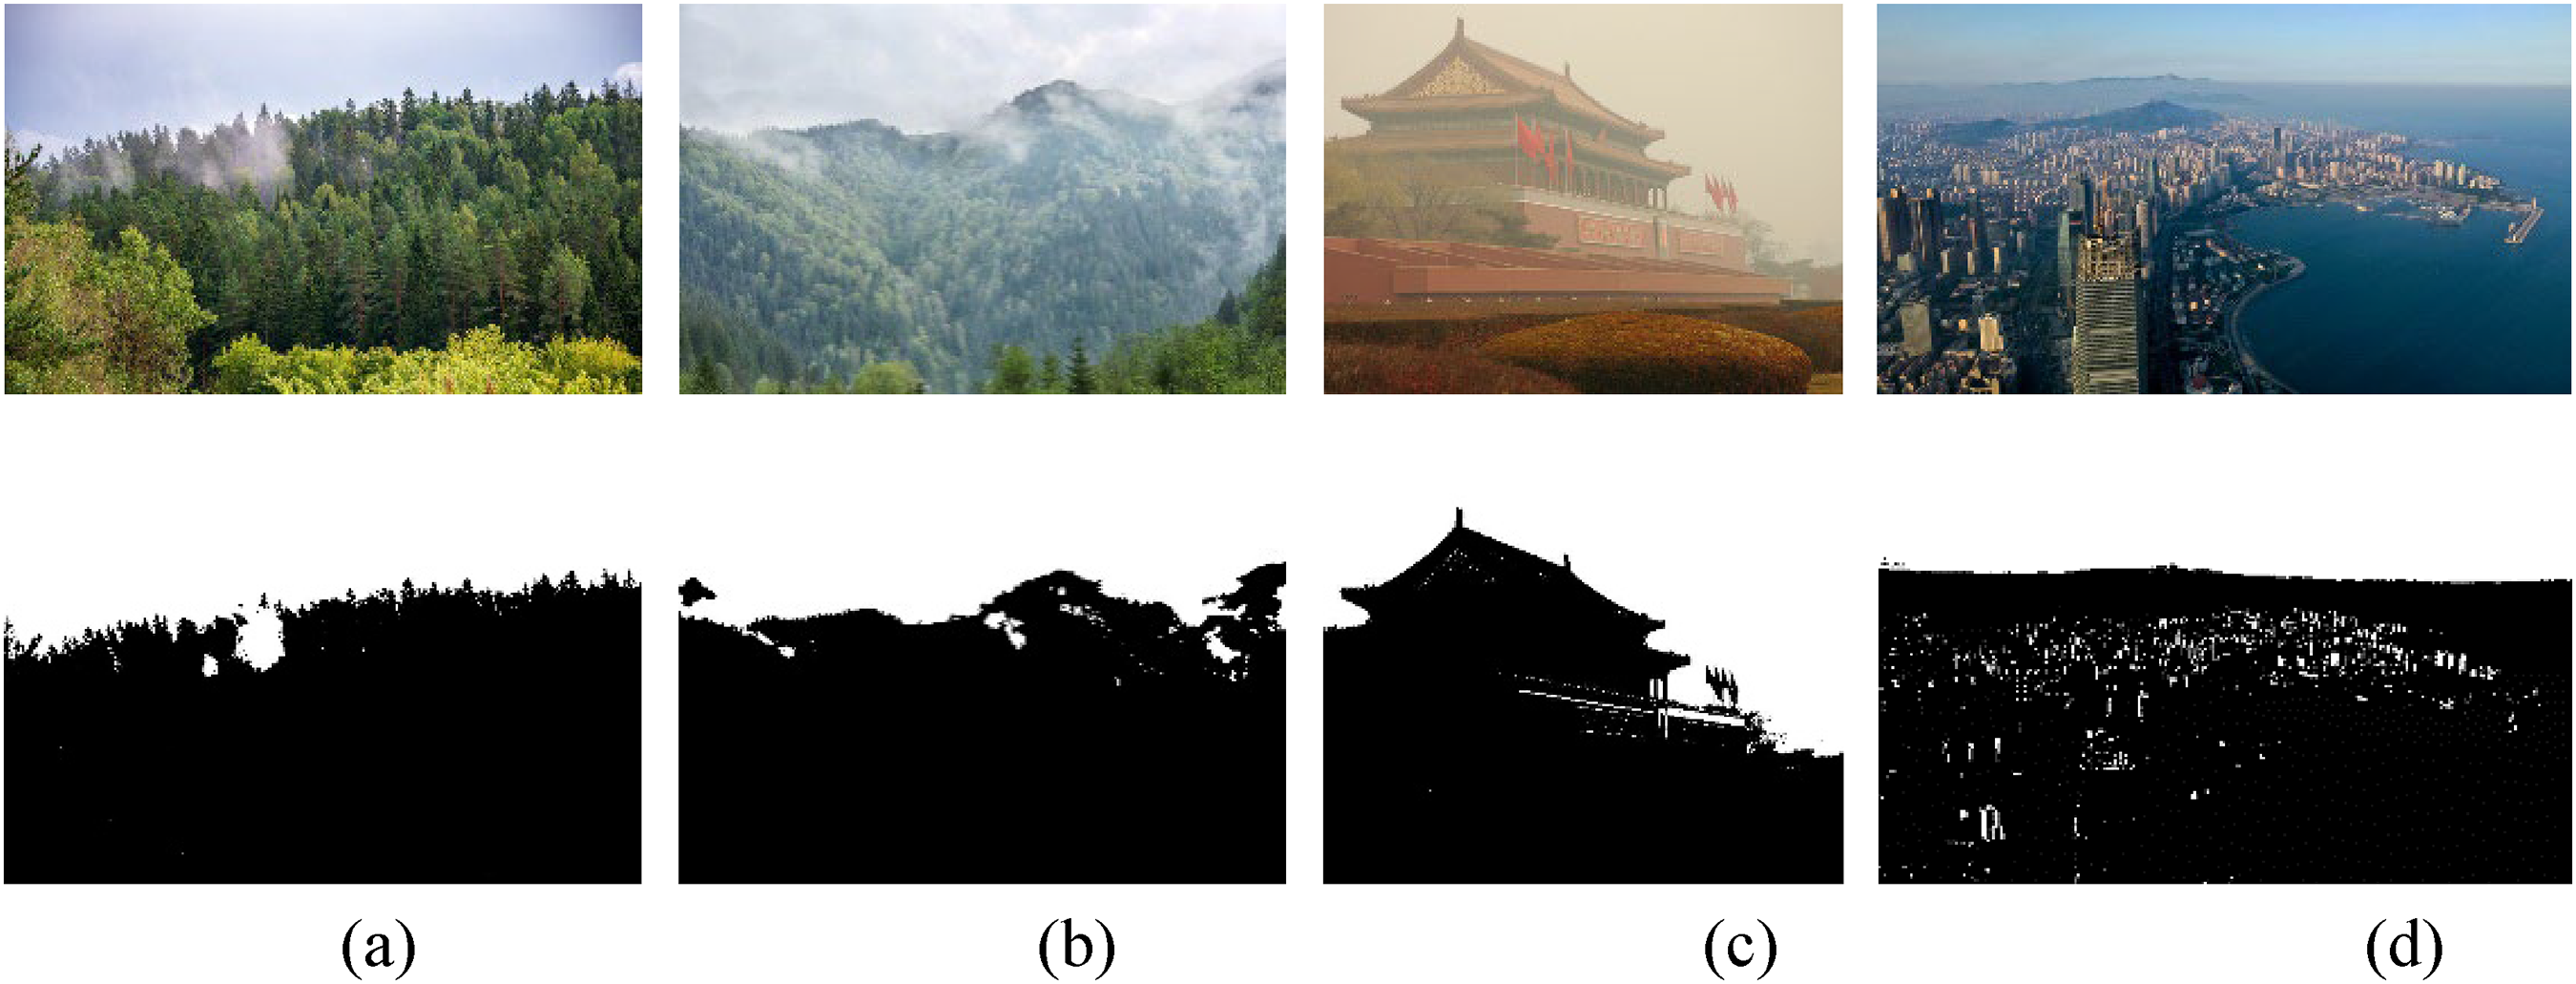
Clustering effect of image when K = 5. (a) Forest, (b) remote mountains, (c) Tiananmen, and (d) seascape.
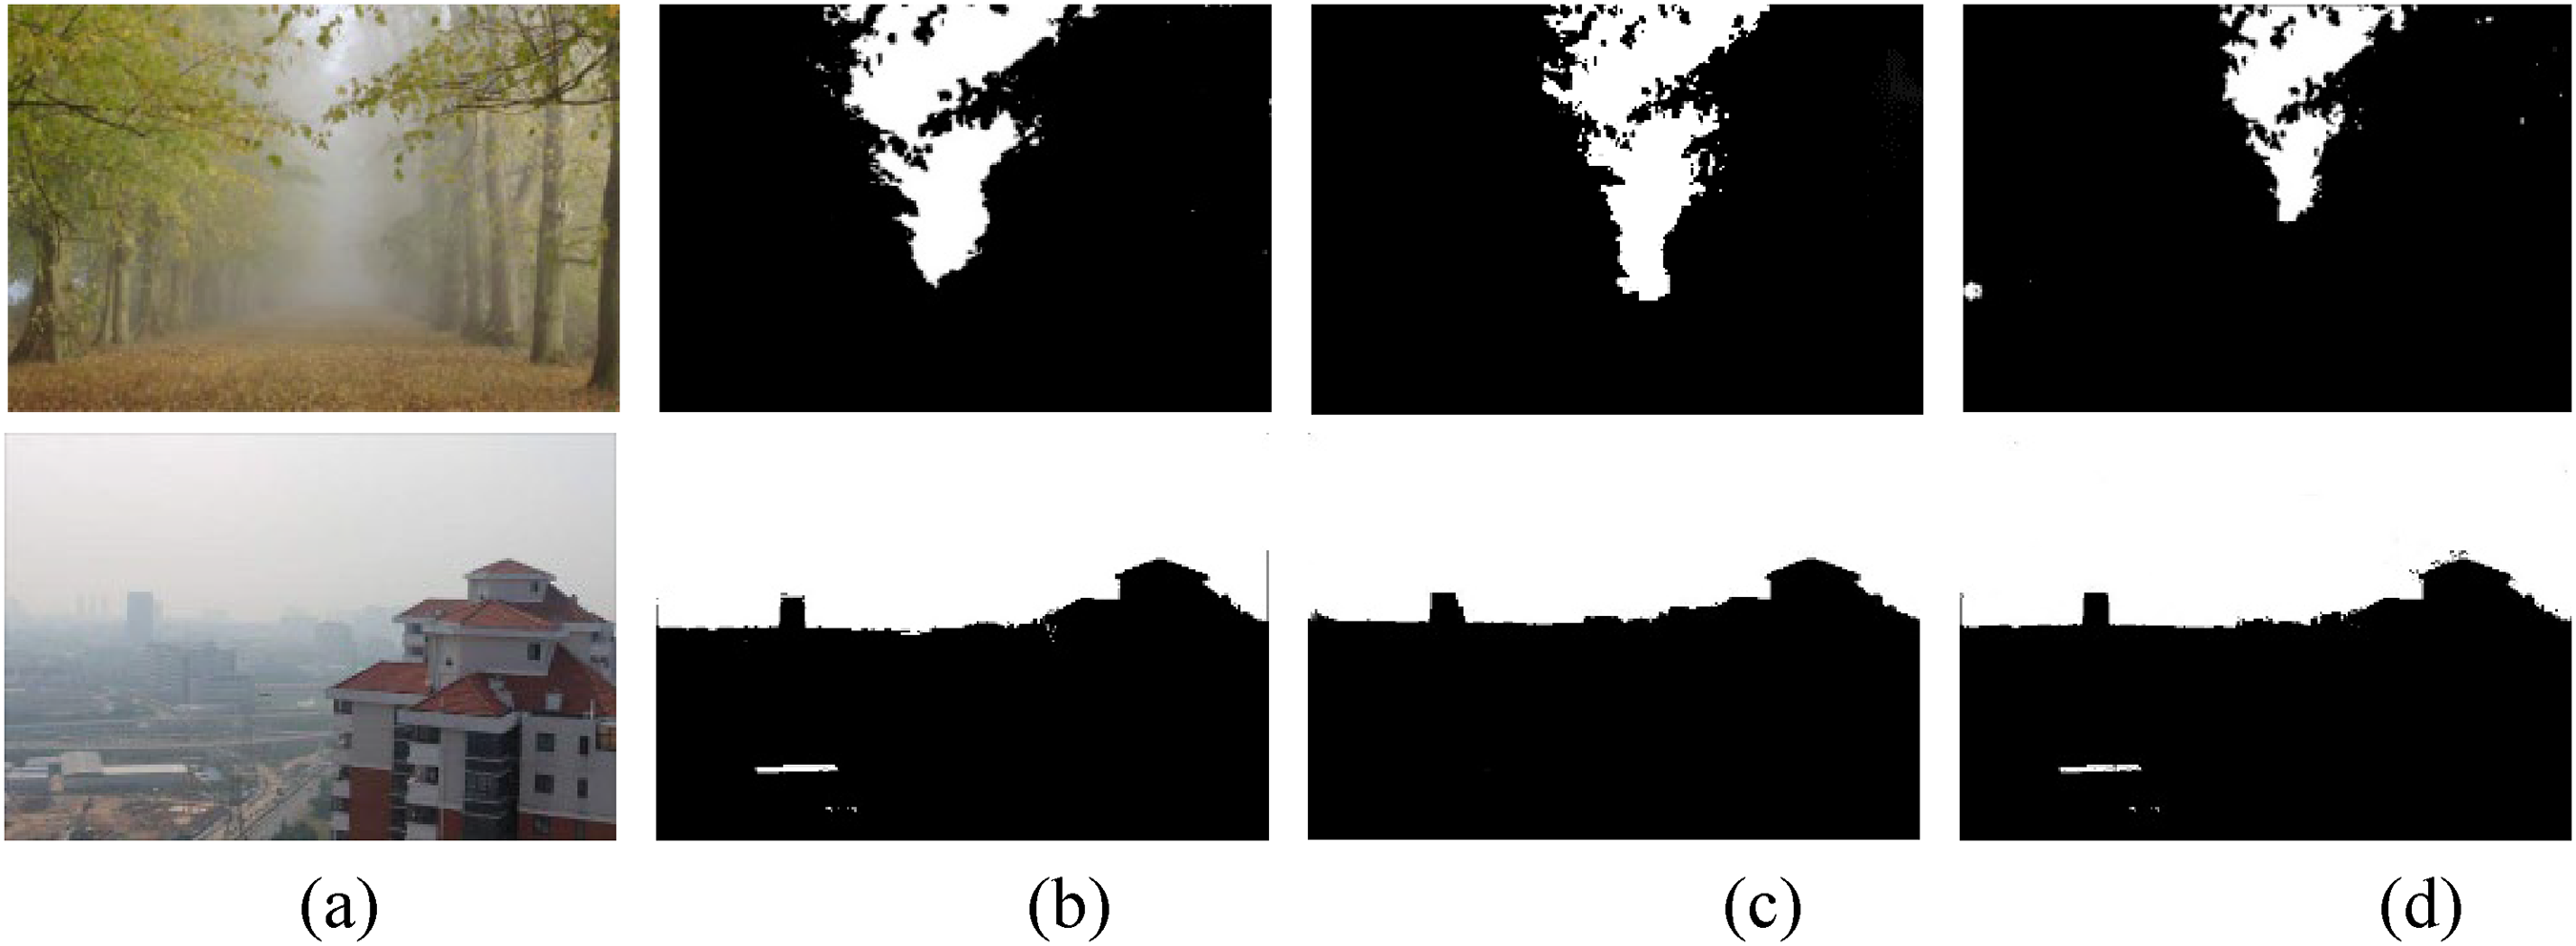
The segmented image was masked and bitwise operations were performed on the image to obtain the segmented sky and no-sky areas when the cluster centre K = 5. The segmentation effect of the sky and no-sky areas of the image after clustering when the centre of clustering was K = 5 is shown in Figure 9. The minimum pixel value around the segmentation line of the grey image in the sky area was used as the initial segmentation threshold based on the segmentation effect, and the initial segmentation threshold was denoted as T.
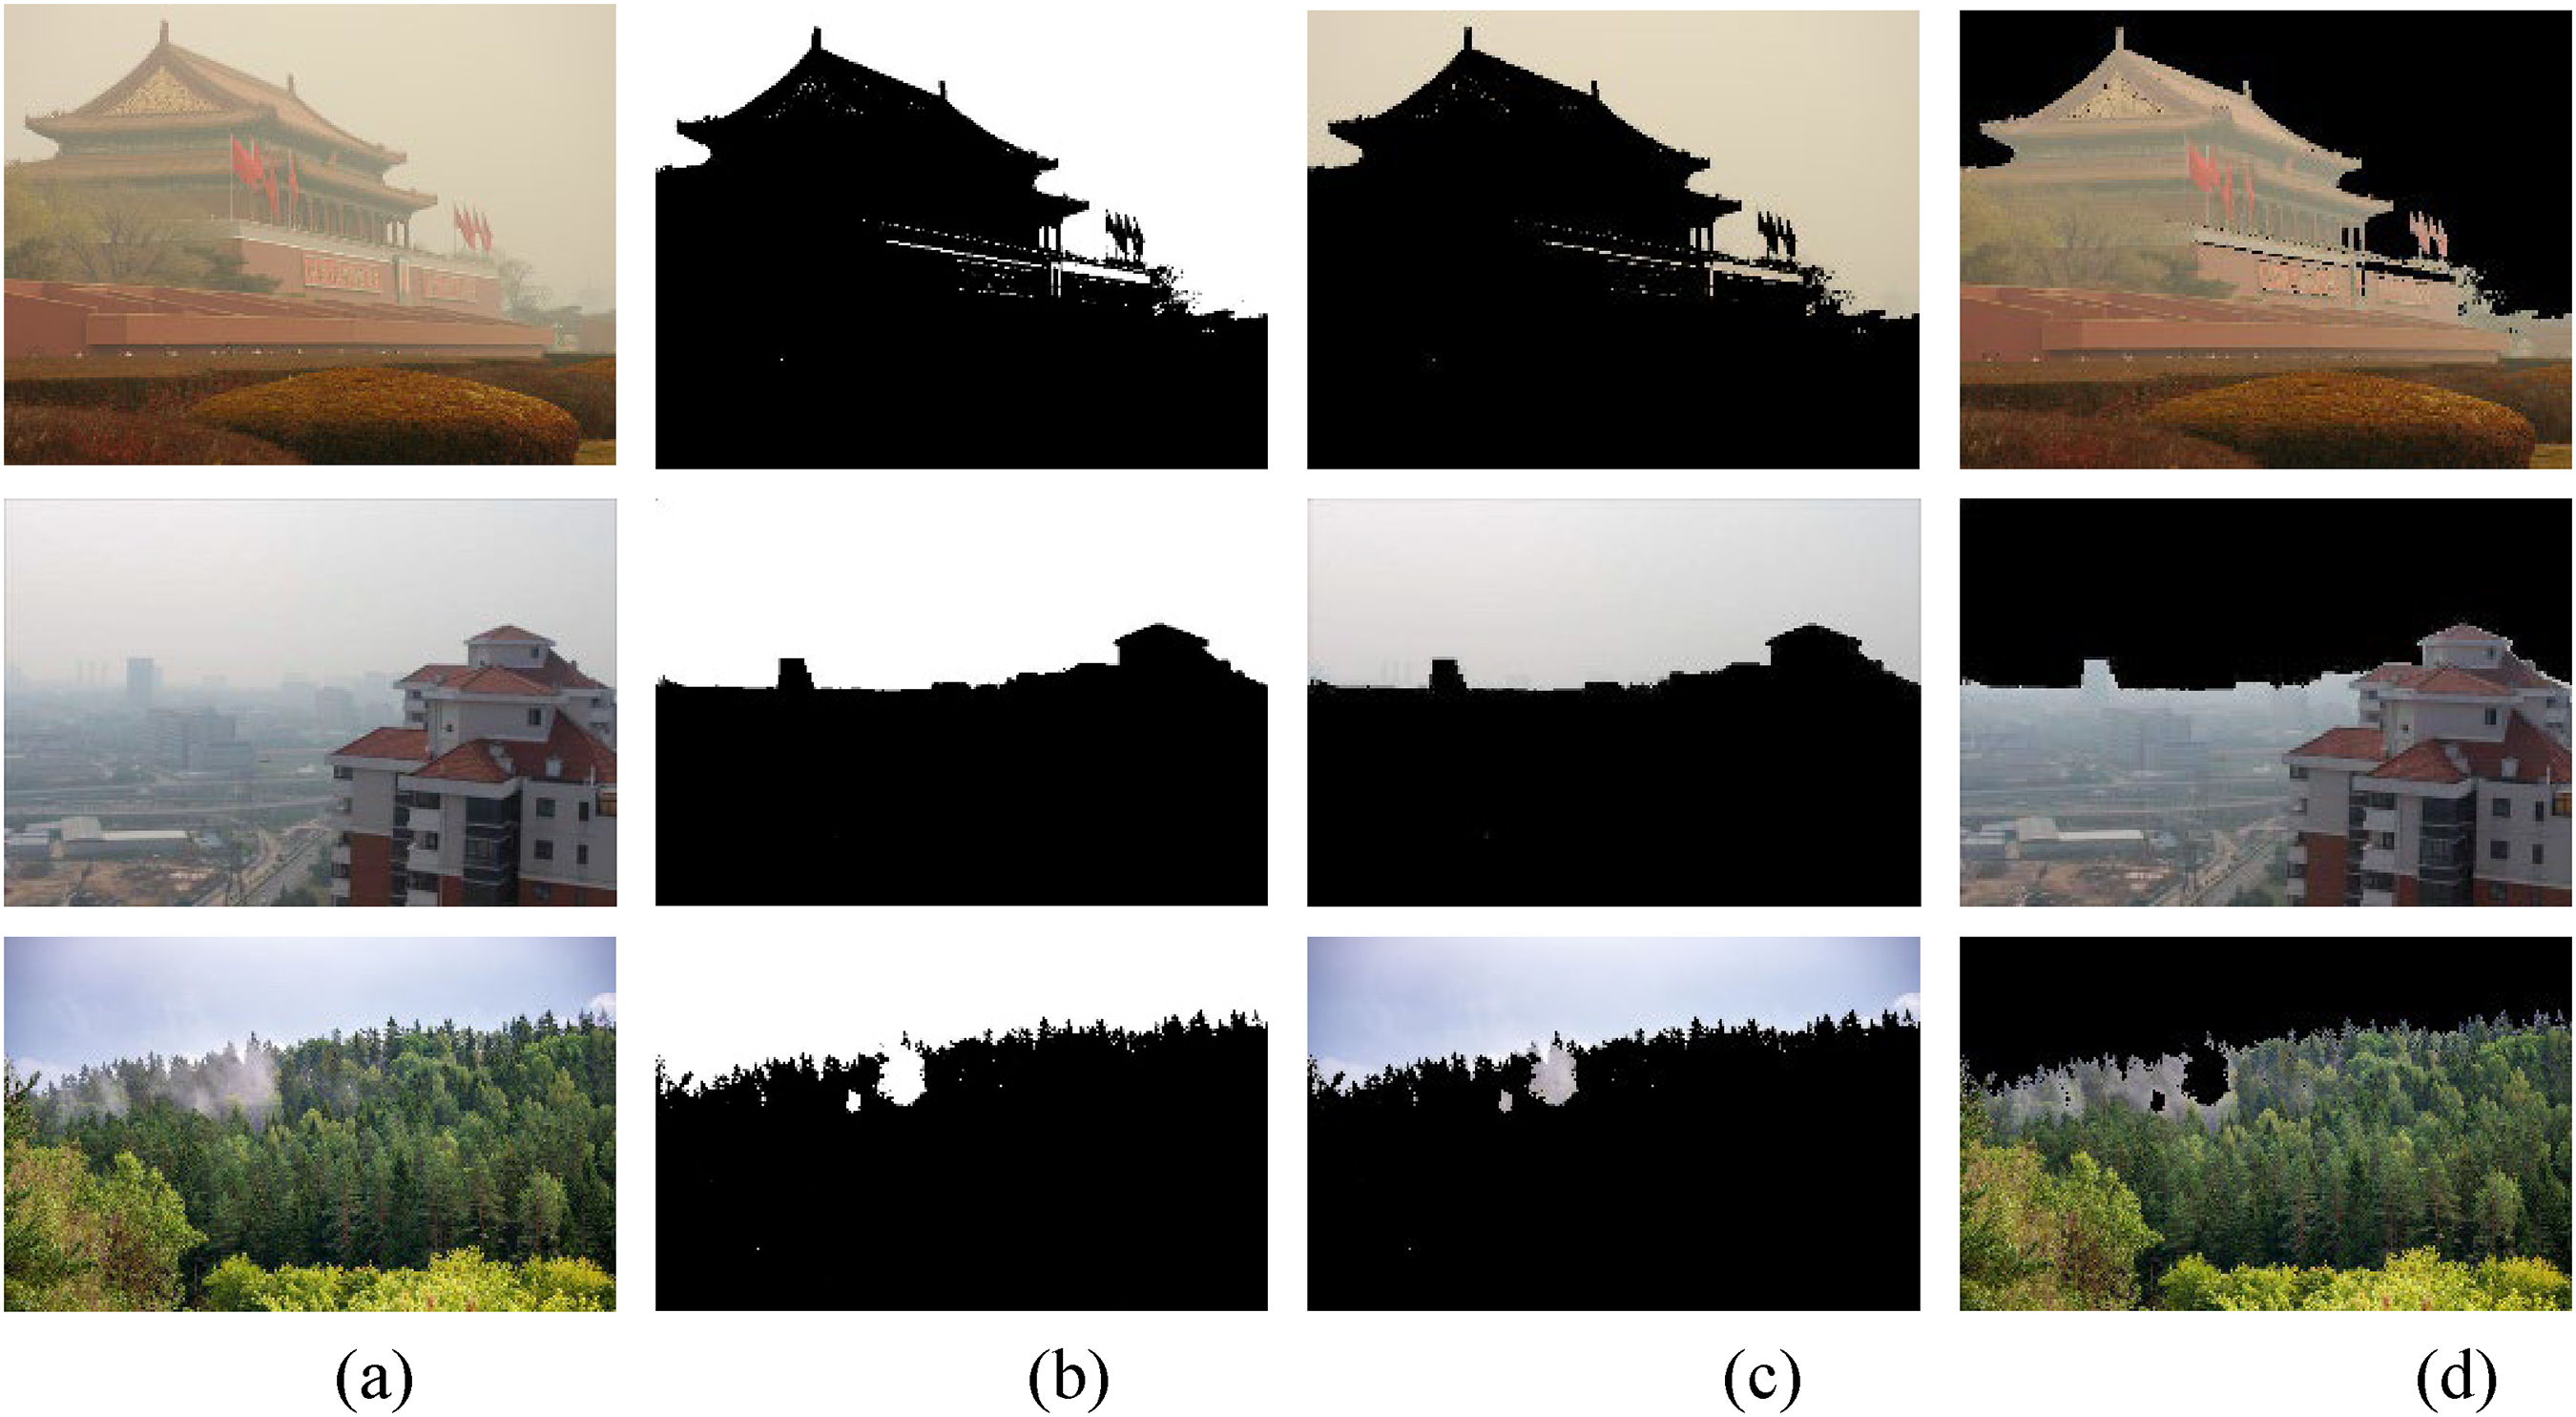
Image segmentation effect. (a) Haze image, (b) segmentation image, (c) sky area, and (d) foggy area.

Effect of different atmospheric illumination values A on image. (a) Haze image, (b) A = 150, (c) A = 200, and (d) A = 230.
In the dark channel prior technique, the brightest pixel value of the dark channel of 0.1% was selected as the estimated atmospheric illumination value A. When the image contained sky areas, atmospheric light values were incorrectly estimated. The selection of different atmospheric illumination values affected the brightness of the defogging effect, as shown in Figure 10. From Figures 10(b) to 10(d), the larger the A value, the darker the entire image; and the smaller the A value, the brighter the entire image. Different values of atmospheric light A distort different areas of the image; therefore, it is important that the atmospheric light values are accurately estimated.
To estimate the atmospheric illumination value more accurately, an atmospheric light value estimation method using the number of pixel points was proposed, as shown in (7). Table 1 lists the number of pixels in sky and non-sky areas and the normalisation results. The atmospheric light value at the initial threshold was calculated using Equation (7) and Table 1.

Number of pixels in the image area of sky and foggy areas.
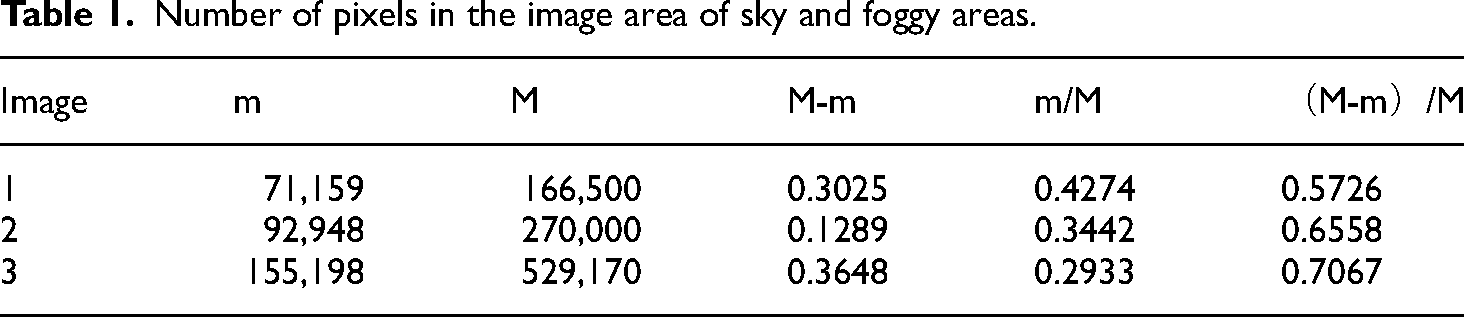
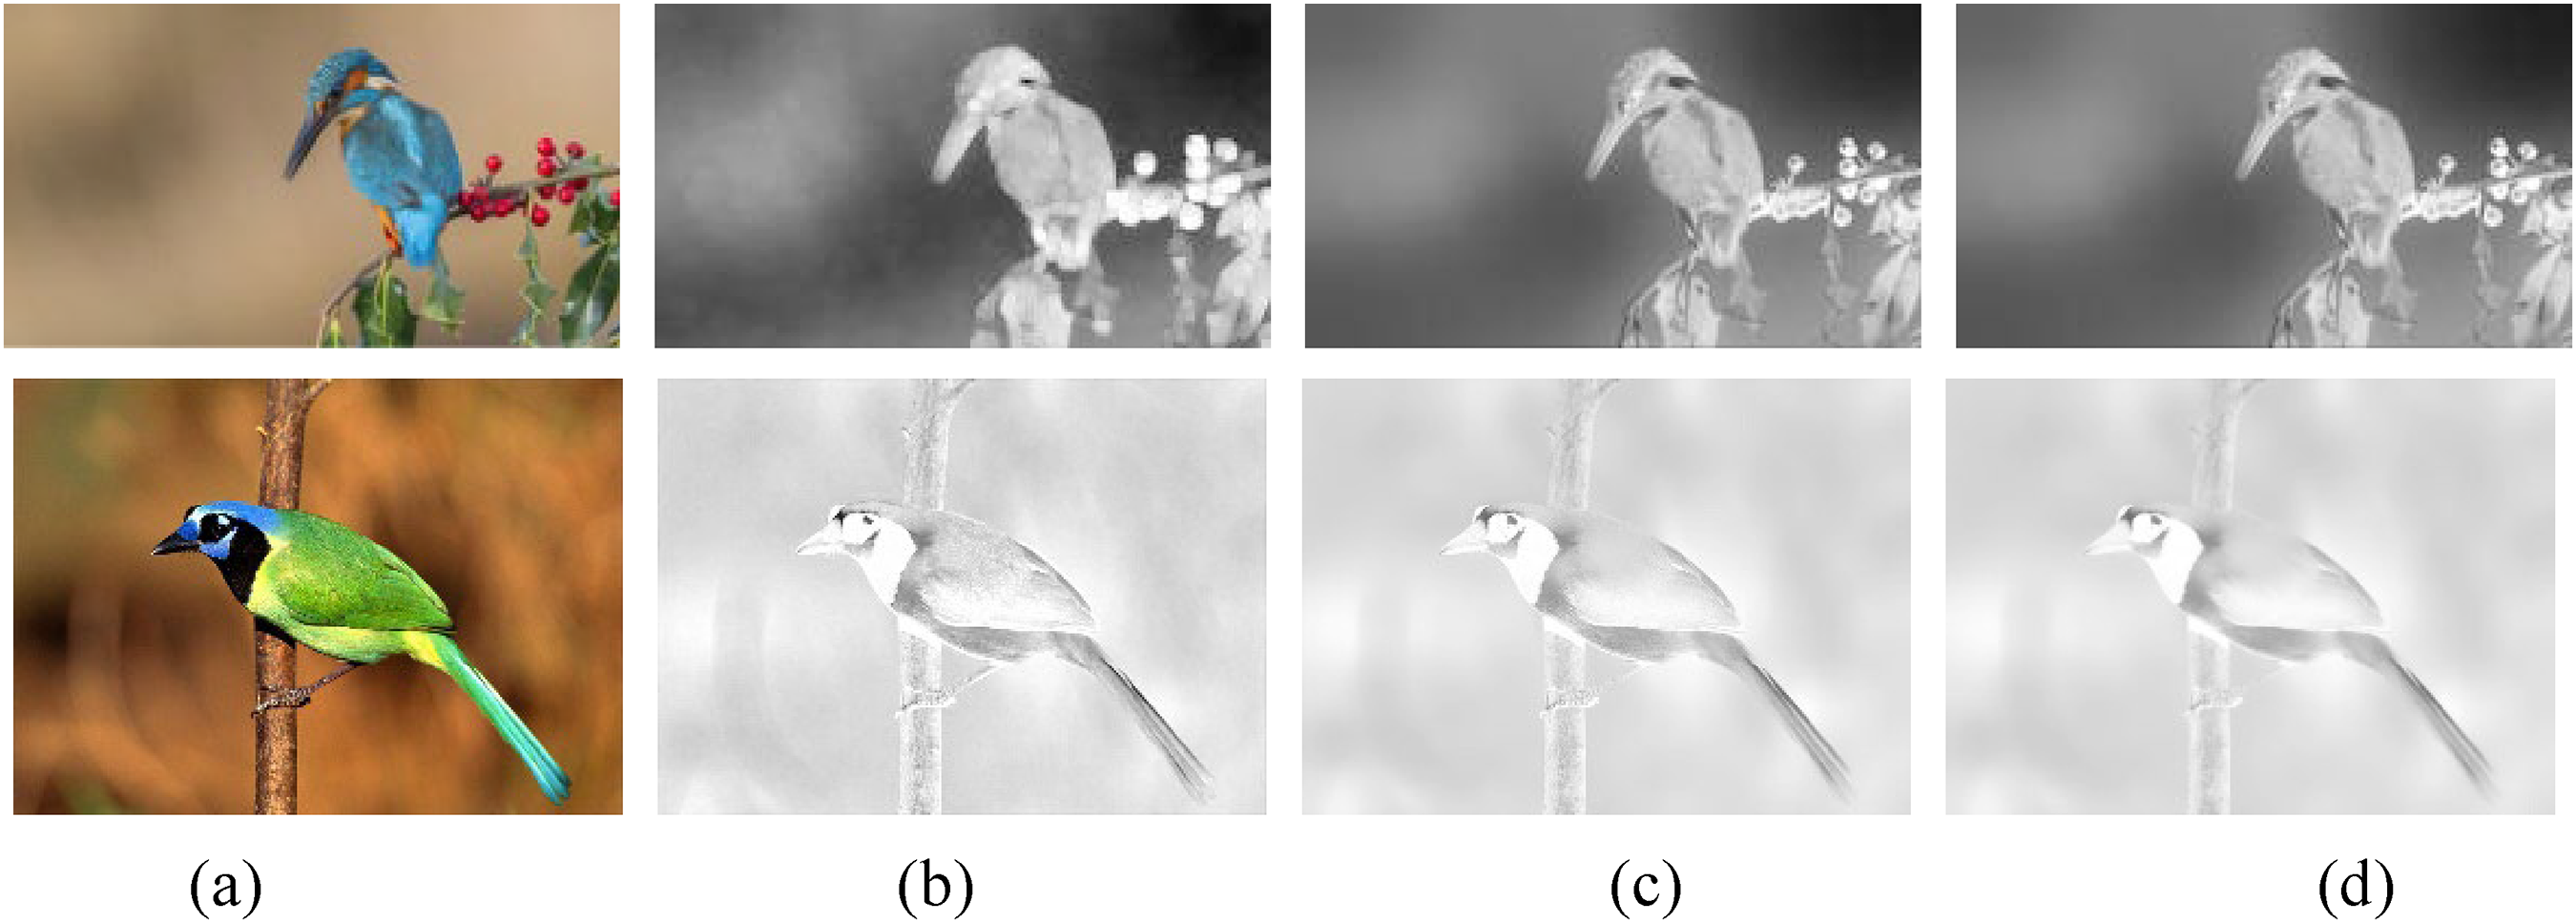
We combine the probability density distribution function of the grey image value, the K-means clustering technique, and a method for estimating atmospheric illumination values to improve image segmentation techniques. The probability density distribution function of the grey image value was constructed according to Equation (9), and the distribution of its pixel points is shown in Figure 11: The sky areas of the foggy images with high-spike characteristics in the probabilistic images were verified by statistical analysis of the probability distribution function of the pixel probability values, and the adaptive threshold was further adjusted according to this particular line. The specific process is as follows.

Probability distribution function of pixel probability value of image grayscale image. (a) Tiananmen, (b) city, (c) road, and (d) seascape.
The number of occurrences fi of each grey-level value i of the grey-level image is counted, the probability Pi of the number of occurrences fi of a single grey level value in the grey level image accounting for the total number of pixels W is calculated, and the probability value Pi of the number of pixels is expressed in (8) as follows:
According to the centralised distribution characteristics of the image grey level, the probability distribution function Mx(j) is constructed using the pixel probability value of the grey level image, Mx(j) is expressed in the (9) as follows:

The histogram interval [a,b] was calculated by combining the greyscale threshold n3 obtained from the probability density distribution function, the initial threshold T obtained from the K-means algorithm, and the atmospheric illumination value A under the initial threshold, as shown in Formula (11). The minimum point in the histogram as the final segmentation threshold Tour is obtained by traversing the interval [a, b].
Final image segmentation effect. (a) Tiananmen, (b) city, (c) seascape, and (d) forest.
Transmission optimisation
The minimum filtering method is used in dark channel theory to obtain the dark channel image. 23 Dark channel images obtained with minimum filtering produce an increasingly severe “step” effect as the filter window increases. The effects of different filter window sizes on image defogging are shown in Figure 13. To reduce this effect, the soft matting technique or guided filtering method 16 is generally used for smooth optimisation. Colour distortion and halo artefacts at the edges of images processed by the dark channel a priori algorithm when sky areas are included in the image: A method for optimising the image transmittance map using joint filtering is proposed to address the colour distortion and halo artefact phenomenon. The fast guidance filtering window used in this study is 3 × 3.

Influence of different size filter windows on image defogging effect. (a) Haze image, (b) the fast guidance filtering window is 3 × 3, (c) the fast guidance filtering window is 7 × 7, (d) the fast guidance filtering window is 13 × 13, and (e) the fast guidance filtering window is 15 × 15.
The original RGB image was used as the bootstrap image I′(z) for the fast bootstrap filter, and the transmissivity graph of the initial image was t(z). The guide image I′(z) and output transmissivity propagation image t(z) have a linear relationship, which is defined as follows:
By introducing regularisation parameter ε to prevent ak from being too large, the final minimum loss function is defined as follows:

The image processed by fast weighted guidance filtering not only has the discontinuity of sharp edges but also has a better image to cover the edges of the image. However, image-edge smoothing is a trade-off between these two contradictory aspects. To observe the objects in the image more clearly, weighted least-squares filtering was used to filter the edges and retain the image smoothing and edge information.
In weighted least squares filtering, the new image u was close to the input image g, and maximum smoothing, except for a significant gradient, was achieved. Weighted least squares filtering representation is expressed as follows
24
:
ax,p and ay,p are defined as follows:
Figure 14 shows the results of haze removal based on the proposed technique, GF and the fast-guided filter. The transmission is shown in Figure. 14(b), as estimated by G., has an evident block effect and discontinuity. The halo artefacts shown in Figure. 14(c), estimated by the fast-guided filter, is eliminated by smoothing; the smoothness is limited, and the edge loss of the transmittance image is large. The proposed technique effectively suppresses halo artefacts and image edge loss because the transmission map is better refined by combining the fast guided filter and weighted least-squares filtering, as shown in Figure 14(d).
Comparison of dehazing methods. (a) Original image, (b) initial transmissivity image, (c) fast guided filter transmissivity image, and (d) the result of proposed technique.
Figure 15 shows the image transmittance map and defogging image after different filtering optimisations. A comparison between Figures 15(c) and 15(d) shows that the image transmittance map processed by fast guided filtering and weighted least-squares filtering is better smoothed, and the edge information is better preserved. A comparison between Figures 15(e) and 15(f) shows that the edge details of the defogging image processed by fast guided filtering and weighted least squares filtering are improved, and the halo artefact phenomenon in the transition of the depth of field of the image is suppressed. Although the dark channel prior defogging technique using fast guided filtering and weighted least-squares filtering is effective, the defogged image is dark.
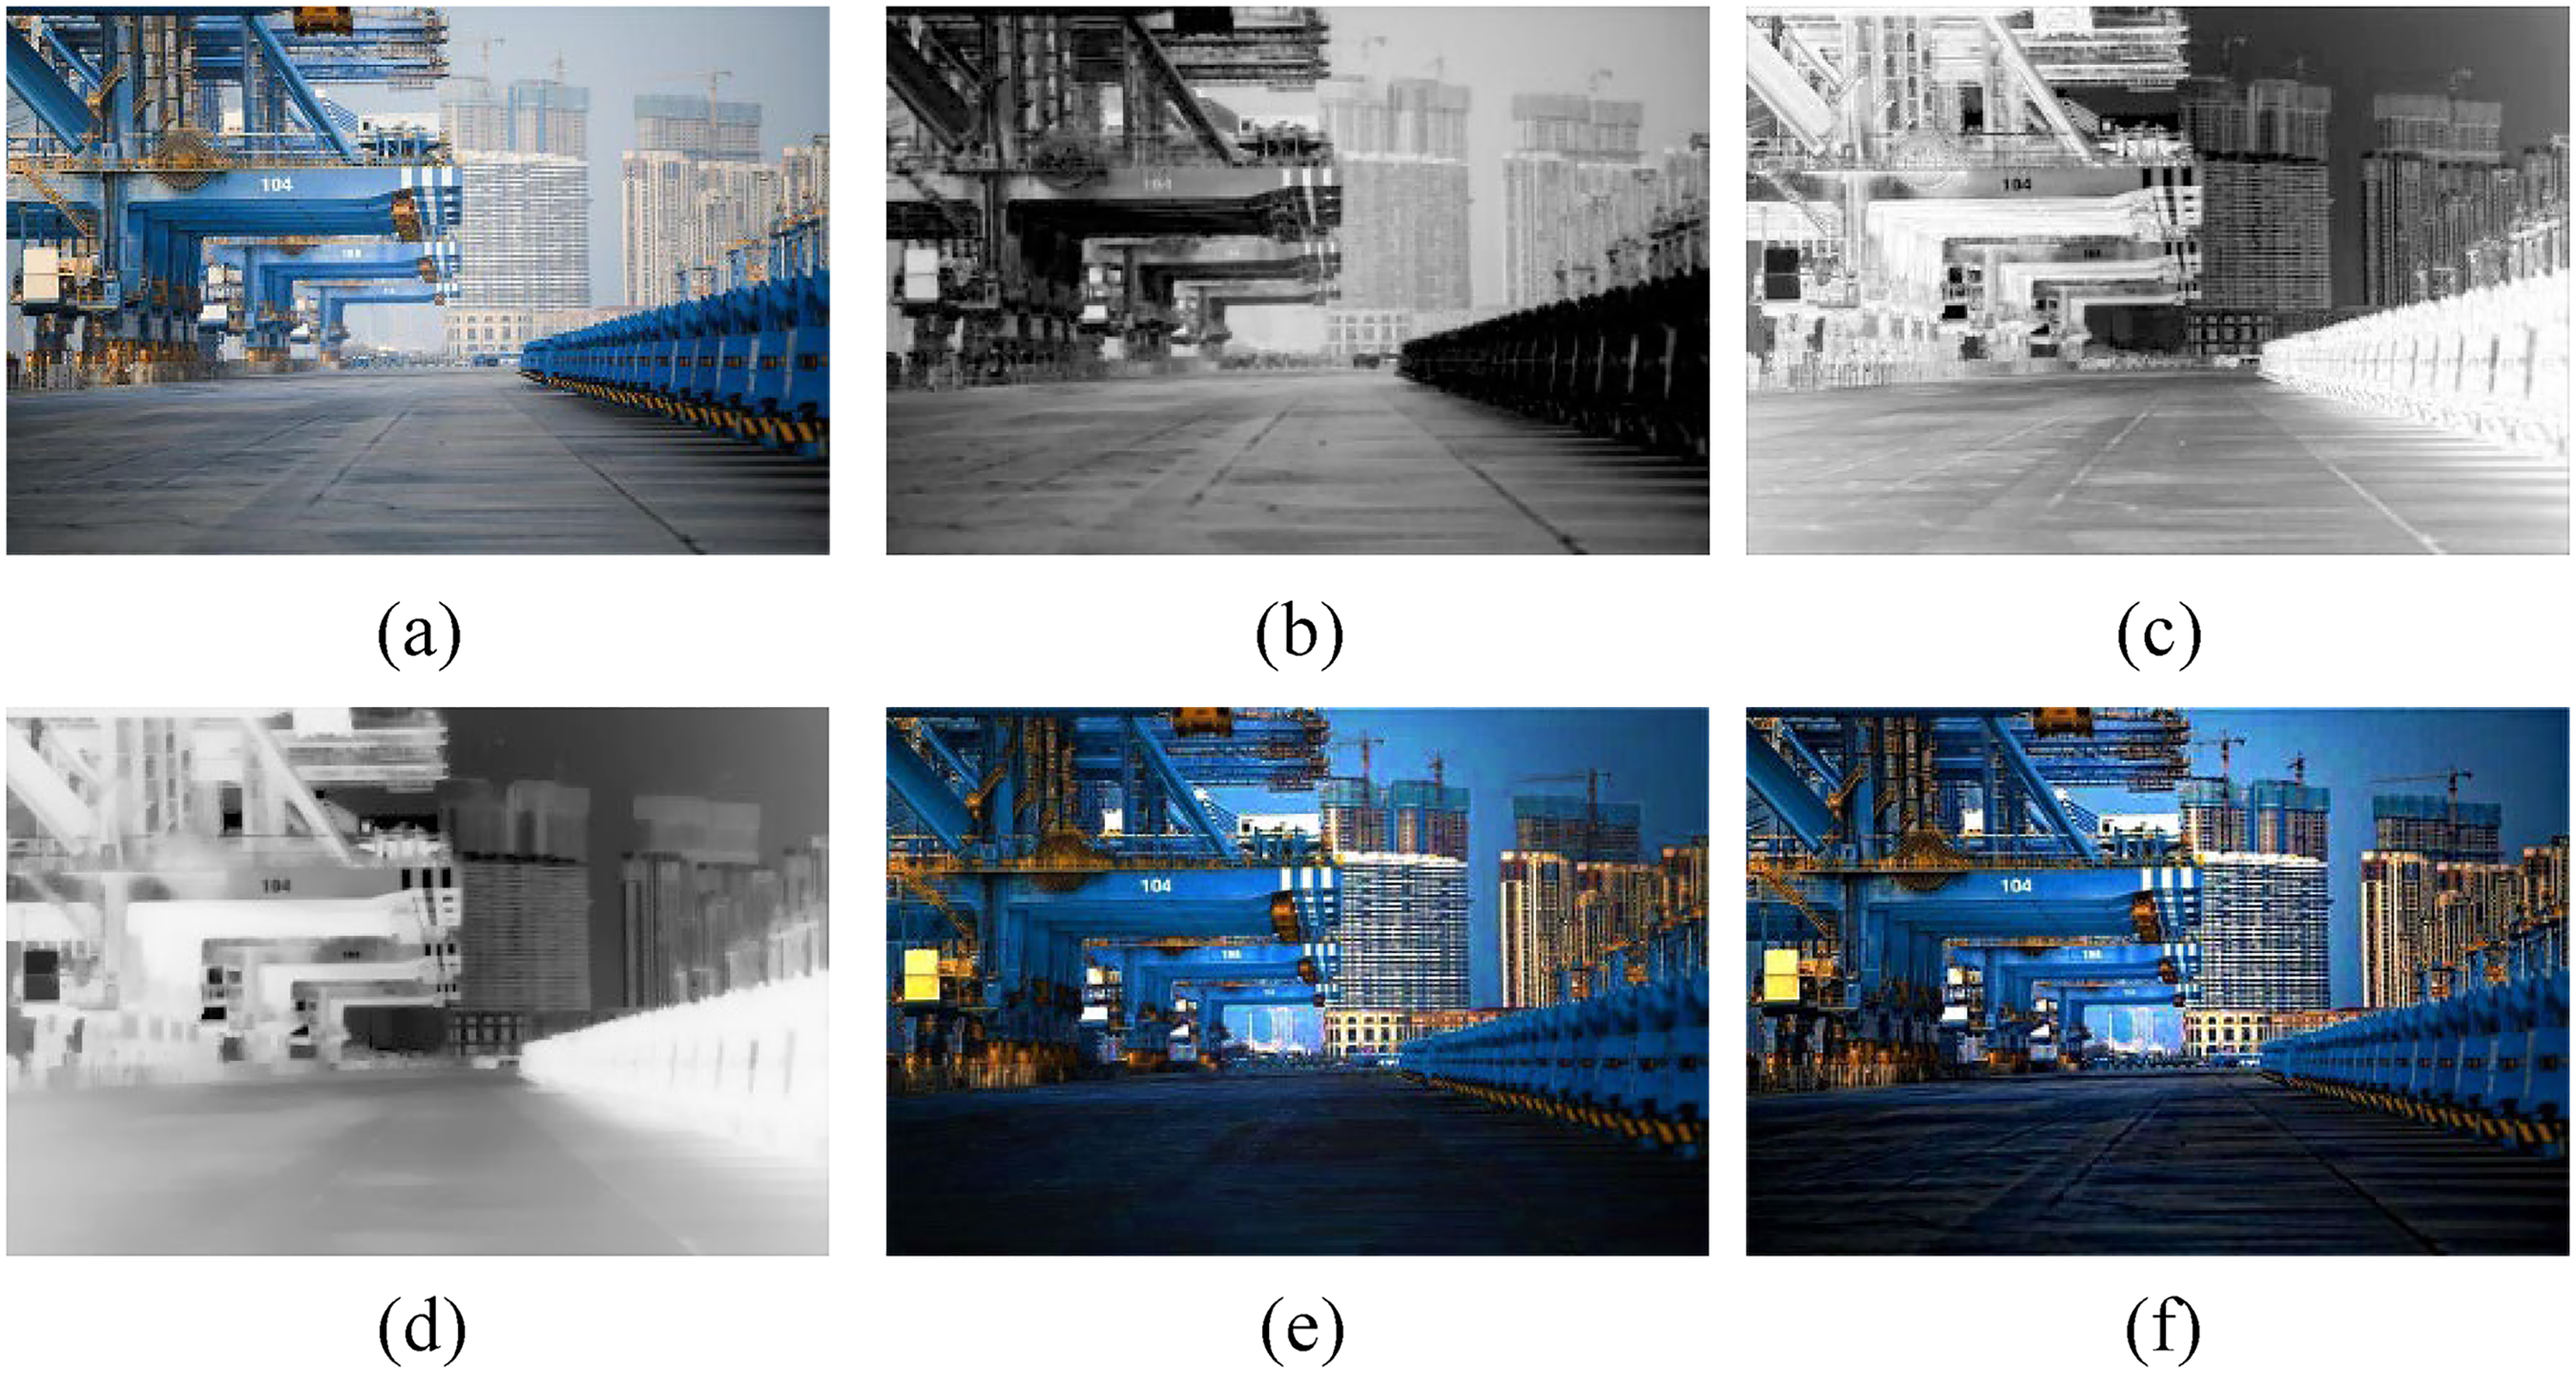
The image transmittance map and de-fogging image after different filtering optimisation. (a) Haze image, (b) Dark channel images, (c) Transmittance maps optimised by guided filtering, (d) Transmittance maps optimised by joint filtering, (e) Defogged image with guided filtering, (f) Defogged image with joint filtering.

Image enhancement effect with different values of λ. (a) Haze image, (b) λ = 0.3, (c) λ = 0.5, (d) λ = 1.3, and (d) λ = 1.5.
Gamma image correction and automatic colour scale optimisation
Further enhancement is required to improve the dim image colour caused by the dark-channel prior technique. The image enhancement effects for different values are shown in Figure 16. λ = 0.5 was used for image brightness correction, and the automatic colour scale optimised the image colour purity to make the images appear bright and natural. The histogram pixel values of the three channels of the gamma image were counted, and the limit values at both ends of the image were calculated to determine the upper and lower limits of the pixels. Finally, the corresponding mapping table was constructed and linear mapping was performed based on the corresponding proportions.
Comparative experiment and discussion
To evaluate the effect of the technique more comprehensively, we evaluated the image processing effect from both subjective and objective perspectives. We selected outdoor images containing sky areas and sudden changes in the depth of field, authentic indoor images from the Middlebury_GT dataset, and fuzzy images from the Middlebury_Hazy dataset. The fuzzy images of the Middlebury_Hazy dataset were obtained by fogging the actual indoor image depth map of the Middlebury_GT dataset. 25 Seven techniques were used to process the images: Wang et al., 17 Dhara et al., 26 Meng et al., 27 Tarel and Hautiere, 3 Galdran, 28 Tarel et al. 29 and the proposed technique. The hardware configuration of the running platform was a 64-bit Windows 10 system computer, an Intel Core i5 2.50 GHz CPU, 8 GB memory, and MATLAB R2016a. The effects of different defogging techniques on outdoor image processing are shown in Figure 17. The indoor image processing effects of different defogging techniques are shown in Figure 18.

Outdoor image processing effects under different defogging methods. (a) Haze image, (b) Zhu's technique, (c) Dhara's technique, (d) Meng's technique, (e) Tarel's technique 1, (f) Galdran's technique, (g) Tarel's technique 2, and (h) the proposed technique.

Indoor image processing effect under different defogging methods. (a) Original image, (b) Haze image, (c) Zhu's technique, (d) Dhara's technique, (e) Meng's technique, (f) Tarel's technique 1, (g) Galdran's technique, (h) Tarel's technique 2, and (i) the proposed technique.
As shown in Figure 17, fog was retained in the image processed using Zhu's technique. The images processed using Dhara's and Galdran's techniques show image distortion. The image processed using the proposed technique removed the image fog and effectively restored the image colour. As shown in Figure 18, fog was retained in the image processed using Zhu's and Tarel's techniques 1. The presence of missing background details in the image processed using Dhara's and Galdran's techniques. The image processed using Tarel's technique 2 was darker. The image colour information processed by the proposed technique was complete, and the image details were retained in the processed image.
Because the human eye often loses some details when observing pictures, there may be deviations in the subjective evaluation of images. Table 2 lists the objective evaluation metrics such as the rate of new visible edges(e), mean of normalised gradients of visible edges (r), perception-based image quality evaluator (PIQE), average gradient (AG), and information entropy (IE) were used to evaluate the image defogging effects. The results of the objective evaluation of the outdoor and indoor images for different defogging methods are listed in Table 3.
Comparison of PSNR of the proposed technique with existing techniques for different outdoor images.

Objective evaluation index.

Figures 19 and 20 show the objective evaluation indicators for images 3 and 10, respectively. The results of e, r, AG, IE, and PIQE obtained using the proposed technique were good. The images processed using the proposed technique were clear and natural, more in line with human perception, with less loss of detailed information and distinct edge features.

Objective evaluation criteria of image 4.

Objective evaluation criteria of image 10.
For outdoor sky image processing, the rate of the new visible edge index appears negative, mainly because of the existence of the sky region. The presence of dense fog in the original image increases the number of visible edges. The disappearance of dense fog regions in the image after using the proposed technique leads to a decrease in the number of visible edges, resulting in a negative rate of the new visible edge index. The number of visible edges in the original image (Image 4) and the image processed using the proposed technique are shown in Figure 21. The fog area of the image processed using the proposed technique was restored to a fog-free area. For indoor images in the sky area, the rate of the new visible edge index reflects the image details. The greater the rate of new visible edges, the more pronounced the image details. The rate of new visible edges has a deviation in the image measurement effect for sky areas and is better for indoor sky-free areas.
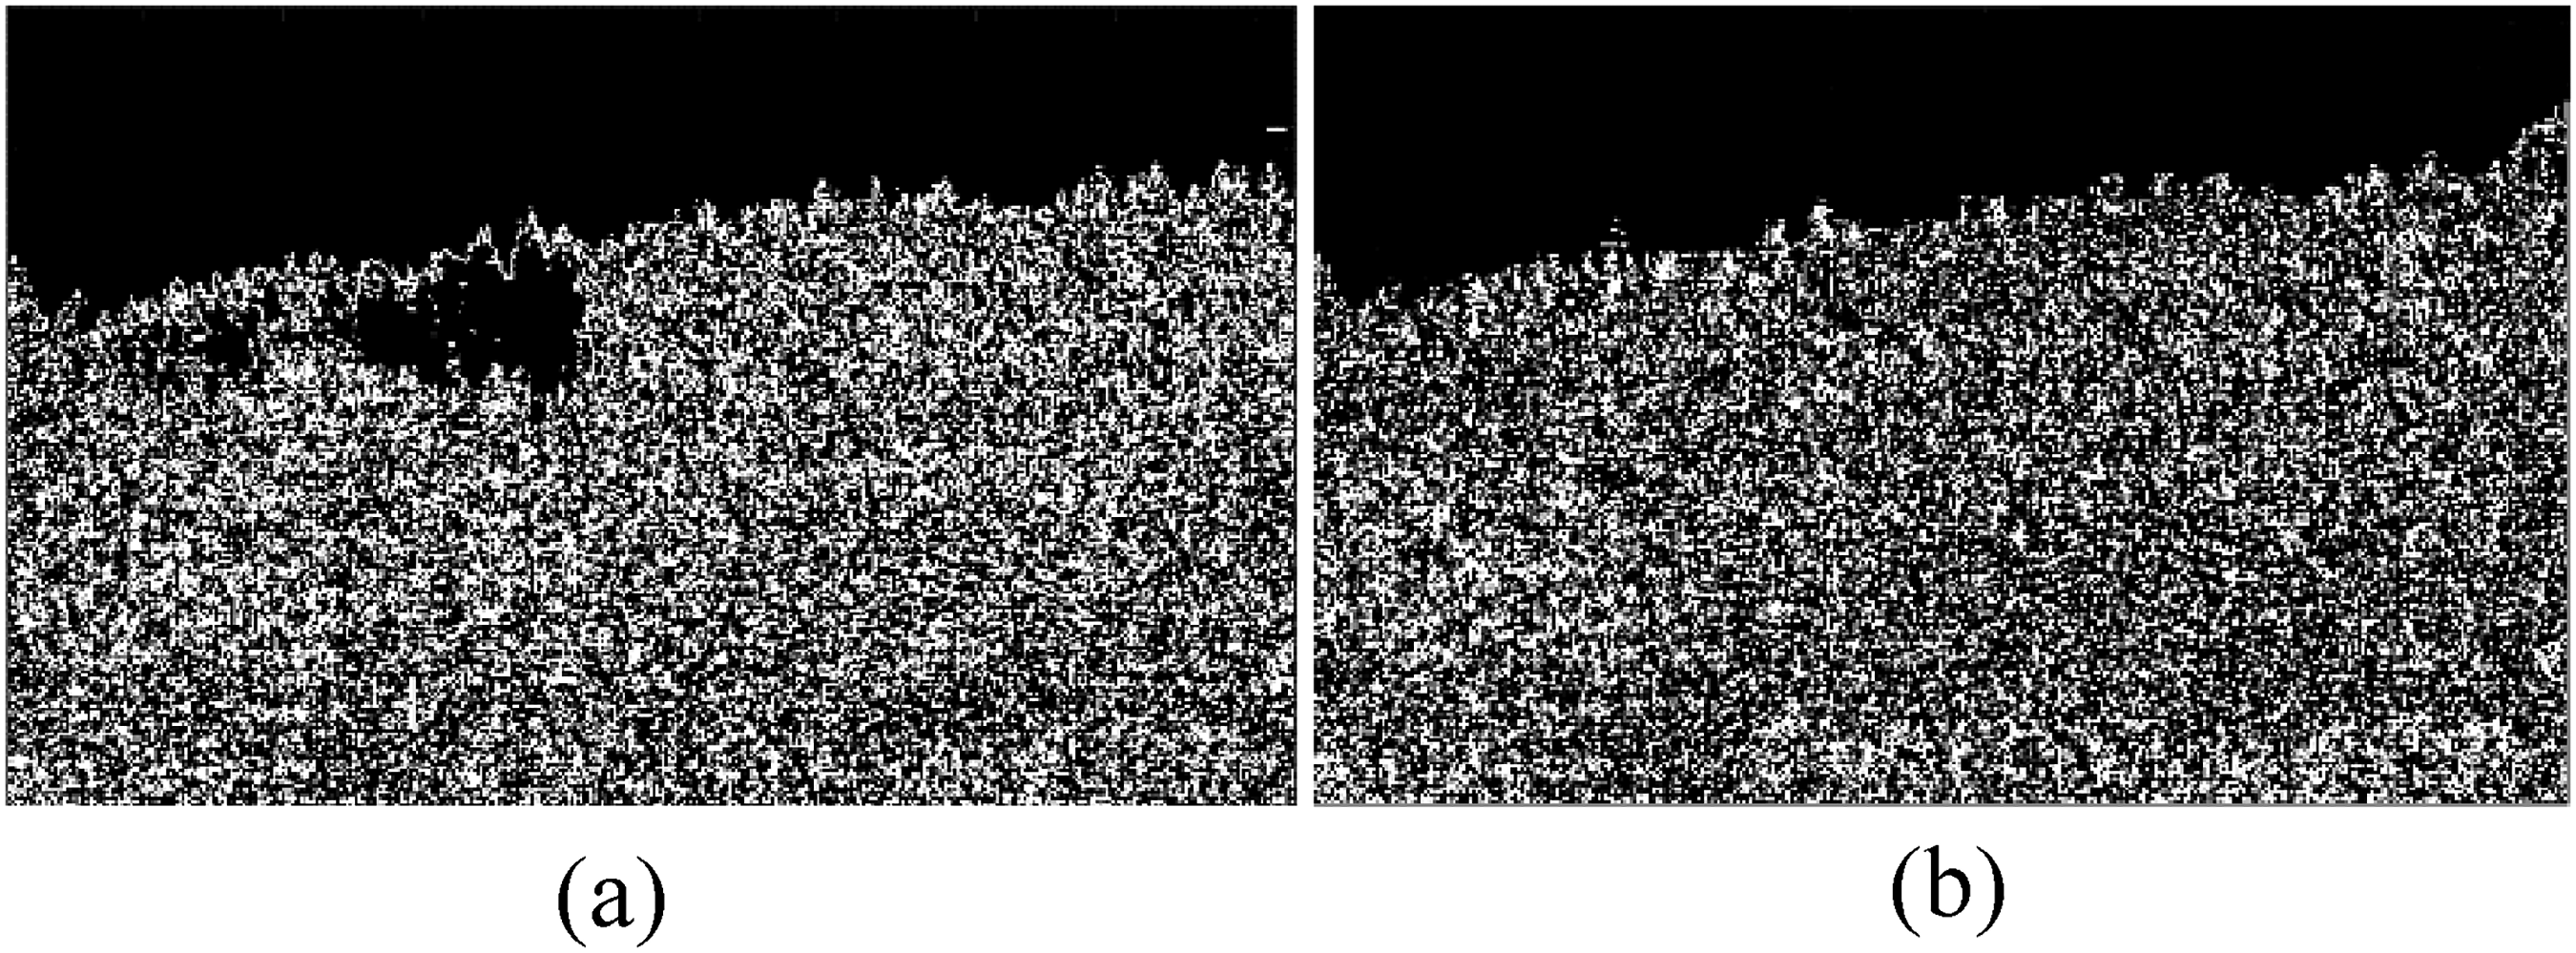
Number of visible edges in fogged area. (a) Number of visible edges of haze Image, (b) number of visible edges of restore Image.
Images 1–4 show outdoor images. As shown in Figure 22, the rate of new visible edges in the outdoor images did not fully reflect the defogging effect owing to the existence of the sky area. Figures 23–26 show the results of the evaluation indicators IE, AG, r, and PIQE, respectively. PIQE of Galdren's and Tarel's technique is worse duo to over saturated as listed in Table 3. Image oversaturation leads to less information, the result of IE is lower than those of other technique, PIQE of proposed technique was good in all techniques, the rank were in the best, best, second, and third positions, respectively, from images 1–4. IE r and AG values of the proposed technique were the best.

The rate of new visible edges.

Information entropy.

Average gradient.

The mean of normalised gradients of visible edges.

Perception-based image quality evaluator.
Images 5–10 show indoor images. As shown in Figure 22, the rate of new visible edges of the indoor images from Images 5–10 processed by the proposed technique was the best among all techniques. Figure 23–26 show the results for IE, AG, r, and PIQE, respectively. IE, AG, r of indoor images from Images 5–10 processed by the proposed technique are the best, and the result of PIQE is in the middle of all the techniques.
Figure 27 shows the processing times for the different techniques. Each image was 500 × 500 pixels in size. The proposed technique has a shorter processing time than Meng's technique, Tarel's technique 1, and Tarel's technique 2. The proposed technique has a longer processing time than Zhu's, Dhara's, and Galdran's techniques, as listed in Tables 4, 5, and 6. The image edge information is saved more thoroughly and the image definition is higher, which conforms to the human eye observation effect. Accurate segmentation of the sky in the image is added, which leads to an increase in image running time.
Comparison of the running time.

Time.
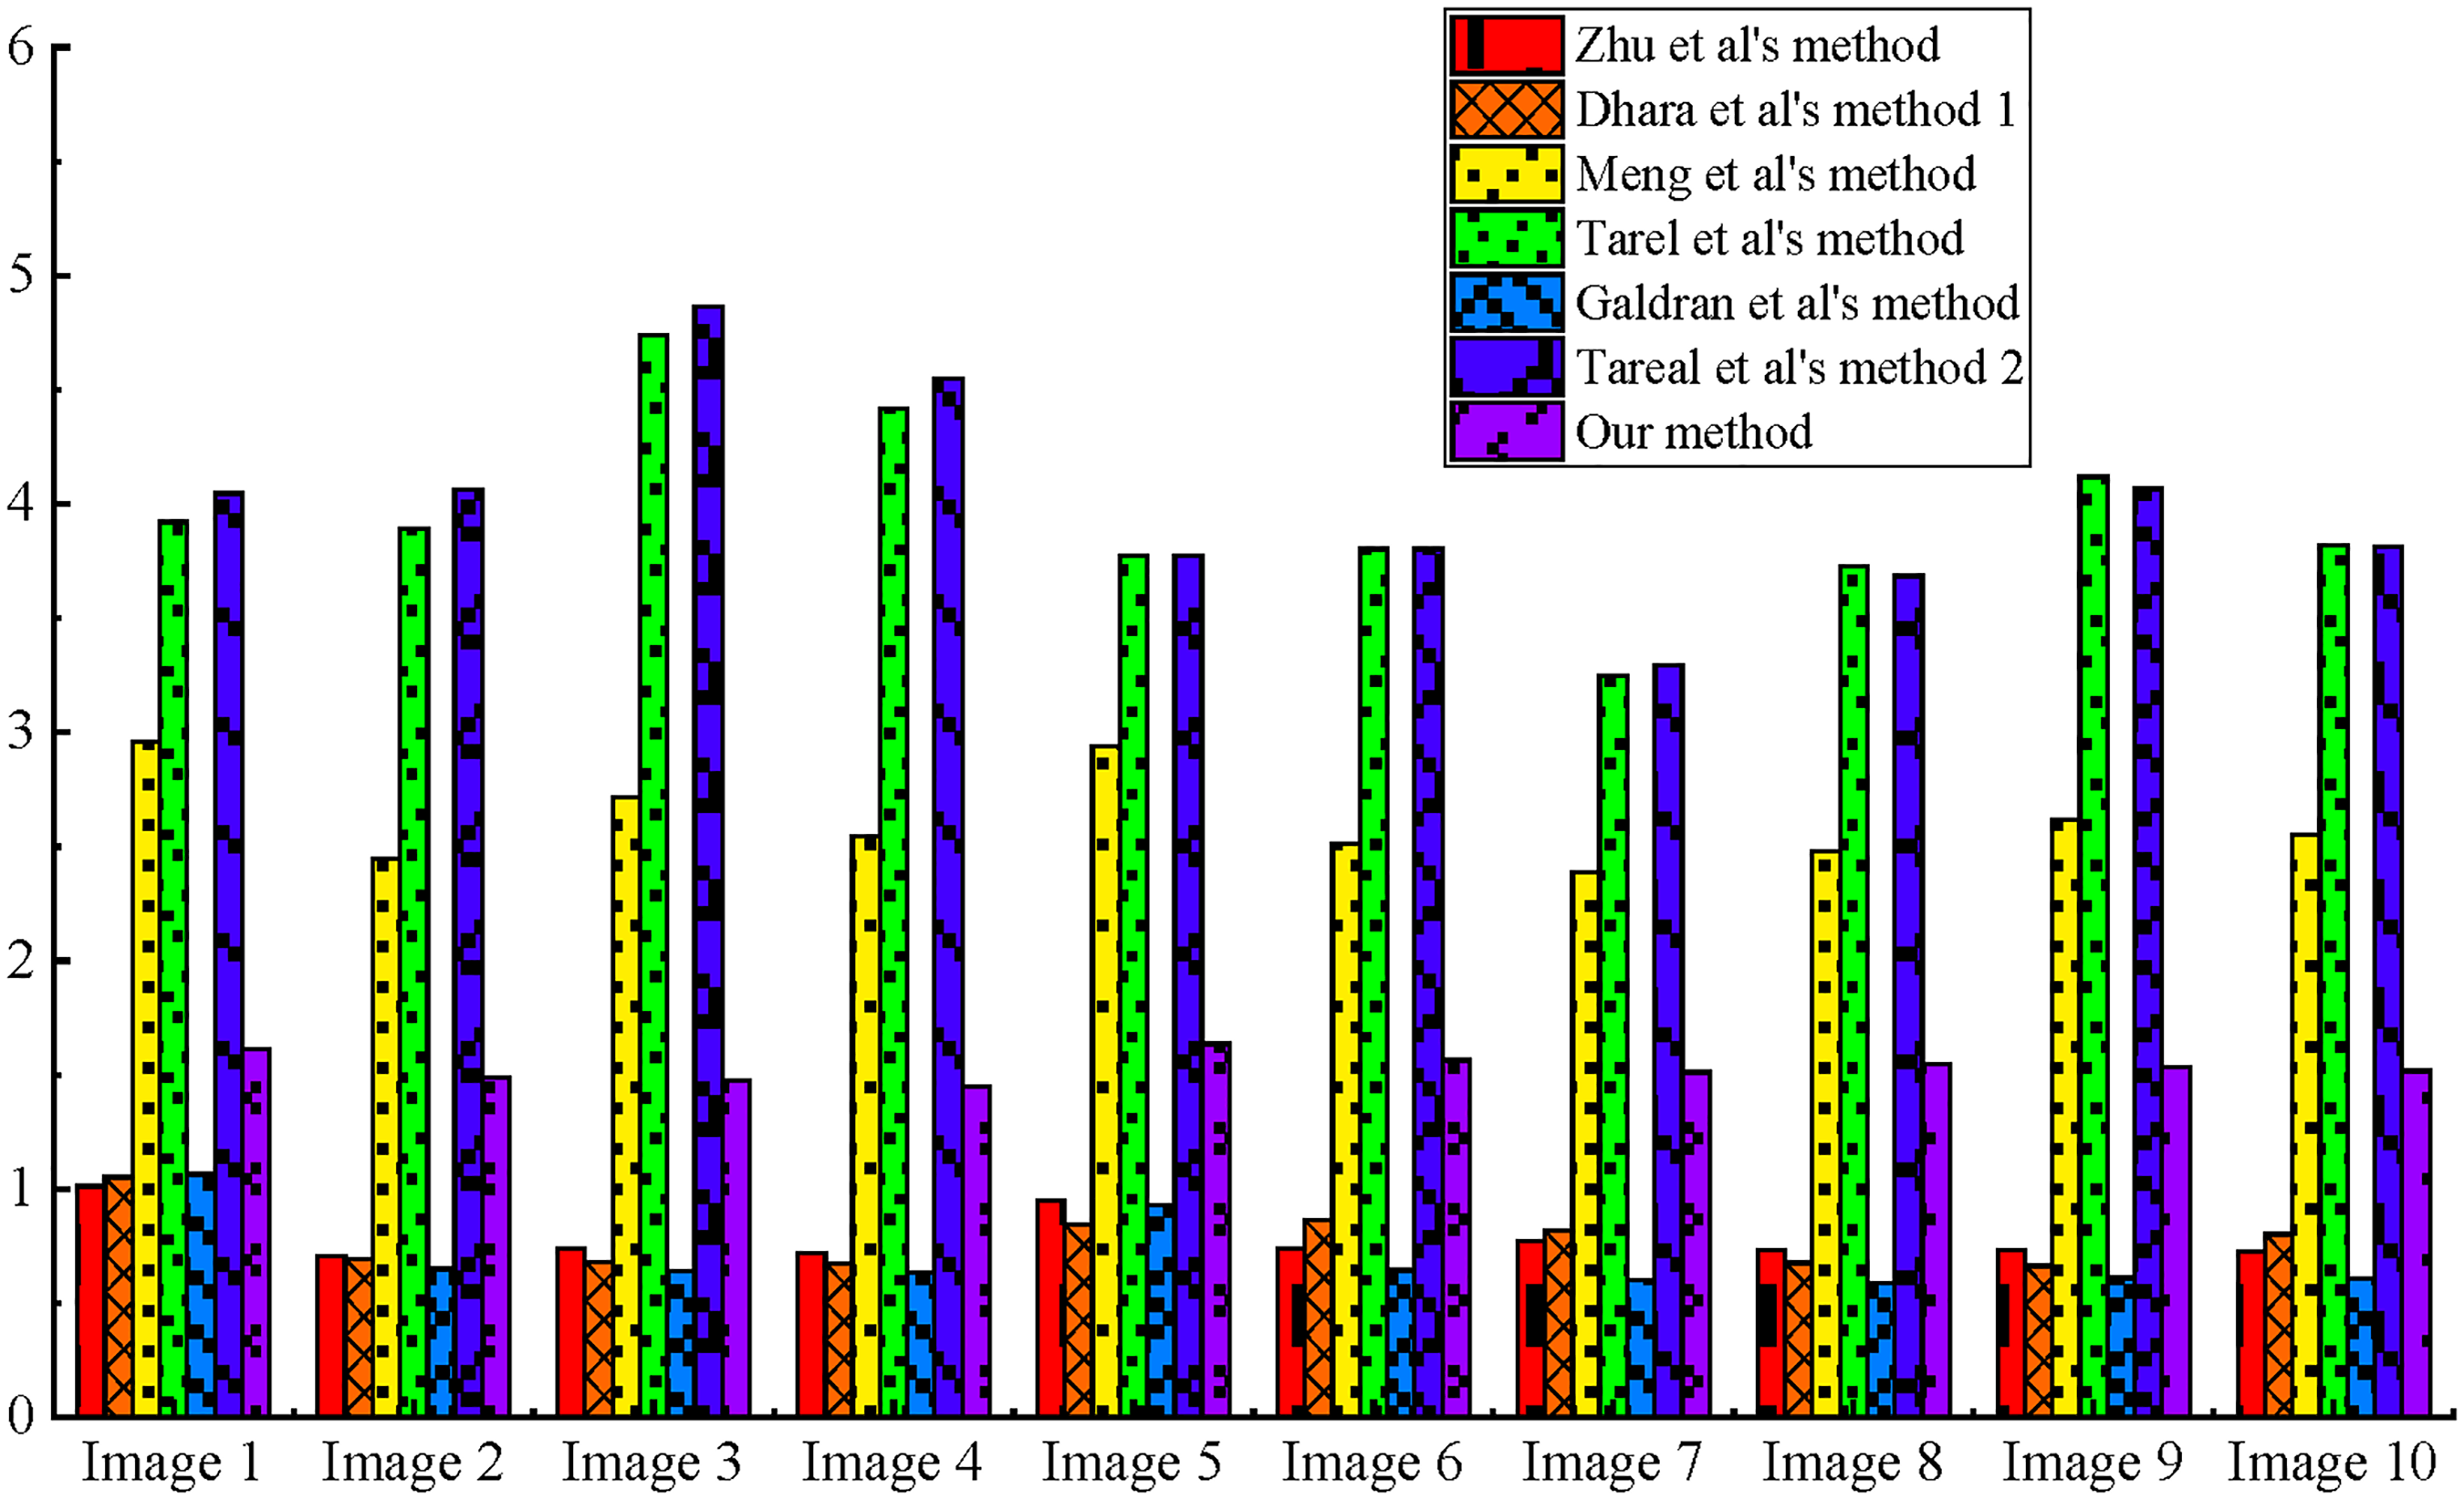
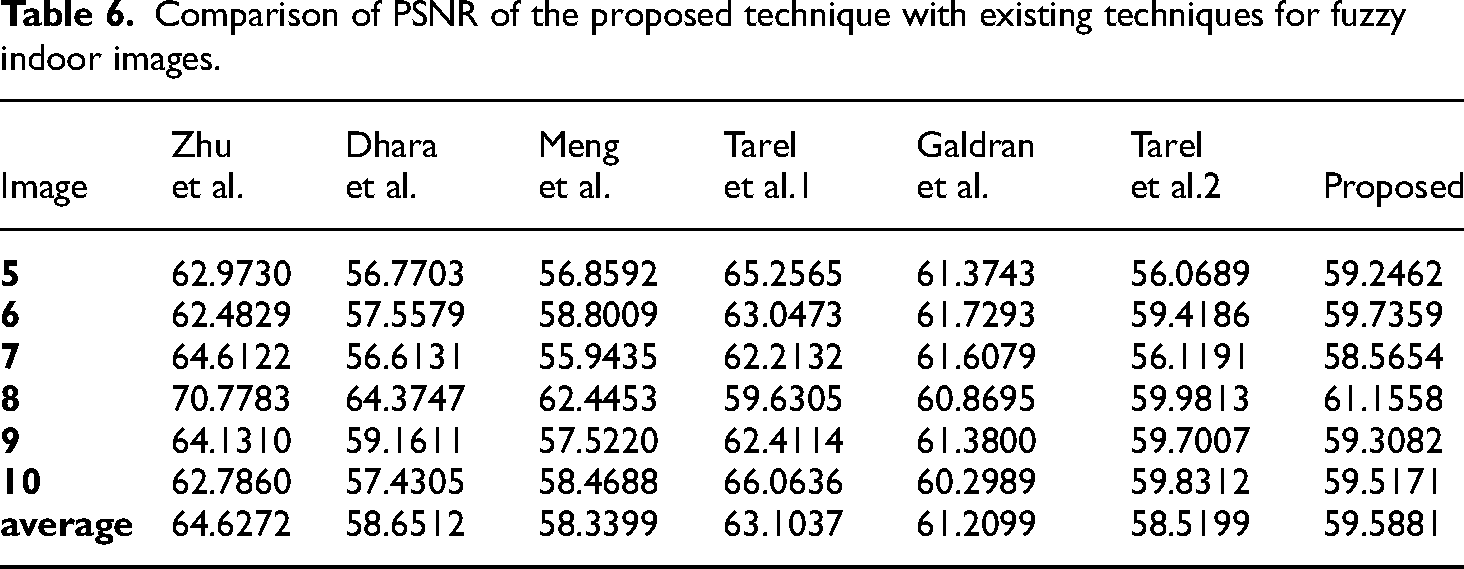
To evaluate the defogged images more comprehensively, the peak signal-to-noise ratio (PSNR) and structural similarity (SSIM) metrics were added to objectively evaluate the defogged images. The results are listed in Tables 2 and 5–7.
Comparison of SSIM of the proposed technique with existing techniques for different outdoor images.

Comparison of PSNR of the proposed technique with existing techniques for fuzzy indoor images.
Comparison of SSIM of the proposed technique with existing techniques for clarity indoor images.

In outdoor image processing, Tarel's technique 1 produces oversaturated results, as shown in Figure 17(e), which produces false edges, resulting in the highest number of visible edges, as shown in Table 3. The results of Meng's and Dhara's technique are listed in Table 5; however, as clearly observed in Figure 24, the result of the average gradient is not satisfactory. Zhu's technique follows a supervised learning mechanism to estimate the depth map; in comparison, Zhu's technique produces natural results, as listed in Tables 2 and 5. However, as clearly observed in Figures 22 and 25, e and r of the proposed technique are not as good as the above techniques, and image edge information recovery is not satisfactory with Zhu's technique. PSNR of Galdra's technique is slightly inferior to that of Zhu ‘s, as listed in Table 2. However, the e and PIQE of the proposed technique are not as good as those of the above techniques. Galdra's technique improves the image quality but does not match human perception. The number of edges of Tarel's technique is the worst owing to oversaturation, as shown in Table 3, and the results of IE, PSNR and SSIM are not as good as those of the above techniques in Tables 2–5.
In indoor image processing, PSNR of Zhu's technique is the best, as listed in Table 6; however, the SSIM of Zhu's technique is worse because Zhu's technique follows a supervised learning mechanism to estimate the depth map, and the defogging images are unsatisfactory. PSNR and SSIM of Tarel's technique 2 are the worst owing to oversaturation, as listed in Tables 6 and 7. SSIM of Meng's technique and the proposed technique are good for all the techniques in Table 7, and PSNR of the proposed technique is in the middle, as shown in Table 6. In comparison, the proposed technique produces natural images with better edge recovery and more complete detailed information, as shown in Figure 22–26. Overall, the proposed technique restored images in line with human perception.
To compare with mainstream algorithms, existing Kansal techniques were added for comparison with the proposed technique. As shown in Table 8 and Figure 28, the metrics and “Pumpkins” images from 30 were used to compare the de-fogging effect of different techniques, the metrics include e, r, σ, and Colour Naturalness Index (CNI). Simultaneously, the metrics and “Sweden” image from Refs. 31 and 32 were used to compare the de-fogging effect of different techniques in Table 9 and Figure 29, the metrics include CNI and Fog Reduction Factor (FRF).

De-fogging results. (a) Pumpkins image, (b) de-fogging results of Zhu's technique, (c) de-fogging results of Dhara's technique, (d) de-fogging results of Meng's technique, (e) de-fogging results of Tarel's technique 1, (f) de-fogging results of Galdran's technique, (g) de-fogging results of Tarel's technique 2, (h) de-fogging results of Kansal's technique, 30 and (i) de-fogging results of proposed technique.

De-fogging results. (a) Sweden image, (b) de-fogging results of Zhu's technique, (c) de-fogging results of Dhara's technique, (d) de-fogging results of Meng's technique, (e) de-fogging results of Tarel's technique 1, (f) de-fogging results of Galdran's technique, (g) de-fogging results of Tarel's technique 2, (h) de-fogging results of Kansal's technique, 31 (i) De-fogging results of Kansal's technique, 32 (k) De-fogging results of proposed technique.
Comparison of e, r, σ, and CNI of the proposed technique with existing techniques for “pumpkins” image.

Comparison of FRF and CNI of the proposed technique with existing techniques for “Sweden” image.

As listed in Table 8, CNI of Kansal's technique 30 is the worst, the new visible edges and the mean of the normalised gradients of the visible edges of Kansal's technique 30 are the best, and the transmission map is refined using a fast guided filter to remove blocking artefacts and restore the image detail of Kansal's technique. 30 In comparison, the e and r of the proposed technique are also good, and the result of CNI is the best of the proposed technique. The proposed technique is effective at removing blocking artefacts and preserving edge information.
As listed in Table 9, FRF of Zhu's technique was the worst because it follows a supervised learning mechanism to estimate the depth map, and the defogging of images processed by Zhu's technique is unsatisfactory. In comparison, Kansal's technique31,32 was also effective, and the proposed technique was the best. The low- and high-pass components of both channels are fused to obtain a transmission map using Kansal's technique, 32 CNI of Kansal's technique 32 is the best, and the proposed technique is second only to Kansal's technique. 32 Overall, the proposed technique can achieve better image defogging while maintaining image colour saturation.
Conclusion
Despite a large number of studies that have addressed haze in natural images in hazy environments, the recovery effect is not ideal for processing hazy images containing sky areas. In this study, an improved dark-channel a priori single-image defogging technique using image segmentation and joint filtering is proposed. The probability density distribution function of the grey image value, the K-means clustering technique, and the method for estimating atmospheric illumination values are combined to improve image segmentation techniques and achieve the segmentation of sky and non-sky areas in hazy images. The image transmittance map was optimised by combining fast-guided filtering and weighted least-squares filtering to retain the edge information of the image and smooth the gradient change of the internal region. Subjective and objective analyses of the experimental results show that the proposed technique produces natural images with better edge recovery and more detailed information. Simultaneously, the proposed technique using joint filtering can suppress halo artefacts. In the future, the image segmentation algorithm can be further improved to adapt to a high haze density.
Footnotes
Acknowledgments
This study was supported by the Shandong Provincial Key Research and Development Project (2022CXGC020302).
Declaration of conflicting interests
The authors declared no potential conflicts of interest with respect to the research, authorship, and/or publication of this article.
Funding
The authors disclosed receipt of the following financial support for the research, authorship, and/or publication of this article: This work was supported by the Natural Science Foundation of Shandong Province, (grant number 100000).
Author biographies
Zhenguo Lu is aprofessor in the field of Mechanical Engineering, his area of research is image processing, intelligent coal mining and tunnel excavation.
Hongbin Wang is a researcher in the field of mechanical engineering, whose research areas include image denoising and image recognition.
Mingyan Wang is a lecturer in the field of Mechanical Engineering, and her research areas include mechatronics and hydraulic integration, image recognition, et al.
Zhiwen Wang is a lecturer in the field of mechanical engineering, and his research areas include image denoising and image detection.