In survey sampling, information on auxiliary variables related to the main variable is often available in many practical problems. Since the mid-twentieth century, researchers have taken a keen interest in the use of auxiliary information due to its usefulness in estimation methods. The current study presents two new estimators for the distribution function of a finite population based on dual auxiliary variables. The new estimators can be used in situations where the researchers face some sort of complex data set. The mathematical equations for the bias and mean square error have been obtained for each proposed estimator. Besides, an empirical study simulation study has also been conducted to analyse the performance of estimators. It is found that the new suggested estimators of the distribution function of a finite population are more accurate than some of the existing estimators.
Many researchers have studied the use of auxiliary variables in the literature of survey sampling to increase the efficiency of their developed estimators for estimating common parameters like mean, median, variance, and standard deviation. Traditional ratio, product, and regression estimators provide efficient results for unknown parameters in such circumstances.
Out of many practices, the ratio method and product method has been widely used for estimating unknown population parameters, when there is a high positive and a high negative correlation between study variable and auxiliary variable. In the past, several authors introduced many ratio type and product type estimators by using different type of linear transformation of original auxiliary variables. The drawback of these class of estimators are that it uses a very specific linear transformation of auxiliary variable that restrict the scope of applications of this class, in practice. To overcome this drawback, we here propose a generalized class of ratio in regression type exponential estimators of population distribution function under a very general linear transformation of auxiliary variable.
Simple random sampling works quite well if the population of interest is homogeneous. When the population of interest is heterogeneous, however, it is preferable to apply stratified random sampling rather than simple random sampling. In stratified random sampling, we divide the entire aggregate into numerous non overlapping groups or subgroups called strata. These groupings are completely homogeneous, and a sample is taken from each stratum separately. The values of the Nh must be known in order to get the most out of stratification. After the strata have been determined, a sample is taken from each stratum, and the drawings are done separately. The entire technique is represented as stratified sampling if a simple random sample is collected from each stratum. To divide the sample into strata, different researchers utilized different sample allocation procedures. If the sample size in each stratum is large enough, using a distinct ratio estimate in each stratum is more precise. As a result, we’ll apply the proportional allocation strategy in this article. The population mean under stratified random sampling has received more attention. Stratification enhances efficiency, when the variance between strata is substantially greater than the variance within strata,. The problem of measuring the function of finite population cumulative distribution (CDF) arises when interest lies in knowing the proportion of study variables that are below or equal to a certain value. The need for CDF in many situations is greater than ever. For example, a physician could be interested in knowing what percentage of the population consumes 35% or more of their calories from trans fats. A soil scientist, for example, could be interested in determining the clay percentage distribution in the soil. In addition, policymakers may be curious about the percentage of people living in a developing country who are poor. The CDF has been computed using information on one or more auxiliary variables in survey sample literature. Chambers and Dunstan,1 Rao et al.,2 Rao,3 Kuk,4 Ahmed and Abu-Dayyeh,5 Rueda et al.,6 Singh et al.,7 Hussain et al.,8 and Hussain et al.9 proposed two new estimators for estimating the finite population distribution function using supplementary information using simple and stratified random sampling schemes. In practice, there needs to be more research on the use of both auxiliary variables and the finite population distribution function.
In survey sampling literature, the authors have estimated finite population distribution function (CDF) using on one or more auxiliary variable. Dual use of auxiliary variable has been rarely attempted while estimating finite population distribution function, therefore we motivated towards it. In this article we proposed two new estimators which are competing the existing estimators and estimators proposed by Hussain et al.9
The paper offers two new estimators for estimating finite population distribution functions under stratified random sampling that leverage dual usage of auxiliary information. The bias and mean square error of the proposed estimators have been expressed up to first order of approximation. Cochran,10 Murthy,11 Bahl and Tuteja,12 Rao ,13 Singh and Kumar,14 Grover and Kaur,15 and Hussain et al.9 have all demonstrated that the proposed estimators are more efficient than traditional unbiased estimators, both theoretically and empirically.
The problem of estimating the finite population CDF arises when the interest lies in knowing the proportion of values of the study variable that are less or equal to a certain value. There are situations where estimating the CDF is deemed necessary. For example, for a nutritionist, it is interesting to know the proportion of population that consumes 25% or more of the calorie intake from saturated fat. Similarly, a soil scientist may be interested in estimating the distribution of clay percent in the soil.
In addition, policymakers may be interested in knowing the proportion of people living in a developing country below the poverty line.
Sampling design and notations
When the population is heterogeneous, stratified random sampling should be used instead of simple random sample. In stratified random sampling, we split the diverse population into a number of non-overlapping groups or subgroups termed strata. These groupings are completely homogeneous, and a sample is taken from each stratum separately. To disperse the samples in the strata, surveyors employ a variety of sample allocation techniques. If the sample size in each stratum is big enough, using independent ratio estimates in each stratum is more precise. As a result, we will apply the proportional allocation method in this article. Many publications offered many ratio type estimators in stratified sampling by changing the auxiliary variable, such as Kadilar and Cingi,16 Kadilar and Cingi,17 Koyuncu and Kadilar,18 Shabbir and Gupta,19 Aladag and Cingi,20 Malik and Singh.21
Let be a finite population of N units, which is divided into L homogeneous strata, where the siRe of h stratum is , for , in such manner . Assume that Y and X be the study and auxiliary variable , where and , a sample is drawn in such a manner , where n is the sample siRe.
Let and , and be the population and sample distribution functions of Y and X under stratified random sampling, respectively, where , , , , . Let and , and be the population and sample means of X and Z under stratified random sampling, respectively, where, , , , .
To find the properties of the existing and proposed estimators of , we consider the following relative error terms under stratified random sampling. Let
such that for , where is the mathematical expectation of . Let
where
Existing estimators
Several approximations of the finite population distribution function under stratified random sampling are described in this section. In all these estimators (Existing) the authors use single auxiliary information (Variable), except Hussain et al.9 Under the first order of approximation, the biases and MSEs of these adapted estimators are calculated.
Mean estimator
The traditional unbiased mean estimator , is given by
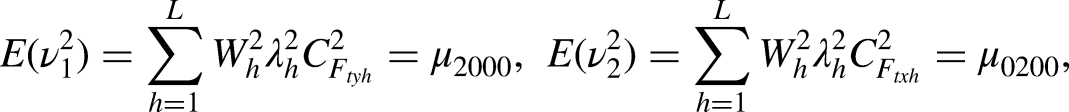
The second family of estimators for estimating in stratified random sampling, is given by
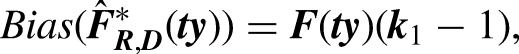
where, and . The bias and mean square error of , to the first degree of approximation, are given by
and
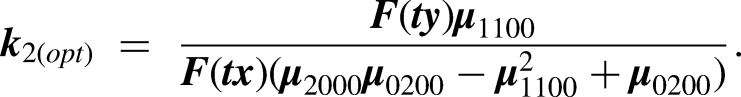
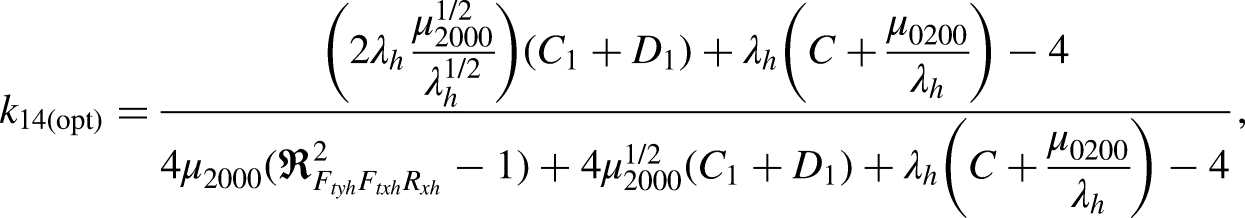
The optimum values of , and , determined by minimizing (28), are given by
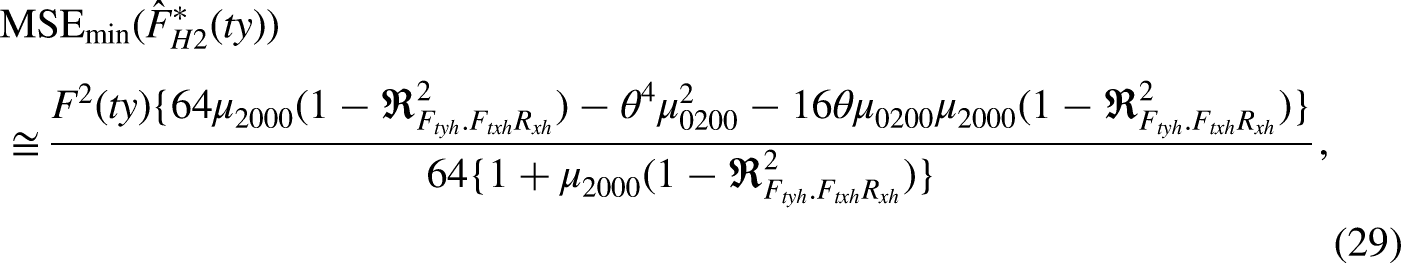
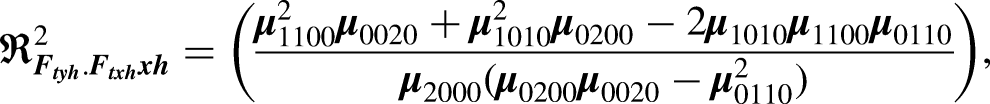
The minimum MSE of at the optimum values of , and is given by
where .
Here (29) may be written as
where
It is clear that is more precise than .
Proposed estimators
The theory of stratified random sampling deals with the characteristics of the estimates with a great choice of sample size to get maximum precision. When the correlation exists between the study variable and the auxiliary variable, then there is a possibility that the correlation also exists between the study variable and CDF as well as the rank of the auxiliary variable.
In the literature of survey samping consider here, the authors are used one or more auxiliary varibles (Information) for estimation of finite population distribution function. Using dual auxiliary varibles in the felid of estimation of finite population distribution function are rarely attempted. The principal advantages of our proposed ratio-in-regression exponential type estimators under statrtified random sampling are that it is more flexible and efficient existing then the existing estimators.
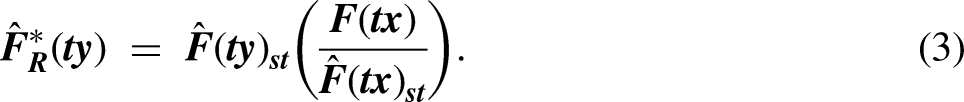
Motivated by Hussain et al.,9 we propose a new ratio in a regression type exponential estimator of the finite population distribution function in stratified random sampling, including supplementary information in the form of CDF mean and rank of the auxiliary variable.
First proposed estimator
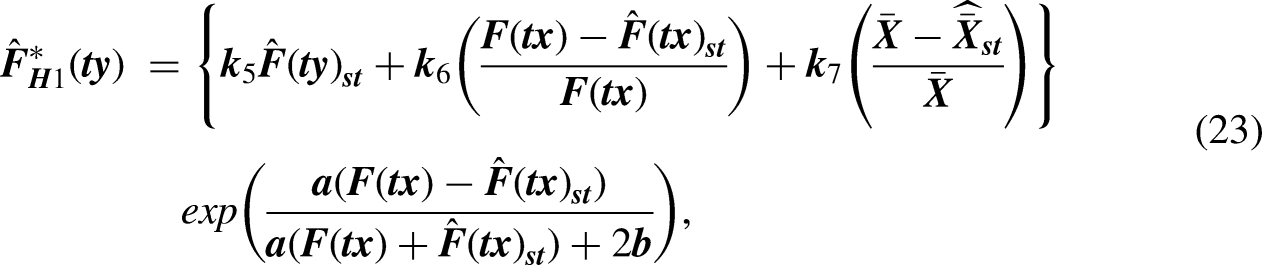
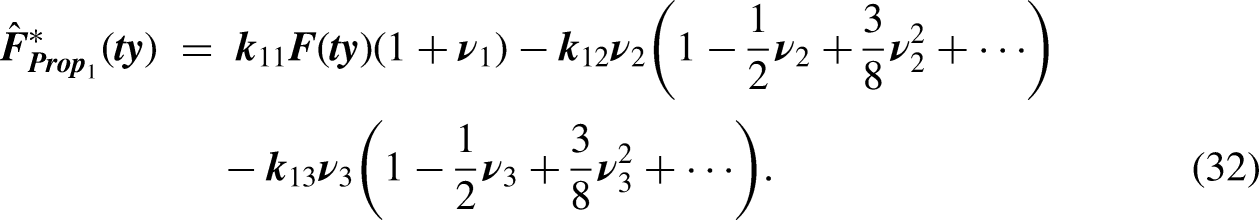
We use the same idea as the first proposed family of estimators Hussain et al.,9 and estimate finite population CDF, which concerned with CDFs of study and auxiliary variables along with the mean of the auxiliary variable.
where , and are suitable chosen constants. The estimator , in terms of errors, we have
Further simplifying (32), and keeping terms up to power 2, we have
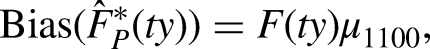
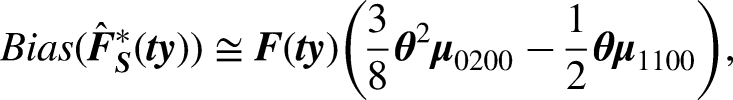
The bias and mean square error of , to the first degree of approximation, are given by
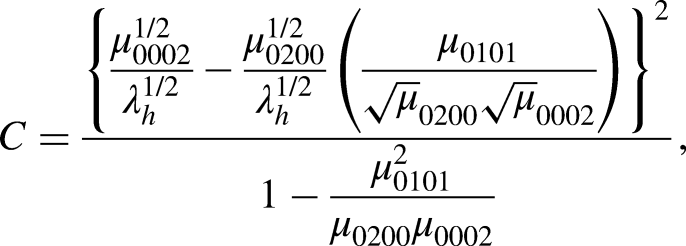
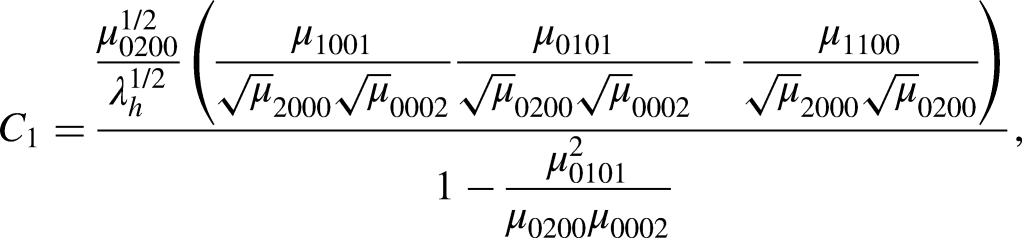
The optimum values of , and , determined by minimizing (34), are given by
The minimum MSE of , at the optimum values of , and , is given by
where
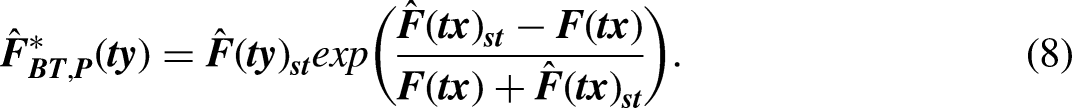
Second proposed estimator
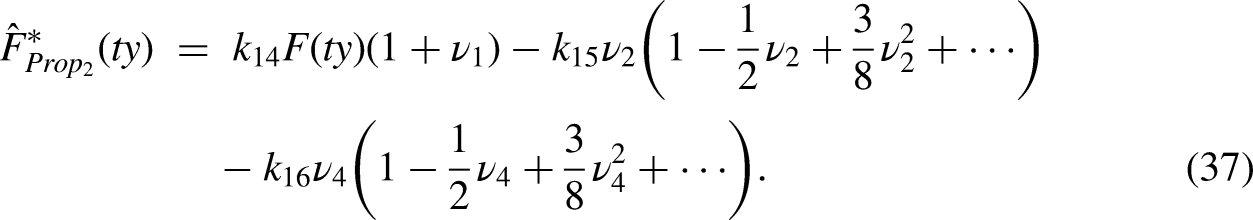
Here we use the same idea of second proposed family of estimators of Hussain et al.,9 and estimate finite population CDFs which concern CDFs of study and auxiliary variables along with ranks of the auxiliary variable.
where , and are suitable chosen constants. The estimator , in terms of errors, we have
Further simplifying (76), and keeping error upto power 2, we have
The bias and MSE of , to the first order of approximation, are given by
and
The optimum values of , and , determined by minimizing (39), are given by
The minimum MSE of , at the optimum values of , and is given by
where
Empirical study in stratified random sampling
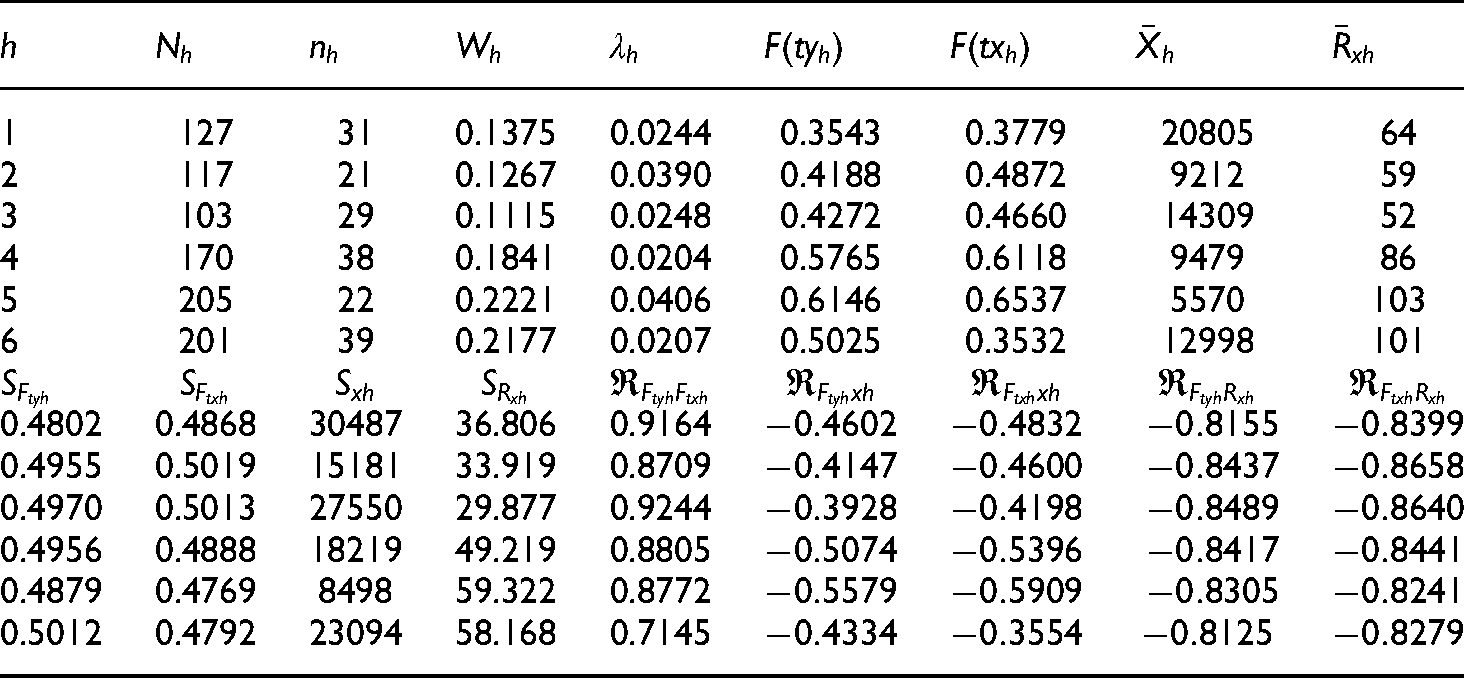
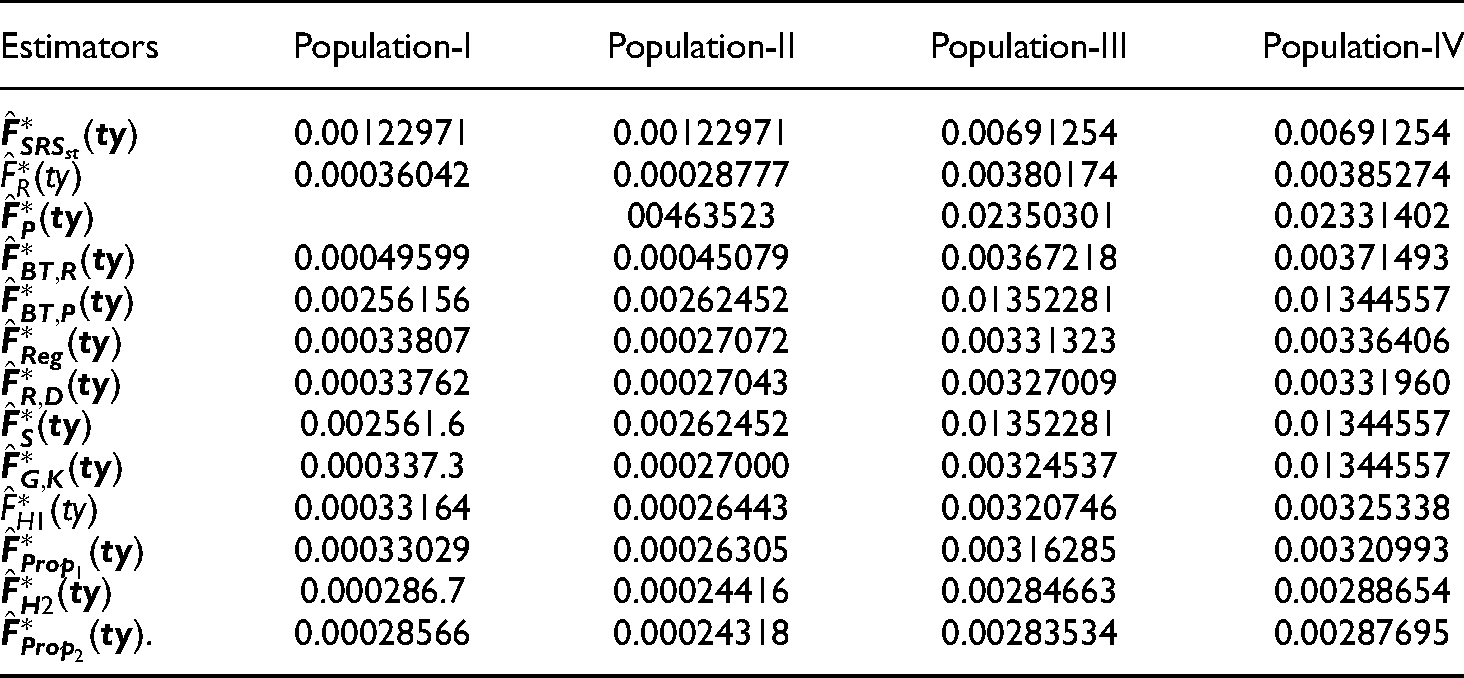
In this section, we conduct a numerical study to investigate the performances of the existing and proposed CDF estimators in stratified random sampling. For this purpose, four populations are considered. The summary statistics of these populations are reported in Tables 1–4. The PRE of an estimator with respect to is
where, .
Summary statistics for Population I.
1
127
31
0.1375
0.0244
0.3543
0.3779
20805
64
2
117
21
0.1267
0.0390
0.4188
0.4872
9212
59
3
103
29
0.1115
0.0248
0.4272
0.4660
14309
52
4
170
38
0.1841
0.0204
0.5765
0.6118
9479
86
5
205
22
0.2221
0.0406
0.6146
0.6537
5570
103
6
201
39
0.2177
0.0207
0.5025
0.3532
12998
101
0.4802
0.4868
30487
36.806
0.9164
0.4955
0.5019
15181
33.919
0.8709
0.4970
0.5013
27550
29.877
0.9244
0.4956
0.4888
18219
49.219
0.8805
0.4879
0.4769
8498
59.322
0.8772
0.5012
0.4792
23094
58.168
0.7145
Summary statistics for Population II.
.
1
127
31
0.1375
0.0244
0.3543
0.3700
498.276
64
2
117
21
0.1267
0.0391
0.4188
0.4700
318.333
59
3
103
29
0.1115
0.0248
0.4272
0.4272
431.359
52
4
170
38
0.1841
0.0204
0.5765
0.5882
311.324
86
5
205
22
0.2221
0.0406
0.6146
0.6146
227.195
103
6
201
39
0.2177
0.0207
0.5025
0.4527
312.706
101
0.4802
0.4847
555.58
36.805
0.8983
0.4955
0.5013
365.45
33.918
0.8666
0.4970
0.4970
613.95
29.877
0.9603
0.4956
0.4936
458.02
49.217
0.9277
0.4879
0.4879
260.85
59.321
0.8764
0.5012
0.4990
397.04
58.167
0.8450
Summary statistics for Population III.
.
.
1
106
9
0.1241
0.1017
0.5849
0.5472
24376
54
2
106
17
0.1241
0.0494
0.5189
0.5660
27422
54
3
94
38
0.1100
0.0157
0.3298
0.3404
72410
48
4
171
67
0.2002
0.0090
0.3684
0.3801
74365
87
5
204
7
0.2389
0.1379
0.4657
0.4657
26442
103
6
173
2
0.2026
0.4942
0.7052
0.7225
9844
87
0.4950
0.5001
49189
30.743
0.7722
0.5020
0.4979
5746
30.743
0.8330
−0.8585
0.4727
0.4764
160757
27.279
0.7854
−0.2957
−0.3087
−0.7509
−0.8208
0.4838
0.4868
285603
49.507
0.7755
−0.1848
−0.1936
0.5000
0.4965
45403
59.033
0.6750
−0.3929
−0.4129
−0.7218
−0.8578
0.4573
0.4490
18794
50.084
0.7319
−0.5598
−0.6102
−0.7290
−0.7755
Summary statistics for Population IV.
1
106
9
0.1241
0.1017
0.5849
0.5189
24712
54
2
106
17
0.1241
0.0494
0.5189
0.5660
26840
54
3
94
38
0.1100
0.0157
0.3298
0.3404
72722
48
4
171
67
0.2002
0.0090
0.3684
0.3743
73191
87
5
204
7
0.2389
0.1379
0.4657
0.4363
26834
103
6
173
2
0.2026
0.4942
0.7052
0.7341
9903
87
0.4950
0.5020
49135
30.743
0.7598
0.5020
0.4979
53979
30.74.
0.8330
0.4727
0.4764
161110
27.279
0.7376
0.4838
0.4854
26249
49.507
0.7871
0.5000
0.4971
45174
59.033
0.6690
.
0.4573
0.4430
18977
50.084
0.7299
.
The mean square error and PREs of distribution function estimators, computed from four populations, are given in Tables 5–6.
From Table 5 and Table 6, in terms of mean squared error and PRE, it is clear that proposed estimators i.e, and performs better than the estimators , , , , , , , , , , and . As we increase the sample size the mean square error values decrease, and percentage relative efficiency gives the best results, which are the expected results.
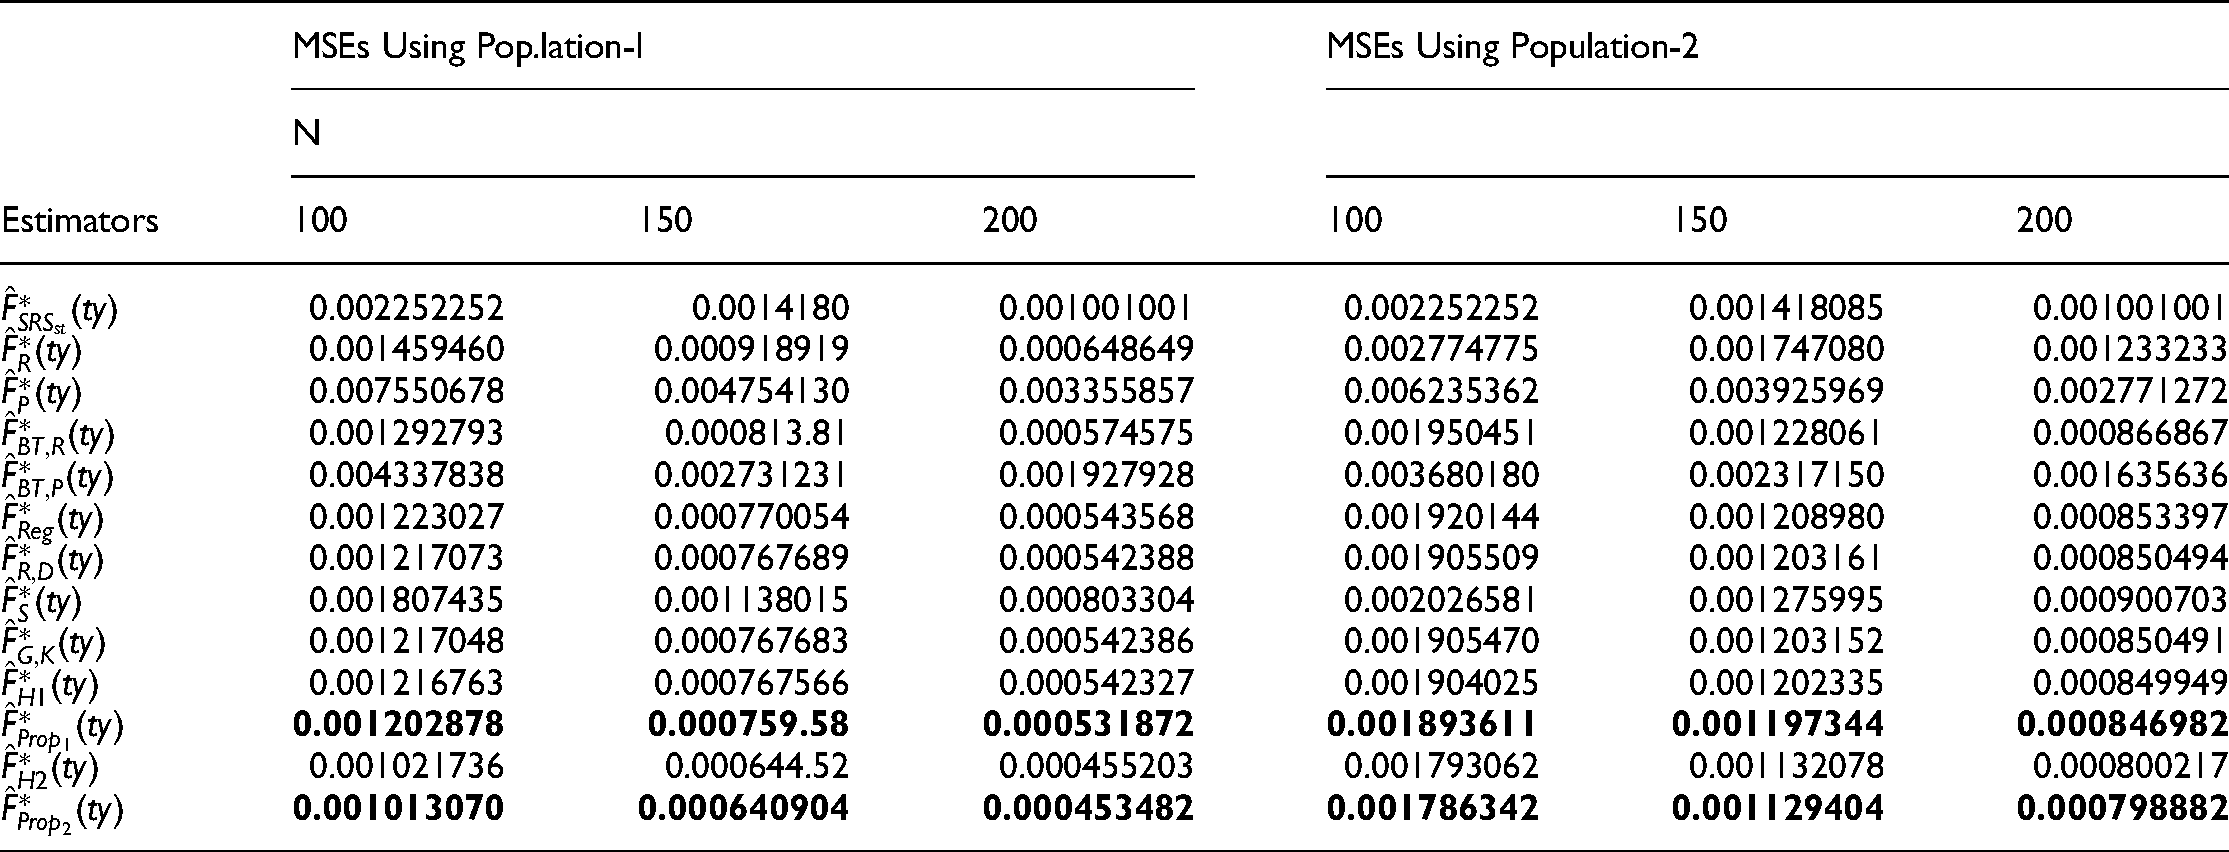
Simulation study
We have generated two populations of size 1000 from multivariate normal distribution with different covariance matrices. The results of simulation are given in Tables 7 and 8. The population means and covariance matrices, are given below:
MSEs using simulation.
Estimators
MSEs Using Pop.lation-I
MSEs Using Population-2
N
100
150
200
100
150
200
0.002252252
0.0014180
0.001001001
0.002252252
0.001418085
0.001001001
0.001459460
0.000918919
0.000648649
0.002774775
0.001747080
0.001233233
0.007550678
0.004754130
0.003355857
0.006235362
0.003925969
0.002771272
0.001292793
0.000813.81
0.000574575
0.001950451
0.001228061
0.000866867
0.004337838
0.002731231
0.001927928
0.003680180
0.002317150
0.001635636
0.001223027
0.000770054
0.000543568
0.001920144
0.001208980
0.000853397
0.001217073
0.000767689
0.000542388
0.001905509
0.001203161
0.000850494
0.001807435
0.001138015
0.000803304
0.002026581
0.001275995
0.000900703
0.001217048
0.000767683
0.000542386
0.001905470
0.001203152
0.000850491
0.001216763
0.000767566
0.000542327
0.001904025
0.001202335
0.000849949
0.001202878
0.000759.58
0.000531872
0.001893611
0.001197344
0.000846982
0.001021736
0.000644.52
0.000455203
0.001793062
0.001132078
0.000800217
0.001013070
0.000640904
0.000453482
0.001786342
0.001129404
0.000798882
PREs using simulation.
Estimators
PREs Using Population-I
PREs Using Population-2
n
N
100
150
200
100
150
200
100
100
100
100
100
100
29.82848
29.82848
29.82848
36.12063
36.12063
36.12063
154.3210
154.3210
154.3210
81.1688
81.1688
81.1688
174.2160
174.2160
174.2160
115.4734
115.4734
115.4734
51.9211
51.921.
51.9211
61.1995
61.1995
61.1995
184.1539
184.1539
184.1539
117.2960
117.2960
117.2960
185.0548
184.7212
184.5543
118.1969
117.8632
117.6964
124.6104
124.6104
124.6104
111.1356
111.1356
111.1356
185.0586
184.7226
184.5551
118.1993
117.8642
117.6969
185.1019
184.7509
184.5753
118.2890
117.9442
117.7719
187.2386
186.6004
188.2034
118.9395
118.4359
118.1845
220.4338
220.0794
219.9022
125.6093
125.2638
125.0911
222.3195
221.2634
220.7368
126.0818
125.5605
125.3002
Population I
and
Population II
and
Covariance matrices shows the distribution of Study Variable Y, the auxiliary variable X and the ranks of the auxiliary variable Rx. There is a high correlation in Population I, and weak correlation in Population II.
We estimate the MSE using k = 1000 samples of diverse sizes selected from each population. Three different sample sizes n = 100, 150, 200 are taken from both populations.
Table 7 shows that the proposed estimators and performs better as compared to all other existing estimators for both populations in terms of MSEs. We have also seen that as the sample size increases MSE of all the decreases
Table 8 shows that the proposed estimators and performs better as compared to all other existing estimators for both populations in terms of the PREs.
Conclusion
In this article, we propose ratio-in-regression type exponential estimator for the finite population distribution function under stratified random sampling, which required an ancillary variable on the sample mean and rank of the auxiliary variable. Expressions for mean square error of the proposed estimator are derived up to first order of approximation and comparison is made with the estimators mentioned herein. According to results of real data sets, and simulation it is perceived that the proposed estimator of (, ) performs better in terms of percentage relative efficiency, than usual estimator of estimator of Hussain et al.,9 Cochran,10 Murthy,11 Bahl and Tuteja,12 regression estimator, Rao,13 Singh et al.,14 and, Grover and Kaur.15
A simulation analysis is also carried out to assess the robustness and generalizability of the propose estimator. The simulation study's findings also confirm the utility of the proposed estimator. A numerical study is carried out to support the theoretical results. Therefore, we recommend the use of proposed estimators for efficiently estimating the finite population finite population distribution function under stratified random sampling.
Footnotes
Declaration of conflicting interests
The author(s) declared no potential conflicts of interest with respect to the research, authorship, and/or publication of this article.
Funding
The author(s) received no financial support for the research, authorship, and/or publication of this article
ORCID iDs
Sohail Akhtar
Sardar Hussain
Author biographies
Mr. Sardar Hussain is a student of M.Phil in the department of statistics Quaid-i-Azam University Islamabad, Pakistan. He has published 14 research papers in the field of survey sampling. His research area includes the estimation of the distribution function and estimation of mean and median under different sampling designs.
Dr. Sohail Akhtar is working as an Associate Professor in Statistics at the Department of Mathematics and Statistics, the University of Haripur, Haripur, KP, Pakistan. He received his Ph.D. degree from the University of Salford, the UK in 2012. He has more than 18 years of teaching and research experience. His area of interest is Forecasting, Biostatistics, Statistical Modelling, and Survey sampling.
Dr. Mahmoud El-Morshedy is a Professor in the Department of Statistics at Mansoura University, Mansoura, Egypt. He is also affiliated with the Department of Mathematics, College of Science and Humanities in Al-Kharj, Prince Sattam bin Abdul-Aziz University, Al-Kharj 11942, Saudi Arabia. He has published around 117 research papers in the field of distribution theory. His research area includes Probability Distribution Theory, Statistical Modelling, Multi-variate Analysis, Hypothesis Testing, and Computational Statistics.
References
1.
ChambersRLDunstanR. Estimating distribution functions from survey data. Biometrika1986 Dec 1; 73: 597–604.
2.
RaoJNKovarJGMantelHJ. On estimating distribution functions and quantiles from survey data using auxiliary information. Biometrika1990 Jun 1; 70: 365–375.
3.
RaoJN. Estimating totals and distribution functions using auxiliary information at the estimation stage. J Off Stat1994 Jun 1; 10: 153.
4.
KukAY. A kernel method for estimating finite population distribution functions using auxiliary information. Biometrika1993 Jun 1; 80: 385–392.
5.
AhmedMSAbu-DayyehW. Estimation of finite-population distribution function using multivariate auxiliary information. Stat Transit2001; 5: 501–507.
6.
RuedaMMartínezSMartínezH,et al.Estimation of the distribution function with calibration methods. J Stat Plan Inference2007 Feb 1; 137: 435–448.
7.
SinghHPSinghSKozakM. A family of estimators of finite-population distribution function using auxiliary information. Acta Appl Math2008 Nov; 104: 115–130.
8.
HussainSZichuanMHussainS,et al.On Estimation of Distribution Function Using Dual Auxiliary Information under Nonresponse Using Simple Random Sampling, Journal of Probability and Statistics, vol. 2020, Article ID 1693612, 13 pages, 2020. https://doi.org/10.1155/2020/1693612.
9.
HussainSAhmadSSaleemM,et al.Finite population distribution function estimation with dual use of auxiliary information under simple and stratified random sampling. Plos one2020 Sep 28; 15: e0239098.
10.
CochranWG. The estimation of the yields of cereal experiments by sampling for the ratio of grain to total produce. J Agric Sci1940 Apr; 30: 262–275.
11.
MurthyMN. Product method of estimation. Sankhyā: the Indian journal of statistics. Series A1964 Jul 1; 26: 69–74.
12.
BahlSTutejaR. Ratio and product type exponential estimators. J Inform Optim Sci1991 Jan 1; 12: 159–164.
13.
RaoTJ. On certail methods of improving ration and regression estimators. Commun Stat-Theory Method1991 Jan 1; 20: 3325–3340.
14.
SinghHPKumarS. A general procedure of estimating the population mean in the presence of non-response under double sampling using auxiliary information. SORT-Stat Oper Res Trans2009 Dec 10; 33: 71–84.
15.
GroverLKKaurP. A generalized class of ratio type exponential estimators of population mean under linear transformation of auxiliary variable. Commun Stat-Simul Comput2014 Jan 1; 43: 1552–1574.
16.
KadilarCCingiH. Ratio estimators in stratified random sampling. Biometrical J: J Math Methods Biosci2003 Mar; 45: 218–225.
17.
KadilarCCingiH. A new ratio estimator in stratified random sampling. Commun Stat—Theory Methods2005 Mar 1; 34: 597–602.
18.
KoyuncuNKadilarC. Ratio and product estimators in stratified random sampling. J Stat Plan Inference2009 Aug 1; 139: 2552–2558.
19.
ShabbirJGuptaS. On estimating finite population mean in simple and stratified random sampling. Commun Stat-Theory Methods2010 Dec 6; 40: 199–212.
20.
AladagSCingiH. Improvement in estimating the population median in simple random sampling and stratified random sampling using auxiliary information. Commun Stat-Theory Methods2015 Mar 4; 44: 1013–1032.
21.
MalikSSinghR. A new estimator for population mean using two auxiliary variables in stratified random sampling. J Inform Optim Sci2017 Nov 17; 38: 1243–1252.