
Abstract
To explore the propagation characteristics of acoustic emission (AE) signals in wood at different angles. The AE signals at different angles were obtained by changing the angle of incidence by sawing the inclined surfaces at different angles. The Zelkova schneideriana specimen was sawn 5 times with an increment of 15°, and 5 different incidence angles were obtained. AE signals were collected by 5 sensors arranged equally on the surface of the specimen, AE energy and energy attenuation rate were calculated. The reflection signals corresponding to different angles were collected on the uncut specimen by changing the position of the sensors, and the propagation speed of the AE signals at different angles was calculated. The results showed that the kinetic energy provided by the external excitation is small, and the AE energy is mainly provided by the displacement potential energy. With the change of the incidence angle, the AE kinetic energy changes significantly. With the increase of the reflection angle, the speed of the reflected wave also continued to increase, and finally stabilized at 4600 m/s.
Introduction
Wood is widely used in people’s lives as a natural and renewable environmental material, but influenced by external environmental temperature, humidity, etc., the structure of wood material can be damaged easily. Therefore, it is particularly important to monitor the structural health of wood. Dynamic monitoring of materials by acoustic emission (AE) technology has always been a hot issue in the industry. As an active dynamic nondestructive testing (NDT) method, AE technology can carry out real-time dynamic monitoring of materials without damaging the monitoring objects, and makes an objective evaluation of the structural health of the material. 1 AE technology has been widely used in damage monitoring of metal, rock and composite materials to evaluate the damage of materials.2–4 It has also been used for monitoring the condition of equipment and manufacturing processes.5,6 AE has also been gradually used in the monitoring of wood materials, such as the aspect of the monitoring of wood cultural relics, 7 wood drying, 8 processing 9 and so on. Nasir et al. 10 gave a more complete overview of the application of AE technology in wood structural health monitoring, describing 6 applications of AE technology in wood processing, wood drying, wood fracture, wood structure, wood pests, and wood quality monitoring, and showed that the focus should be on the use of AE for monitoring large structural defects.
When the material is damaged, it will release energy in the form of stress waves, thus transitioning to a low-energy steady-state stage, and this phenomenon of releasing strain energy in the form of stress waves is called AE. 11 AE monitoring is an important NDT tool to track the evolution of material damage, and has been widely used in wood science.12,13 As early as 1982, Ansell 14 applied AE to the damage monitoring of wood, and found that the amplitude of AE signal decayed with increasing distance during propagation, and it showed a significant exponential decay. With the wide application of wood-based composites, more and more researchers begin to turn the research object to wood, and use AE to explore the basic properties and the damage fracture of wood. Li et al. 15 explored the influence of moisture content (MC) on the propagation speed and energy of AE signal. The result shown that the AE signal propagation speed decreases with the increase of MC, while the AE energy attenuation increases significantly during the propagation. The attenuation rate of AE energy showed a significant linear relationship with the increase of MC, indicating that the change of MC had a significant influence on the propagation speed and energy of wood AE signal. El-Hadad et al. 16 studied the effect of wood type, input signal frequency, signal transmission distance and wood health condition on AE signals. Ding et al. 17 explored the fracture process of wood using information entropy and showed that the energy release of wood during fracture was stochastic in nature. Lai et al. 18 combined AE with image processing techniques to explore the randomness of crack generation in wood during fracture using fractal theory. Huang et al. 19 explored the effect of wood surface crack size and distribution on transverse waves using AE to provide a useful reference for wood damage localization. Meanwhile, to more accurately characterize the damage state of materials, many researchers have combined AE sensors with other types of sensors to further increase the accuracy of detection. For example, Liu et al. 20 used a piezoelectric sensor to detect axial compression damage in wood; Fu et al. 21 used a Bragg fiber grating (FBG) AE sensor to detect polymers in explosives.
Wood is often used as a load-bearing component, which can develop microcracks under fatigue, overload or creep loading, leading to structural damage. Therefore, it is necessary to monitor the in-service components to avoid accidents. Lamy et al. 22 used AE to monitor the damage and fracture process of wood, and used AE event number and ringing count to characterize different damage degrees of wood. Ando et al. 23 compared the fracture characteristics of new and old wood using the AE technique, and indicating that old wood produced significantly more AE events during fracture than new wood. Moreover, the old wood had a long period to generate small amplitude AE signals and experienced a long microcrack generation and extension process. To characterize the wood fracture process more clearly, some researchers have combined AE signals with image recognition,24,25 machine learning, 26 and neural networks. 27 By doing this, it can identify the extent of damage to wood and classify damage stages more precisely, so as to provide more diverse methods for monitoring the health of wood structures. To understand the propagation characteristics of AE signals in wood, Wang et al. 28 carried out the simulation test of wood damage, and verified the effectiveness of using pencil-lead break (PLB) as a simulated damage source. Meanwhile, Ding et al. 29 used PLB to generate AE sources and used correlation singular spectrum analysis (SSA) to perform a linear localization study of the damage source, which effectively improved the localization accuracy. At present, most researchers used the time difference of arrival (TDOA) of AE signal to calculate the propagation speed, and then determined the location of AE source according to the position relationship of sensors.30,31 Wang et al. 32 showed that AE signals propagate with different velocities in different directions due to the nature of the wood. Therefore, when considering the propagation speed of AE signal in wood, it is necessary to clarify the propagation direction. Knauss et al. 33 proposed that the dissipation of acoustic energy and the amplitude attenuation during propagation will be more obvious in viscoelastic and porous media materials. The internal structure of wood is loose and porous, and has viscoelasticity, which characterizes the random process of AE energy propagation in wood. Li et al. 34 used PLB as the simulated AE source to characterize the trend that with the increase of distance, the energy decreased, the results showed that the surface transverse wave and internal longitudinal wave showed exponential attenuation law.
At present, the angle change is not considered when exploring the propagation characteristics of AE signals in wood, and the studies on AE incidence angle generally only consider the case of vertical or horizontal incidence. Therefore, to study the effect of angle change on AE signal propagation in wood, the incident angle was changed by sawing different bevels. At the same time, the signal generator and PLB were used as AE sources to generate burst AE signal, and the PLB tests refer to ASTM-E976 standard to investigate the propagation characteristics of AE signals in wood at different incidence angles. The wood belongs to a volume limited material, and there is a clear boundary. The AE signal propagates in the form of diffusion wave in the wood, which will produce obvious reflection at the wood boundary. PLB was used to explore the propagation speed under different reflection angles, indicating that wood had obvious anisotropy, which provided reference for the subsequent study of propagation characteristics in different directions.
Materials and methods
Experimental materials and equipment
Zelkova schneideriana with straight texture and no surface defects was selected as experimental material. Two regular sawing specimens were made, with dimensions of 800 × 60 × 30 mm (L × W × T), and the density and MC of the specimens were the same. Density is 0.69 g/cm3, MC is approximately 11% to 12%.
A 5-channel AE signal acquisition system was built with NI USB-6366 high-speed acquisition card (National Instrument) and LabVIEW software. The output voltage of the acquisition card was −10 V to 10 V, and the maximum sampling frequency was 2 MHz. The type of sensor used is RS-2A single-ended resonant AE sensor (Beijing Softland Times Scientific&Technology Co., Ltd), and its frequency range is 50 kHz to 400 kHz. Meanwhile, to ensure the stability of signal transmission, a 40 dB PAI preamplifier (Beijing Soundwel Technology Co., Ltd) was equipped for each channel to amplify the acquired AE signal. According to the Nyquist sampling theorem, only when the sampling frequency fs is twice higher than the maximum frequency fmax of the original signal, the signal represented by the digital signal can be restored to the original signal. The higher the fs is set, the better the waveform quality can be obtained. According to relevant studies,35,36 the highest frequency of AE signal propagation in wood is concentrated at 200 kHz. Therefore, the sampling theorem was satisfied by setting fs ≥ 400 kHz. In this study, to obtain the waveform with higher quality, the sampling frequency fs was increased to 2 MHz.
To ensure the stability of the generated signal, a SIGLENT SDG805 single-channel signal generator (Shenzhen Siglent Technologies Co., Ltd) was used to output a pulse signal to simulate the AE signal generated by wood damage. The maximum output frequency of 5 MHz, a maximum sampling rate of 125 MSa/s, and an output voltage range of 4 mV to 20 V. To ensure the stability of the received signal of the AE sensor, the frequency of the set output pulse signal was the same as the central resonant frequency of the AE sensor of 150 kHz.
Experimental method
According to the elastic wave theory, there is a significant boundary effect for materials with finite volume. During the propagation of the elastic wave, the interaction between the wave and the boundary occurs when the boundary is encountered, which leads to a change in the propagation direction of the elastic wave in the specimen to produce a reflected wave.
37
The reflection phenomenon is mainly related to the density difference of the medium on both sides of the boundary, the greater the density difference the more energy is reflected, and vice versa, the smaller. When the external force acts on the surface of the specimen, the elastic wave diffuses in the form of spherical wave in the specimen, causing vibration of each particle.
38
Thus, resulting in displacement signals, which can be collected by the AE sensor. The specimen thickness used in this experiment is only 30 mm, and the sensors were arranged on a narrow surface, as shown in Figure 1. The wavefront produced by elastic waves is close to a plane, so the spherical wave can be approximated as a plane wave in the analysis. According to Snell law, the reflection angle α′ of AE signal is equal to the incident angle α, as shown in Equation (1), where c is the propagation speed of AE signal in wood, that is, the incident speed and the reflection speed are equal.


Test schematics. (a) With the change of the cut surface thus changing the AE source position, keeping the sensor positions S1–S5 the same. (b) Break the lead at point o as AE source, o, a point position remains as same, change sensor S3, S4, S5 position, always form triangle oab.
To investigate the effect of different incidence angles on the AE signal energy attenuation, an experimental scheme was designed as shown in Figure 1(a). The incident angle was changed by cutting the left end of Zelkova schneideriana from 5 different angles of 15°, 30°, 45°, 60° and 75°. The signal generator and the PLB were used as the simulated AE source in the middle of the tangent plane, and the sensor connected by the signal generator was always perpendicular to the oblique plane. The influence of different incident angles on the propagation characteristics of AE signals under forced vibration was studied, and the PLB was used as the simulated AE source at the same position. The PLB generates a broadband signal, which was more complex and closer to the AE signal generated by wood damage. At the same time, the energy produced by the PLB can be decomposed into kinetic energy and potential energy, and the decay of the kinetic energy produced by PLB in the wood can be characterized. Due to the viscoelasticity of wood itself, AE signal will be significantly attenuated during the propagation process. 39 Therefore, to reduce the influence of the material itself, 5 sensors were used to collect the AE signals, and 5 sensors were equidistantly distributed. To ensure that all sensors can collect AE signals, the spacing was set to 70 mm and located on the same line, and the S1 sensor was 50 mm away from the edge line on the section.
The propagation of elastic wave in wood will produce reflection phenomenon. To study the change of reflection speed of AE signal at different angles, an experimental was designed as shown in Figure 1(b). To explore the AE signals corresponding to different angles without destroying the detection object, and the PLB was used as the simulated AE source. To ensure the consistency of AE sources during the test, the pencil-lead with diameter of 0.5 mm was placed at a 30° angle with the specimen surface according to the ASTM-E976 standard, and the pencil-lead was broken at 2.5 mm away from the contact point. The AE source was 50 mm away from the left end face, sensors S1 and S2 were used t0 determine the time t0 of PLB, as shown in Equation (2). Where d1 was the distance between AE source and sensor S1 100 mm; d2 was the distance between S1 and S2 200 mm; t1 and t2 were the time when AE signals arrived at S1 and S2 sensors. Thus, Equation (2) was simplified to obtain Equation (3), and the expression of the relationship between t0 and t1 and t2 can be established, to determine the PLB time t0. Therefore, the arrival time of reflection wave can be obtained according to t0, so as to calculate the speed of reflection wave.


Sensor position distribution.

Results and discussion
Standing wave propagation characteristics
According to the elastic wave theory, AE signal will form a relatively stable standing wave form after a short transition process. Standing wave is a wave formed by the superposition of two waves with the same amplitude and frequency propagating in the opposite direction, and one of them is generally the reflection wave of another wave. Standing wave is not a wave in the true sense. Its average energy flow density is equal to zero, and the energy can only travel back and forth between the nodes and the wave abdomen. Its nodes are static, so waveform does not travel forward, and each particle only vibrates at own equilibrium position. y1 is an incident wave propagating to the right, and y2 is a reflected wave propagating to the left at the point at the wave source of y1. Where A is the amplitude of AE signal corresponding to a certain time point t, T is the period, x is the distance between any two acquisition sensors, λ is the wavelength.


AE waveform of displacement, speed and acceleration. From left to right are the displacement signal, speed signal and acceleration signal, respectively, and from top to bottom are the waveforms collected by sensors S1–S5.
To clarify whether there is speed and acceleration in this part of the displacement signal, the derivative of Equation (7) was calculated. The first derivative of displacement function is speed function Equation (8), and the second derivative is acceleration function (9).

To determine the spectrum components of this part of the stable signal, the fast Fourier transform was used to analyze this part of the signal. As shown in Figure 3, the sensors S1 to S5 were shown from top to bottom. The principal components of the 5 sensors were all at low frequency less than 7 kHz, and were independent of the distance from the sensor to the AE source. It was shown that after the external excitation was generated, the wave propagation in the wood will transit to a steady state process, and forming a relatively stable and low frequency standing wave.
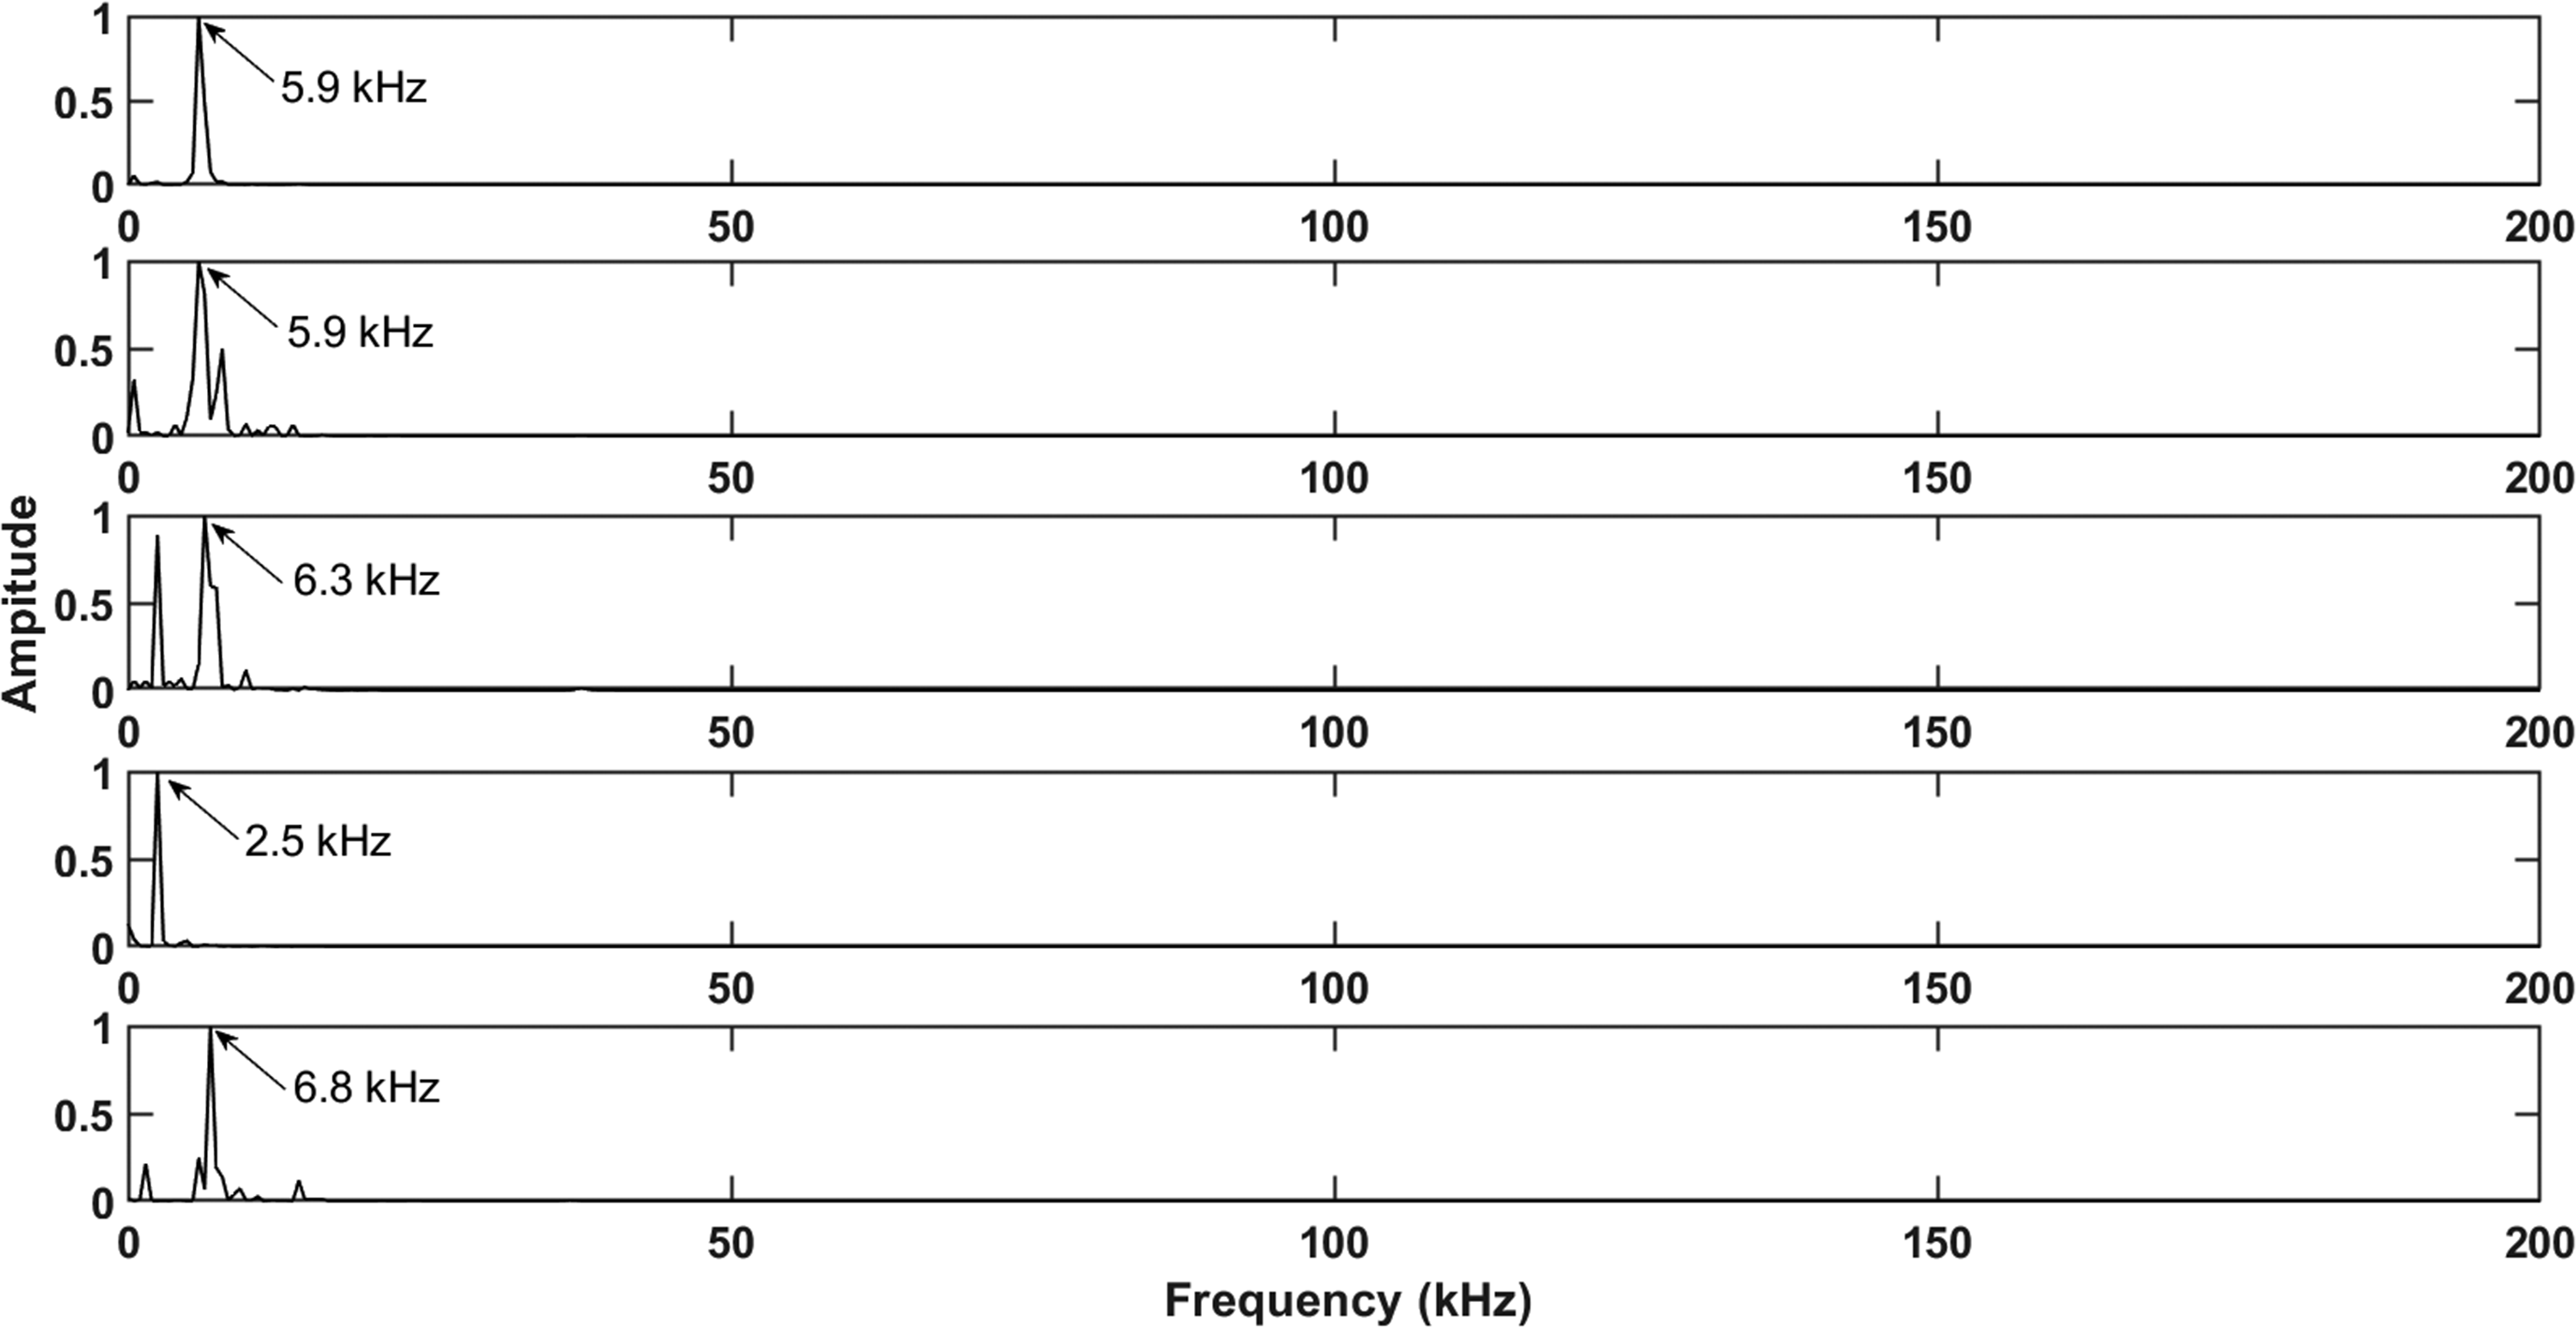
Standing wave spectra. The spectra after intercepting the Fourier transform of the standing wave components, from top to bottom, corresponding to sensors S1–S5, respectively.
Energy attenuation of AE signal under different incident angles
To study the energy attenuation characteristics of AE signals with different incident angles, the oblique planes were cut at the end face of the specimen to form AE signals with different incident angles. The inclination angles of the sawing oblique planes were 15°, 30°, 45°, 60° and 75°, respectively. The signal generator was used to incident vertically on the inclined plane, and the incident angle changed with the change of inclined angle. The signal generator adopted 150 kHz single pulse burst signal, pulse width was 1 μs, cycle time was 1 s. In the course of the test, the AE source position was changed with the change of slope angle, while other test conditions were kept constant, so as to ensure the stability of the generated signal. AE signals at different incident angles were collected by 5 sensors on the specimen surface, and then the AE energy of the 5 sensors was calculated. Since the acquired AE signal was amplified by 40 dB, it was reduced to real energy and the energy attenuation rate was calculated to characterize the AE energy variation at different angles.
To investigate the effect of angle change on AE energy, the AE signal energy was calculated. When the AE source was generated, the original signals collected by the sensor were displacement signals, which represented the displacement of the particle inside the wood. The energy represented by the displacement signal was the sum of kinetic energy and potential energy. When the elastic wave propagates in the medium, each volume element in the medium vibrates near own equilibrium position, so each volume element has kinetic energy. The sum of the kinetic energy of each volume element vibration and the elastic potential energy of each volume element deformation is the energy of the wave. The vibration kinetic energy of a particle in the medium is 


The total fluctuation energy E of the volume element is the sum of vibration kinetic energy and potential energy, namely E = Ek + Ep. In the process of wave propagation, any volume element continuously receives energy from the former volume element, and continuously releases energy to the latter volume element. That is, continuously receiving and transmitting energy, and the mechanical energy of any volume element is not conserved, so the fluctuation process is the process of energy transmission, and fluctuation is a way of energy transmission. To quantitatively characterize the kinetic energy change process under different incident angles, the kinetic energy of 5 sensors was expressed in the same figure, as shown in Figure 4. To avoid the chance of the test, the mean value was calculated after repeating the test for 10 groups, and the data in the paper are expressed using the mean value.

Kinetic energy corresponding to different incidence angles.
Figure 4 shows the kinetic energy distribution of 5 sensors corresponding to different incident angles. It is obvious that the AE kinetic energy collected by sensors S1 and S2 increases with the increase of angle, while the kinetic energy change pattern of the 3 sensors at a farther distance is different from the previous 2 sensors. The energy produced in the initial propagation phase is larger, 34 and the S1 and S2 sensors are closer together and show similar regularity of propagation. And with increasing the angle of incidence, the energy lost at the surface becomes less and less, changing from surface propagation at small angles to internal propagation at large angles. 41 However, as the propagation distance increases, it is affected by the internal viscosity of the wood. The AE signal appears distorted and superimposed, resulting in irregular changes in the kinetic energy of the latter 3 sensors. The AE signal is more susceptible to variations in the AE signal during long-distance propagation as the AE signal is normally attenuated by the material itself.42,43 However, because wood belongs to anisotropic material, the kinetic energy change rules of the 3 sensors far away were inconsistent. To clearly explain this change, as shown in Figure 5, slice dyeing was performed on the used Zelkova schneideriana specimen, and the internal structure of wood was observed by electron microscope. It can be clearly seen that wood rays and wood fibers crisscross vertically and horizontally inside the wood, and there are also some cavity structures, resulting in the unevenness of wood. Comparing the microstructure maps of transverse section and radial section, it can be obviously found that the arrangement of internal structure is completely different, which makes wood exhibit anisotropy. This eventually leads to differences in AE kinetic energy corresponding to different incidence angles, and variations in the AE signals collected by the sensors at different distances.

Macroscopic and microscopic structure of Zelkova schneideriana: (a) solid wood sawn timber, (b) cross-sectional microstructure and (c) radial section microstructure.
It can be seen from Figure 4 that the vibration caused by the signal generator, the AE signal carries very little kinetic energy. To clearly characterize the real energy carried by AE signals, the sum of kinetic energy and potential energy was plotted in the same figure (Figure 6). The AE energy was larger in the S1 sensor, but with the change of the incident angle, the AE energy of S1 and S2 sensors did not show regular changes, which was more chaotic compared to the kinetic energy variation. Significant energy attenuation occurs between sensors S1 to S2, while the AE energy attenuation rate gradually slows down in sensors S3 to S5. This is due to the rapid attenuation of the high-frequency components of the AE signal at short distances, 44 which becomes slower as the propagation distance increases and the AE signal is dominated by standing wave. Comparing the vertical coordinates of Figures 4 and 6, it was apparent that the sum of AE energy was much larger than the kinetic energy. Indicating that the kinetic energy provided by the signal generator was very small, and the energy was mainly provided by the displacement potential energy of the particle. Kinetic energy can be neglected relative to potential energy, and this did not affect the change law of the AE energy, therefore, when characterizing AE signal energy, only potential energy can be considered, and kinetic energy can be ignored. After the forced vibration of the signal generator, the internal particle produces obvious displacement and transmits to the next particle, resulting in an increase in potential energy. At the same time, due to the damping inside the wood, the vibration of the particle will be hindered, and the standing wave will be formed during the transition to the steady state. The energy carried by standing waves was recorded in the potential energy, so the potential energy was large.

Total energy at different incidence angles.
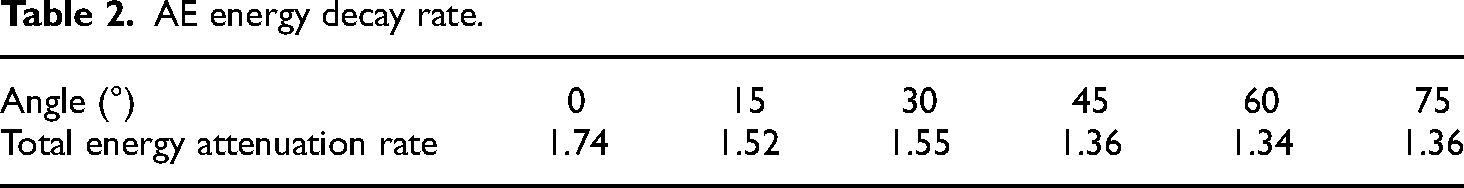
When the AE signal propagates in wood, the AE energy decays rapidly due to the viscosity of the wood. The attenuation of AE energy varies obviously with the distance and position, and the initial energy generated by the AE source was completely the same in the experiment. The energy reaching the S1 sensor changes significantly with the change of incident angle, indicating that the change of AE source position had an extremely obvious influence on AE energy. Zheng et al. 45 varied the incident angle of the lamb wave from 0° to 90° and showed that the scattered wave energy all appeared to decay rapidly when incident at the crack. To characterize the decay of AE energy at different angles, the decay rate of AE energy at different angles was calculated by the sum of kinetic energy and potential energy. Since the kinetic energy provided by the signal generator was extremely small and did not affect the variation law of AE energy, the AE energy was used to calculate the attenuation rate. The corresponding AE energy attenuation rates at different angles were shown in Table 2. The AE energy attenuation rate was the largest when the inclination angle was 0°, that is AE signals were incident from the direction perpendicular to the wood texture. This is because of the presence of cavity structure inside the wood, which acts as an obstacle to the propagation of AE signals.46,47 And energy exchange occurs with the surface fluid when the AE signal propagates along the wood surface, resulting in the maximum attenuation rate. With the increase of the angle, the AE energy attenuation rate gradually decreased. The AE signal transmitted from the surface gradually shifts to the internal propagation along the texture direction, and the AE energy loss decreased.
AE energy decay rate.
Concomitantly, combined with Figure 5, it can also be shown that wood has obvious anisotropy, and there are different energy attenuation rates at different incident angles, indicating that the change of propagation path has a significant effect on AE energy attenuation. Changing the angle of incidence has been more widely used in ultrasonic inspection, based on the different angles of incidence of the signal to the source of the damage is more accurate positioning, reducing the rate of missing small defects and improving the accuracy of detection. Wu et al. 48 used oblique incidence ultrasound to detect the performance of bonded structures and showed that angular incidence is more sensitive to detect defects compared to vertical incidence. Researchers used small-angle ultrasonic longitudinal waves to detect small cracks in fatigue and showed that the detection sensitivity of small-angle incident ultrasonic longitudinal waves is higher. 49 While Wang et al. 50 used ultrasonic oblique incidence to probe the propagation properties of materials at different incidence angles and to construct a model of the relationship between different incidence angles and reflection and transmission.
AE signal reflection
Wood specimens used in this study were 800 × 60 × 30 mm (L × W × T) with clear and regular boundaries. According to elastic wave theory, reflected wave refers to the reflection and refraction of wave at the interface of medium with different densities. The difference of medium density on both sides of the interface is the main reason for determining the reflection and refraction of wave. The larger the medium density difference, the larger the reflection of AE signal, and vice versa. The external air density of wood is 1.29 × 10⁻³ g/cm3, and the density of Zelkova schneideriana specimens used was 0.69 g/cm3. The density difference between the 2 mediums was large. Therefore, when AE signals propagate in wood, there will be obvious reflection at the boundary of the specimen. According to the Snell theorem, the speed of incident wave is equal to that of reflected wave. To investigate the reflection of AE signal in wood, the propagation speed of AE signal in wood was studied by using PLB as AE source. The generation time t0 of AE source was determined by the S1 and S2 sensors in Figure 1(b), so as to calculate the propagation speed of AE signal at different reflection angles. Since the propagation process can produce obvious standing wave signals, it was inappropriate to calculate the propagation speed of AE signals by correlation analysis. Therefore, the propagation speed at different distances was calculated by the TDOA of AE signal reaching the 2 sensors. To avoid the error caused by the test process, 10 independent tests were conducted at each angle. Then, the average value was taken as the final reflection speed, and the reflection velocities at different angles were fitted in the same diagram (Figure 7). The distance between the bottom edge ab and the reflection speed were fitted, and the change of the bottom edge distance indicates different reflection. The obtained fitting function was shown in Equation (13), and the goodness of fit reached 0.9987.

Reflected speed fitting curve.
The reflected speed fitting curve is shown in Figure 7. As the distance between the 2 points of the bottom edge ab increases, that is the corresponding reflection angle increases accordingly, and the speed shows an increasing trend until it becomes stable. When ab ∈ [149 mm, 340 mm], the reflection angle was less than 60°, the reflection speed shows a linear increase trend; When ab ∈ [149 mm, 340 mm], that is reflection angle α′ ∈ [78°, 80°], the increasing trend of reflection speed gradually becomes slow; when α′ exceeds 80°, the reflection speed finally tends to be stable, and the stable reflection speed is close to the propagation speed of longitudinal wave in wood. It shown that the larger the reflection angle was, the closer the reflection speed was to the longitudinal wave propagation speed, which was related to the arrangement of wood internal structure. Combined with the analysis in Table 1, with the increase of α′ and α′ angles, the propagation distance Δs also increases. As shown in Figure 7, the reflection speed also increases. When the AE source was perpendicular to the texture, the AE signal was collected on the opposite side, and the obtained speed was the smallest. This is because the vertical texture direction is loose and porous, which makes the resistance of wave propagation in the internal larger, resulting in more serious attenuation. With the increase of the angle, the AE signal propagated along the texture direction in the interior. Although the propagation distance Δs increased gradually, the attenuation of AE signal was smaller when the propagation resistance decreased. At the same time, the results also characterized the anisotropy of wood, which provides a reference for the further study of AE signal propagation characteristics in different directions.
Conclusions
In this paper, a signal generator and PLB were used to generate a simulated AE source using Zelkova schneideriana specimens as the test material. To study the effect of incident angle on AE signal propagation and the relationship between reflection angle and speed.
Exploring the AE propagation characteristics at 5 angle variations of 15°, 30°, 45°, 60° and 75° on Zelkova schneideriana specimens and decomposing the AE energy. It is shown that the AE energy was mainly provided by the displacement potential energy, and the kinetic energy generated was minimal. With the increase of the incident angle, the AE energy attenuation rate decreases gradually, and the energy attenuation rate is 1.74 and 1.36 at the incident angles of 15° and 75°, respectively. The variation of the incident angle changes the attenuation characteristics of the AE energy, indicating that the angle has an effect on the AE signal propagation. The relationship between reflection angle and reflection velocity was also explored to construct a mathematical model of reflection angle and speed. In the research process, it was found that AE signal propagation in wood generates standing waves, and the displacement function was derived to determine the propagation characteristics of the standing waves. This proves that there is no speed and acceleration during the propagation of the standing wave, that is no external force is acting on the standing wave when it is generated. The process of transitioning to a steady state is by resonance of the internal mass of the wood and the resulting standing wave. Therefore, to exclude the effect of standing waves when studying the effect of different reflection angles on AE characteristics, the time difference of wave arrivals was used to calculate the reflection speed of AE signals in wood. The reflection speed increases with increasing angle and finally stabilizes, approaching the propagation speed of longitudinal waves in wood. At the same time, the energy attenuation and speed variation patterns at different angles were also used to further illustrate the anisotropy of the wood and provide reference for subsequent studies on damage source localization.
In this paper, in the process of studying the effect of incident angle on the propagation characteristics of AE signals, the study material is corrupted. Therefore, damage to the test object should be avoided in the subsequent study to achieve the research objectives. The effect of incident angle on AE signal propagation and the model of reflection angle and speed constructed in this paper, it will be useful for the subsequent study of AE signal reflection and localization in wood. The angle has a more pronounced effect on energy and speed, so the effect of both needs to be considered in the study.
Footnotes
Declaration of conflicting interests
The author(s) declared no potential conflicts of interest with respect to the research, authorship, and/or publication of this article.
Funding
The author(s) disclosed receipt of the following financial support for the research, authorship, and/or publication of this article: This work was supported by the National Natural Science Foundation of China [No. 32160345, No. 31760182].
Startup fund for introducing talents and scientific research of Anhui University of Engineering [No. 2021YQQ037].
Yunnan Provincial Key Laboratory of Wood Adhesives and Wood Products, ‘111 Project’, [No. D21027].
Author biographies
Ming Li, male, born in May 1977, PhD, professor, doctoral supervisor. He is the executive director of Forestry Machinery Branch of China Forestry Society, the deputy director of Yunnan Province Machinery Teaching Steering Committee, the member of Yunnan Province Undergraduate Professional Construction Expert Advisory Committee, the provincial expert of Yunnan Province Industrial Information Committee, the special professor of Yuxi Normal College, the editorial board member of Forestry Machinery and Woodworking Equipment, and the senior member of Chinese Mechanical Engineering Society.
Changlin Huang, male, born in August 1997, master's degree student, engaged in acoustic emission nondestructive testing research.
Saiyin Fang, female, born in October 1981, is an associate professor and master's supervisor, with research interests in acoustic emission nondestructive testing and intelligent optimization algorithms.
Yue Zhao, female, born in October 1997, master's degree student, engaged in acoustic emission nondestructive testing research.
Ning Xu, female, born in August 1998, master's degree student, engaged in acoustic emission nondestructive testing research.
Gezhou Qin, male, born in February 1999, master's degree student, engaged in acoustic emission nondestructive testing research.
Feilong Mao, male, born in May 1997, master's degree student, engaged in acoustic emission nondestructive testing research.