
Abstract
After a catastrophic failure of the weld of the anchoring element of one cable in a stayed bridge, a non-destructive inspection was required to evaluate the weld condition of the 111 remaining anchoring elements to prevent future and similar failures. This examination was quite complicated since the anchoring elements are partially embedded in the reinforced concrete tower, and the weld is fully integrated into the concrete. Considering that direct access to the weld was not possible, acoustic emissions (AE) were a feasible alternative for these inspections. This study describes the inspection method, from laboratory tests simulating actual conditions for calibration to field tests for the method's tuning and evaluation. The AE inspection results are presented, and welds’ condition is classified according to the acoustic energy, measured through a severity index and graded from a zonal intensity plot. Two structural elements were selected for concrete demolition to expose the weld for penetrant and ultrasonic inspections to correlate measurements of the actual condition of the welds and their defect size. Because of the analysis, welds are identified for immediate repair and the rest for AE monitoring to evaluate defect evolution through the increase of the severity index.
Keywords
Introduction
The Rio Papaloapan Bridge is a cable-stayed structure in Mexico, commissioned in 1994, and, since then, it is an essential part of the highway that connects the southeast of Mexico. It has a main span of 203 m and a total length of 407 m with 112 cables distributed in 8 semi-harps, identified as indicated in Figure 1. The anchoring system designed by Astiz 1 consists of a steel plate with welded anchoring elements on each side. The anchoring elements are cylindrical on one side and screwed down to the cable-clamping collar. On the other side are flat and welded to the steel plate (Figure 2).

Semi-harps in the Rio Papaloapan Bridge.
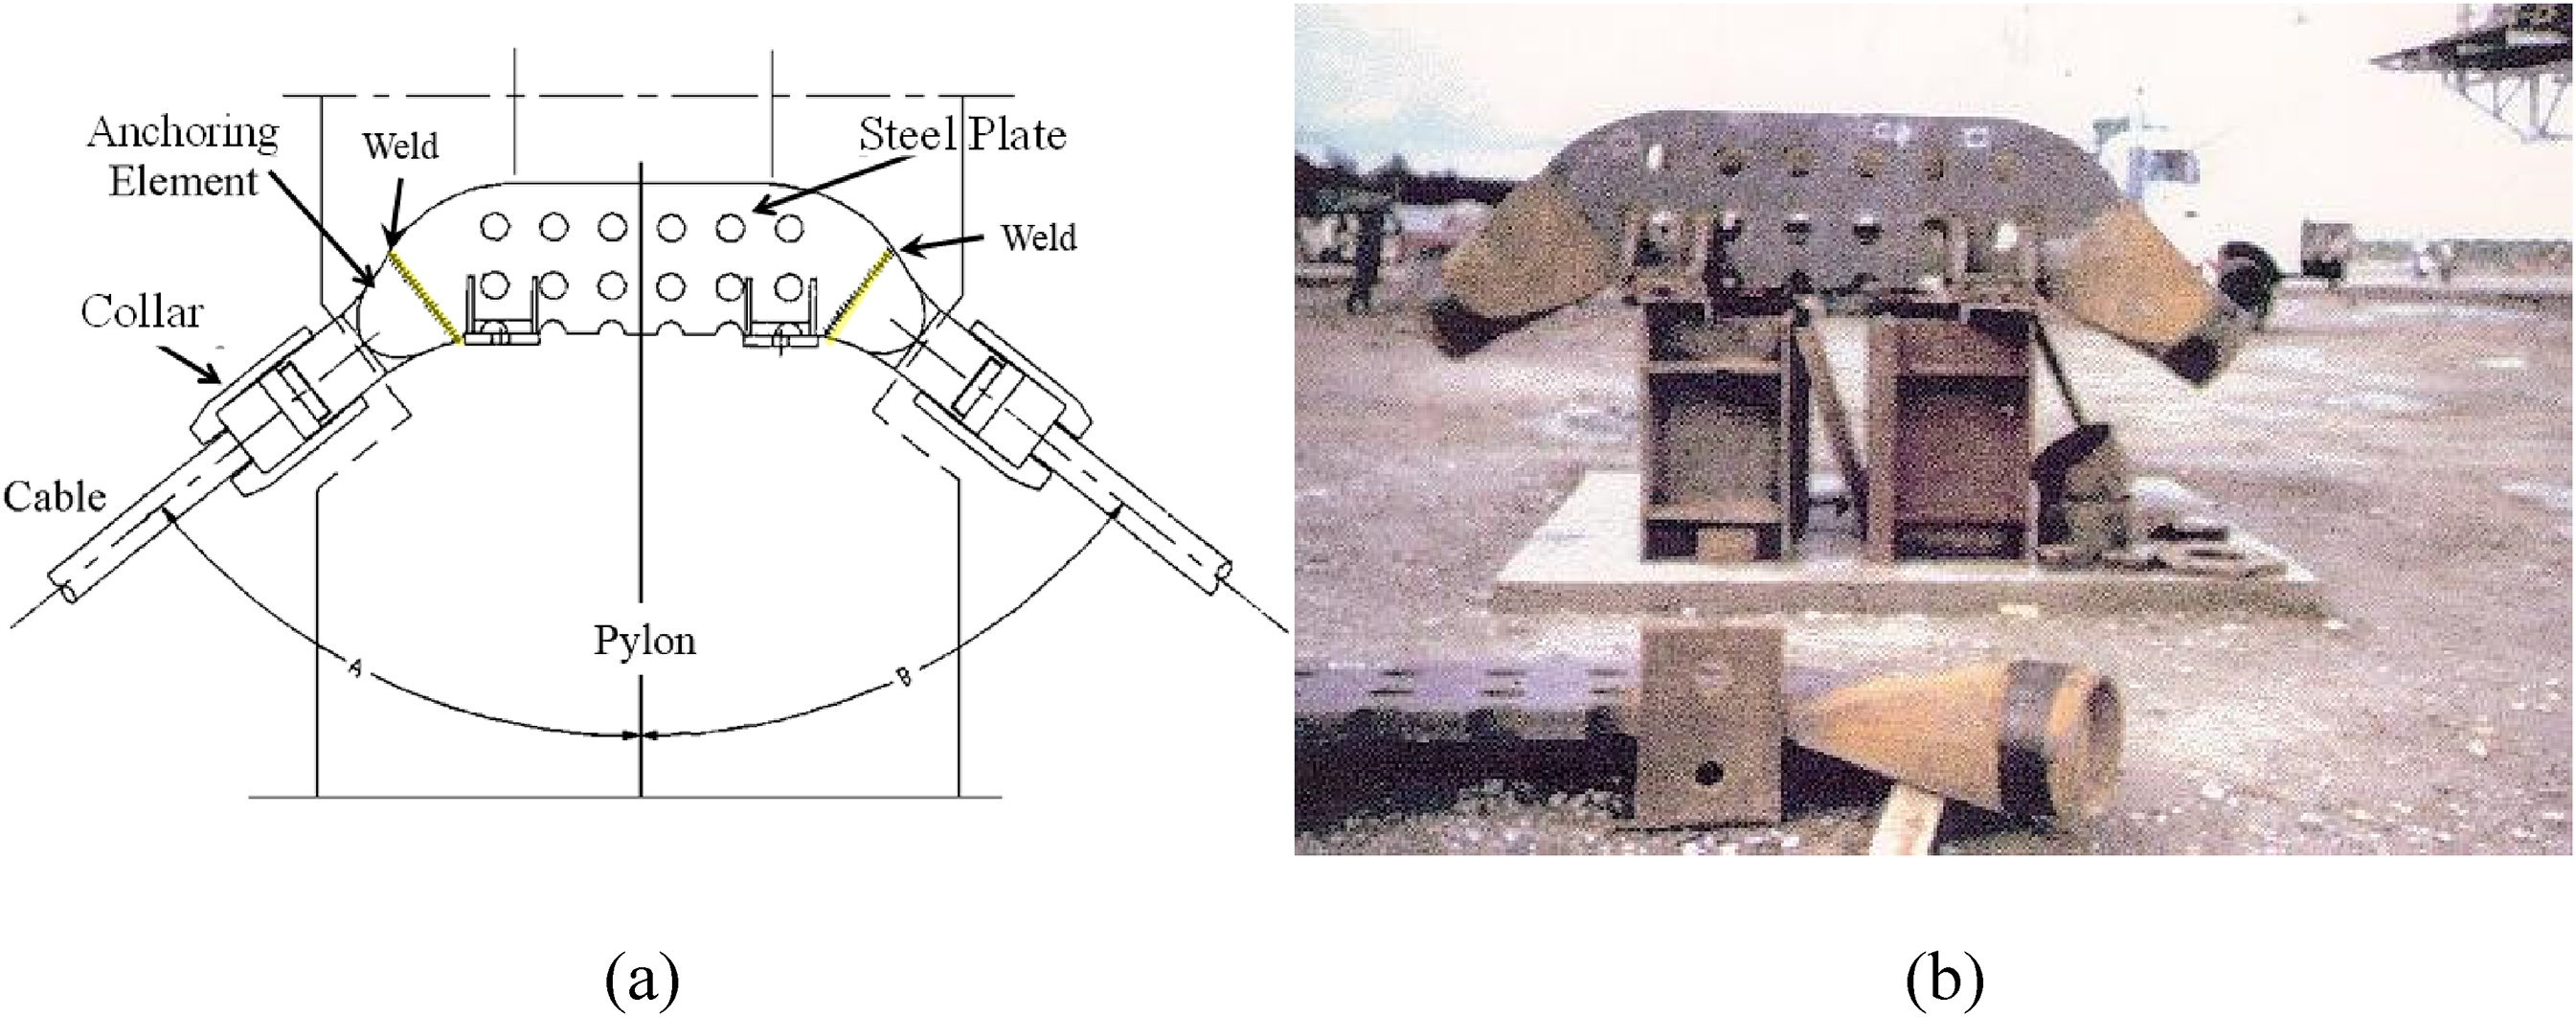
Anchoring assembly of the Rio Papaloapan Bridge: (a) anchoring system design. (b) Anchoring system ready for construction.
This innovative anchoring system developed to facilitate the construction processes prompted a reduced building time of the whole bridge. Despite having met the goal of shortening the construction time, critical issues related to quality control of the building components lacked the necessary attention. In particular, those processes related to the casting and welding of the anchoring element of the bridge. Consequently, in January 2000, the first failure of an anchoring component occurred. In this first case, the failure was due to microstructural deficiencies of the steel, and it started at the heat-affected zone (HAZ). Even though the chosen AISI 1050 steel was a suitable steel choice, 2 an inadequate and deficient casting process resulted in a low toughness and a brittle material with a large grain size (ASTM 2). Furthermore it showed a high content of pores and inclusions microstructure.3,4
Subsequently, the 111 remaining elements were inspected with an ultrasonic technique to detect internal defects and to assess the microstructural grain size. Eventually, 16 components were identified as structurally deficient and replaced in later maintenance stage. 5 As seen in Figure 3(a), the access area for ultrasonic inspection was minimal and of limited access; even though the ultrasonic inspection was possible for grain size identification (through the signal attenuation factor), weld inspection was practically impossible.

(a) condition for ultrasonic inspection of the anchoring elements and (b) anchoring element after demolition of concrete for direct weld inspection. 5
Since the welds are fully embedded in concrete, a direct inspection cannot identify future potential failures and concrete demolition; as shown in Figure 3(b), it is not a practical alternative. For these reasons, the inspection team selected the acoustic emissions (AE) to assess the 111 remaining elements in the bridge, including the previously rehabilitated elements.
Later on, a second failure occurred on June 10, 2015 (anchoring element of cable 1 in semi-harp 5 or T1-S5). In this case, the fracture occurred at the interface between the weld and the steel of the anchoring element. Failure analysis showed an initial crack that grew by fatigue, and the final fracture took place with a crack size of almost 65% of the cross-section area, 6 as indicated in Figure 4. Two different fracture zones showed: the first, a typical fatigue growth at the time of failure exhibiting elsewhere oxidation, a clear indication that water had seeped into the crack. The second, a typical ductile fracture, corresponding to the final crack opening due to overload. 6

Upper anchoring failed element of cable 1 semi-harp 5. 6
The AE inspection is a common practice used to identify weld defects, 7 corrosion, 8 and cracks in structural elements.9,10 It also evaluates fatigue crack growth to correlate the energy released by crack extension with the acoustic-emission counts per cycle. 11 More recent studies focused on using AE for early defect detection of both, structures, 12 and welded joints. 13 Furthermore, AE along with ultrasonic techniques are used to monitor crack initiation and growth. 14
Nowadays, research applications for AE are looking for more practical methods and techniques to correlate the acoustic emission to the crack size.15,16 Under controlled conditions, it has been possible to relate cyclic loads to AE signals generated during crack fatigue growth to estimate absolute values for crack lengths. 17 Moreover, AE has become a beneficial non-destructive technique employed for inspecting and monitoring the condition of different elements explicitly used in vehicular bridges.18–20
Despite the references as mentioned earlier, there is still no practical application for AE inspection of welded joints embedded in concrete and without previous inspection or measurement records to assume some evolution of the cracks. Nonetheless, for this study, the number of anchoring elements is significant to obtain statistical data for future monitoring of the welds.
AE inspection
The planned two-step inspection methodology consisted of initial laboratory conditions to characterize the AE signal from a defective weld of the same materials and loads, simulating the bridge conditions. The second, on the field at the bridge, could set the filters and inspection parameters to identify ambient noise and acoustic friction emissions from the cables and the pylon according to the weld AE characteristics.
Laboratory tests
To characterize the AE from a welded element, the produced samples were: 10 specimens (Figure 5) to obtain a typical acoustic signal; 5 welded flawlessly to simulate optimal conditions, while the other 5 intentionally defective welded, mimicking the conditions of the failed element in the bridge. For this case, laboratory tests followed testing AISI 1050 steel specimens, chosen and welded according to the original design specifications and procedures used for the bridge, and ultrasonically inspected for quality assurance of the welded joints. A 10 t servo-hydraulic machine applied the loads to simulate the loading conditions and stimulate AE (Figure 5).

(a) specimen design (units in mm) and (b) experimental array for AE laboratory tests.
For tensile testing, each specimen instrumented with two low-frequency PK-15i and two high-frequency PK-30i sensors followed. The low-frequency sensors were placed at one side, above and below the specimen, while the two high-frequency sensors were positioned on the opposite side following the same configuration (Figure 5).
The test applied loads with increasing steps from 1 t to 9 t, as shown in Figure 6(a). This loading condition applied for the laboratory experiments was considered according to the limitations of the maximum capacity of the servo-hydraulic machine, selecting a maximum applied load close to the limit of the machine and with different steps to simulate a fatigue condition, which could be representative of the scenario that produced the failure of cable T1-S5 in 2015. The characterization and comparison of AE from the welds of the defective specimens to those from the healthy specimens permitted the identification and qualification of the acoustic energy and wave from the flawed welds 13 (Figure 6(b)). Table 1 presents a summary of the obtained experimental results for one representative test, which corresponds with the test shown in Figure 6, where the values of the most important AE parameters are provided. Based on these results, it was then possible to set up the parameters for acquisition, filtering and data analysis for field conditions, assuming that laboratory results were representative of those from anchoring elements of the bridge. It is important to mention that AE signals were not generated for the healthy specimens.

(a) load time history for laboratory specimens (red dots indicate the acquired hits and the green line the applied load) and (b) a typical AE response from defective specimen (the horizontal red lines indicate the threshold interval).
Experimental results for the laboratory test shown in Figure 6.

Instrumentation field program
The chosen system for AE field inspections for the anchoring elements was the Physical Acoustics Sensor Highway III. This system has 16 active channels, and, as in the laboratory tests, the sensors were those for low and high frequencies, that is, the PK-15i and PK-30i models with a resonance frequency of 150 kHz and 300 kHz, respectively. Again, for the measurements, a pair of sensors on each inspection point were used.
As per the cables, the anchoring elements were numbered from bottom to top as T1 to T14, and the semi-harps, identified from 1 to 8 and referenced to pylons 2 and 3, as indicated in Figure 7. Due to the limited number of channels, simultaneous measurements were possible for up to 8 anchoring elements. Measurements were planned for an 8 h period from 7 pm to 3 am, since the highest traffic and load conditions on the bridge occur at night on weekdays. 21 Consequently, four sets of measurements scheduled for each pylon (2 or 3) and side (upstream or downstream) are shown in Figure 8(a). Access to each measurement point was done using scaffolds, but later, with rope access specialists, as shown in Figure 8(b).
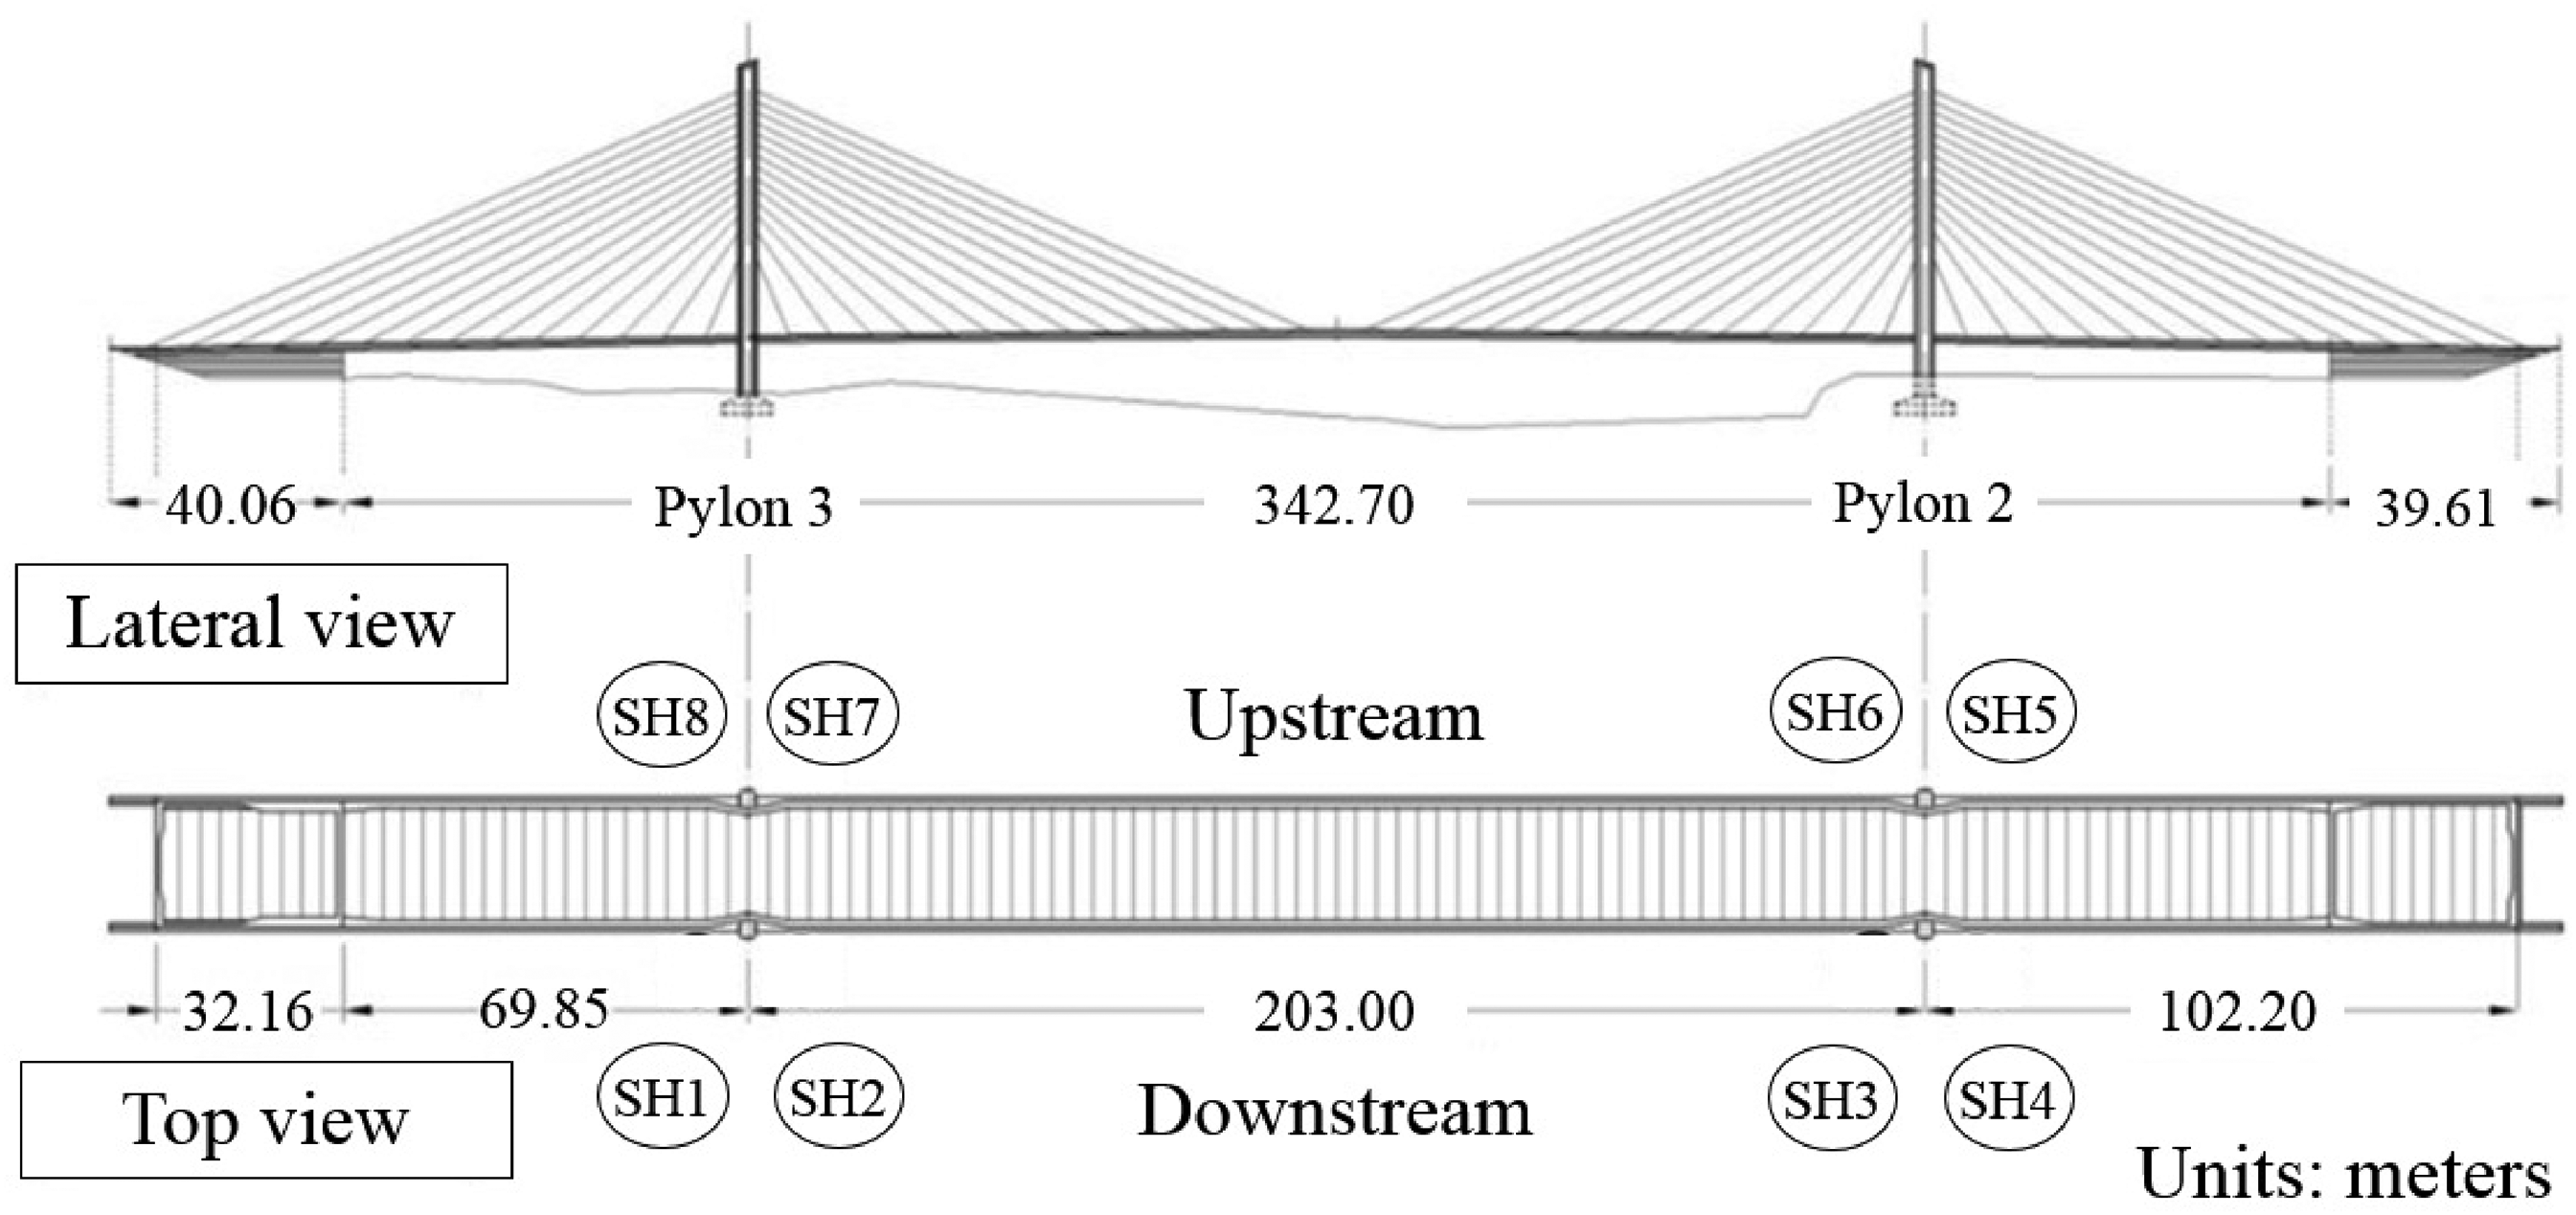
Bridge layout for identification of anchoring elements.
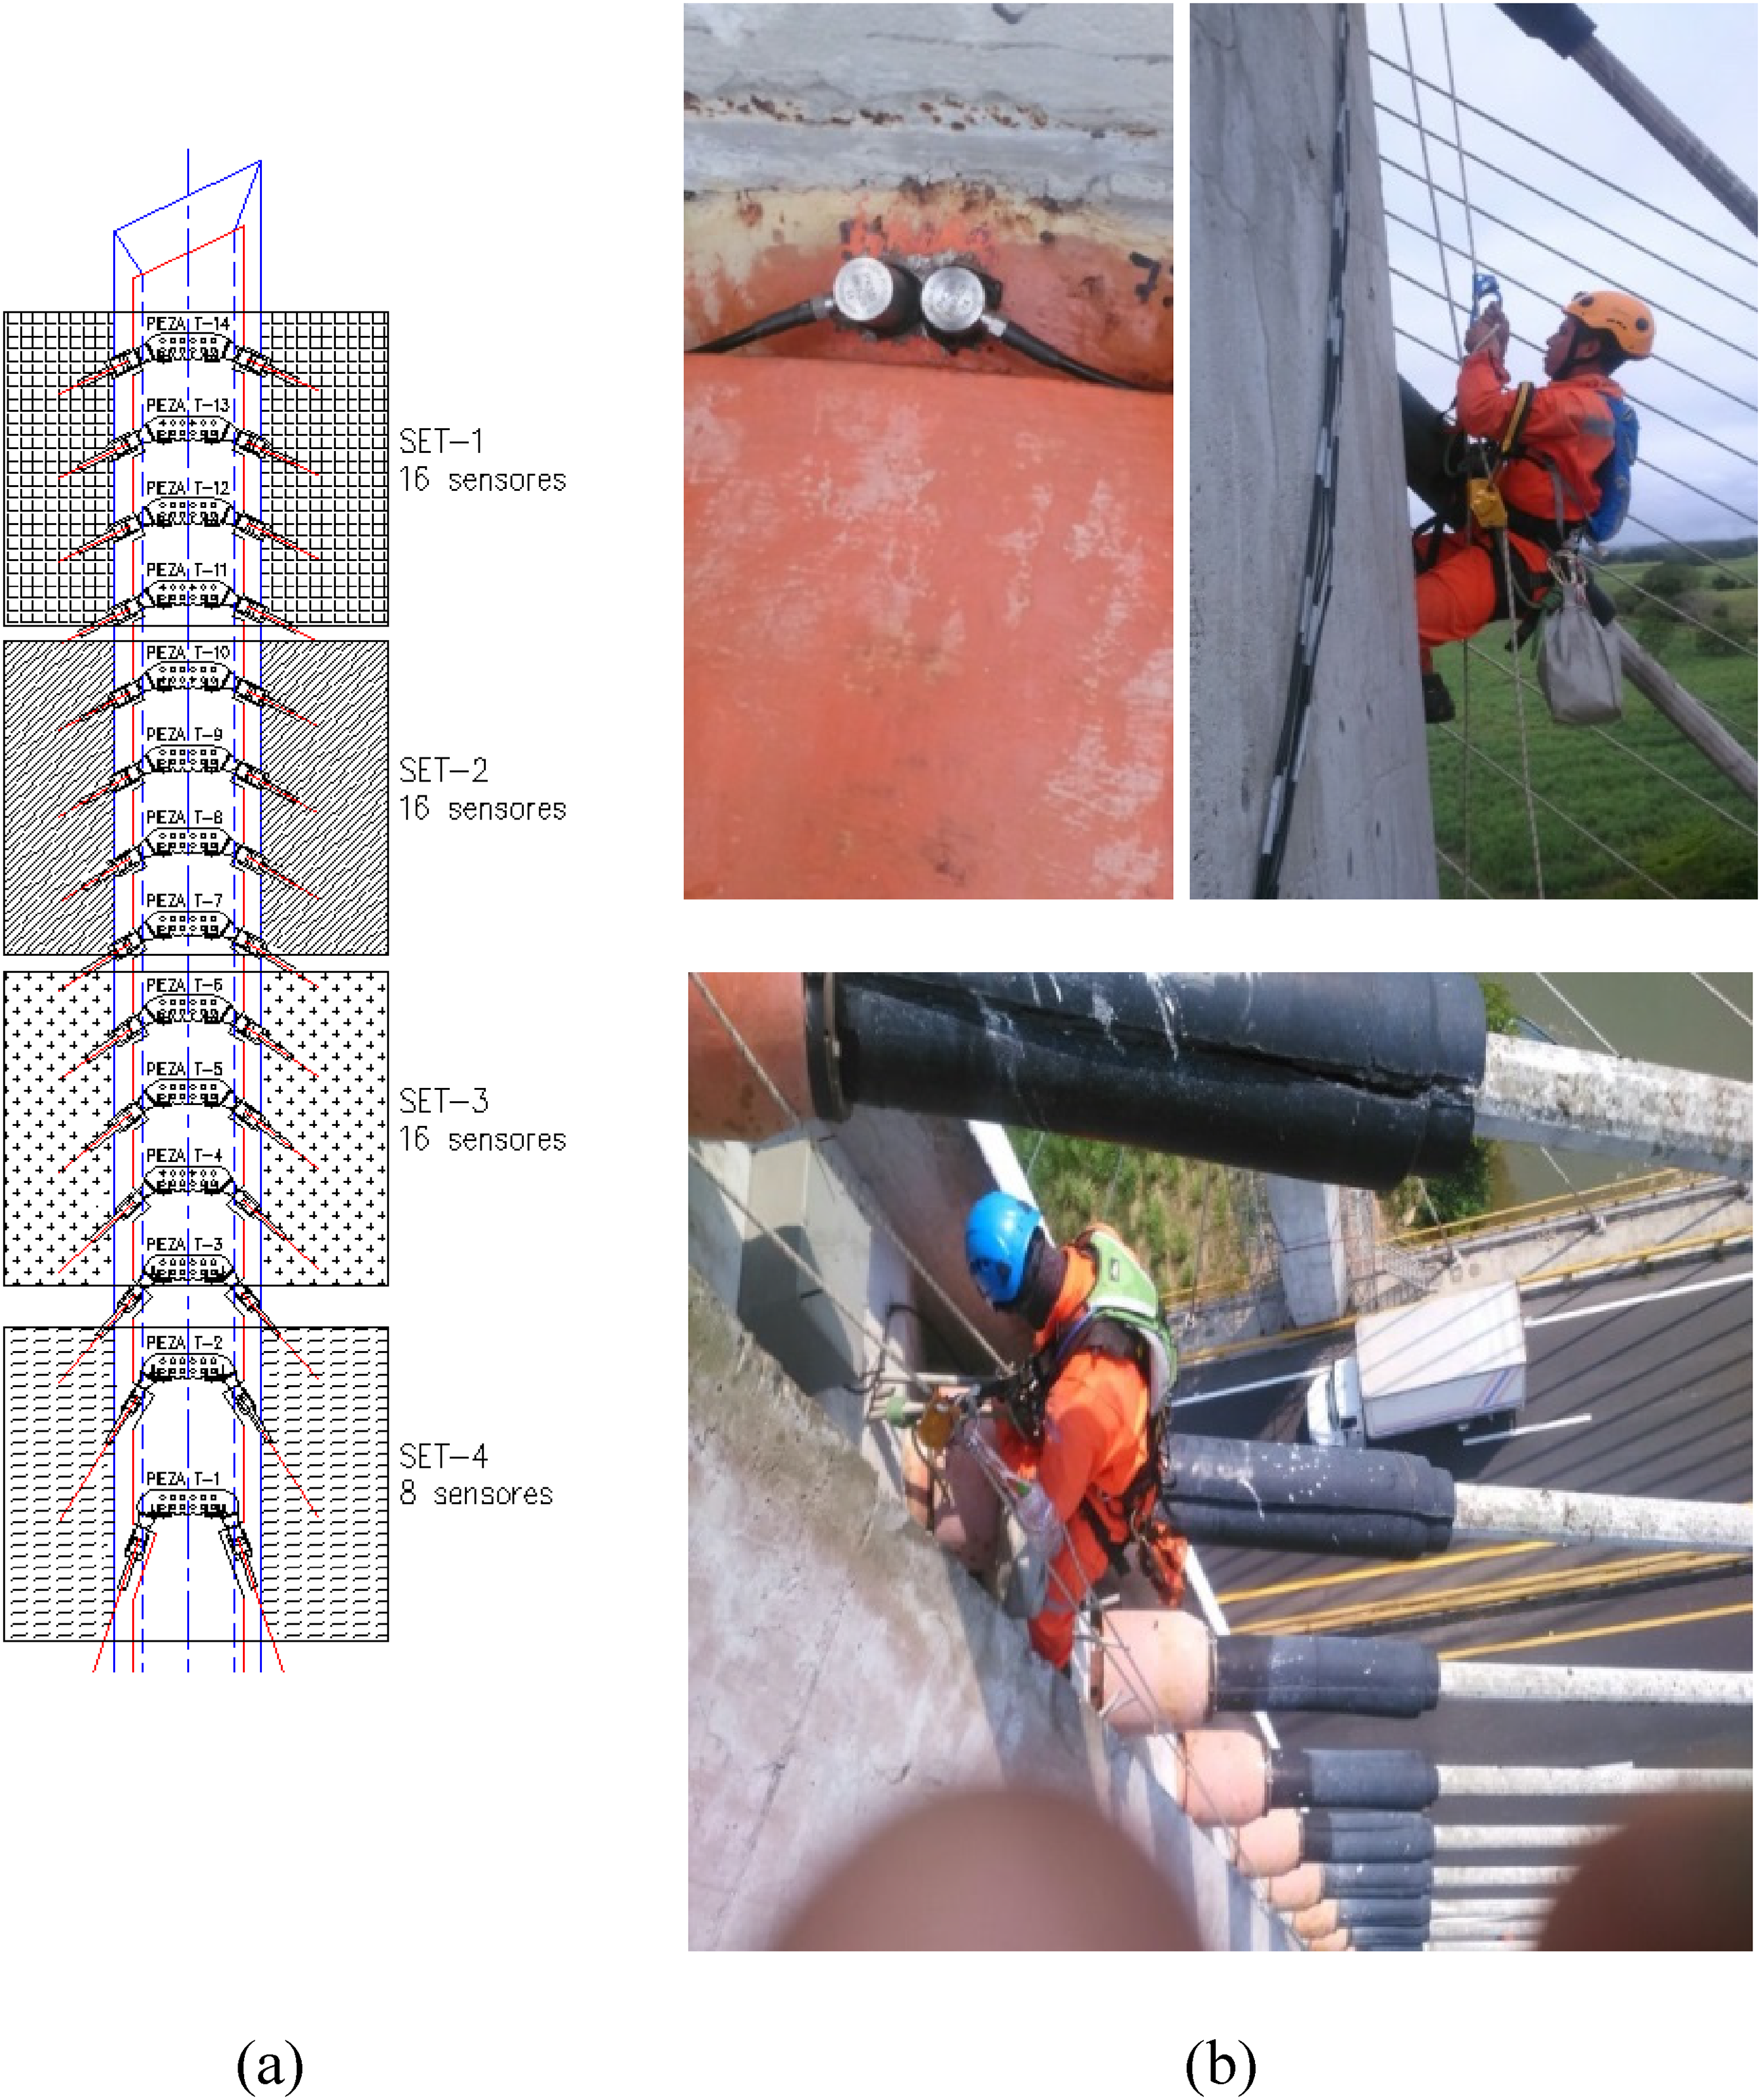
(a) instrumentation group set arraignments for the inspection of anchoring elements on one side of a pylon and (b) sensor installation works.
Sensor installation
Sensors were fixed on each measuring point using grease for coupling and heavy adhesive tape to wrap them to the anchoring elements; then, a pencil lead was broken to measure the response of the sensor according to the ASTM F2174-02 standard, 22 and to verify an adequate installation. This test, also done at the end of the measurement before removal, meant to confirm that there was no decoupling of the sensors; if so, repetition of the measurement followed.
System configuration
As early stated, data acquisition lasted for 8 continuous hours at night, where the traffic and loads are higher over the bridge. Based on the laboratory results and the values of the selected parameters shown in Table 1, the AE configuration was set as follows: 30 dB threshold, analogue filters between 20 kHz to 400 kHz, and digital filtering between 40 kHz and 400 kHz. The sampling rate set to 2 MHz, with a waveform length of 4000 µs and the Peak Definition Time (PDT) set to 200 µs, the Hit Definition Time (HDT) to 800 µs, and the Hit Lockout Time (HLT) to 1000 µs, with a maximum elapsed time of 1000 ms for each acoustic event. After the acquisition, the selected events for analysis were those with Rise time less than 300 µs and Energy greater than 1.
Analysis and results
The AEwinTM Real-time Data Acquisition and Replay Software used to measure and analyze the integrity of the welds of the anchoring elements took into consideration three different approaches:
The accumulated acoustic energy. The severity index that considers the acoustic energy of significant events. The MONPAC system criteria,
23
represented by the zonal intensity plot.
Accumulated acoustic energy
A direct and most straightforward method to compare and evaluate the weld condition of the anchoring elements is through the accumulated acoustic energy, which is a measurement of the acoustic activity and, although it is susceptible to include undesired acoustic events, it is also a clear sign of cracking. Figures 9 and 10 present the accumulated acoustic energy per hour for each anchoring element, referenced to the semi-harp (S1 to S8) and position (T1 to T14), but also to their corresponding pylon (2 or 3) and side (upstream or downstream), as indicated in Figure 7. Previous results summarized in Table 2, show the elements with the highest accumulated energy.
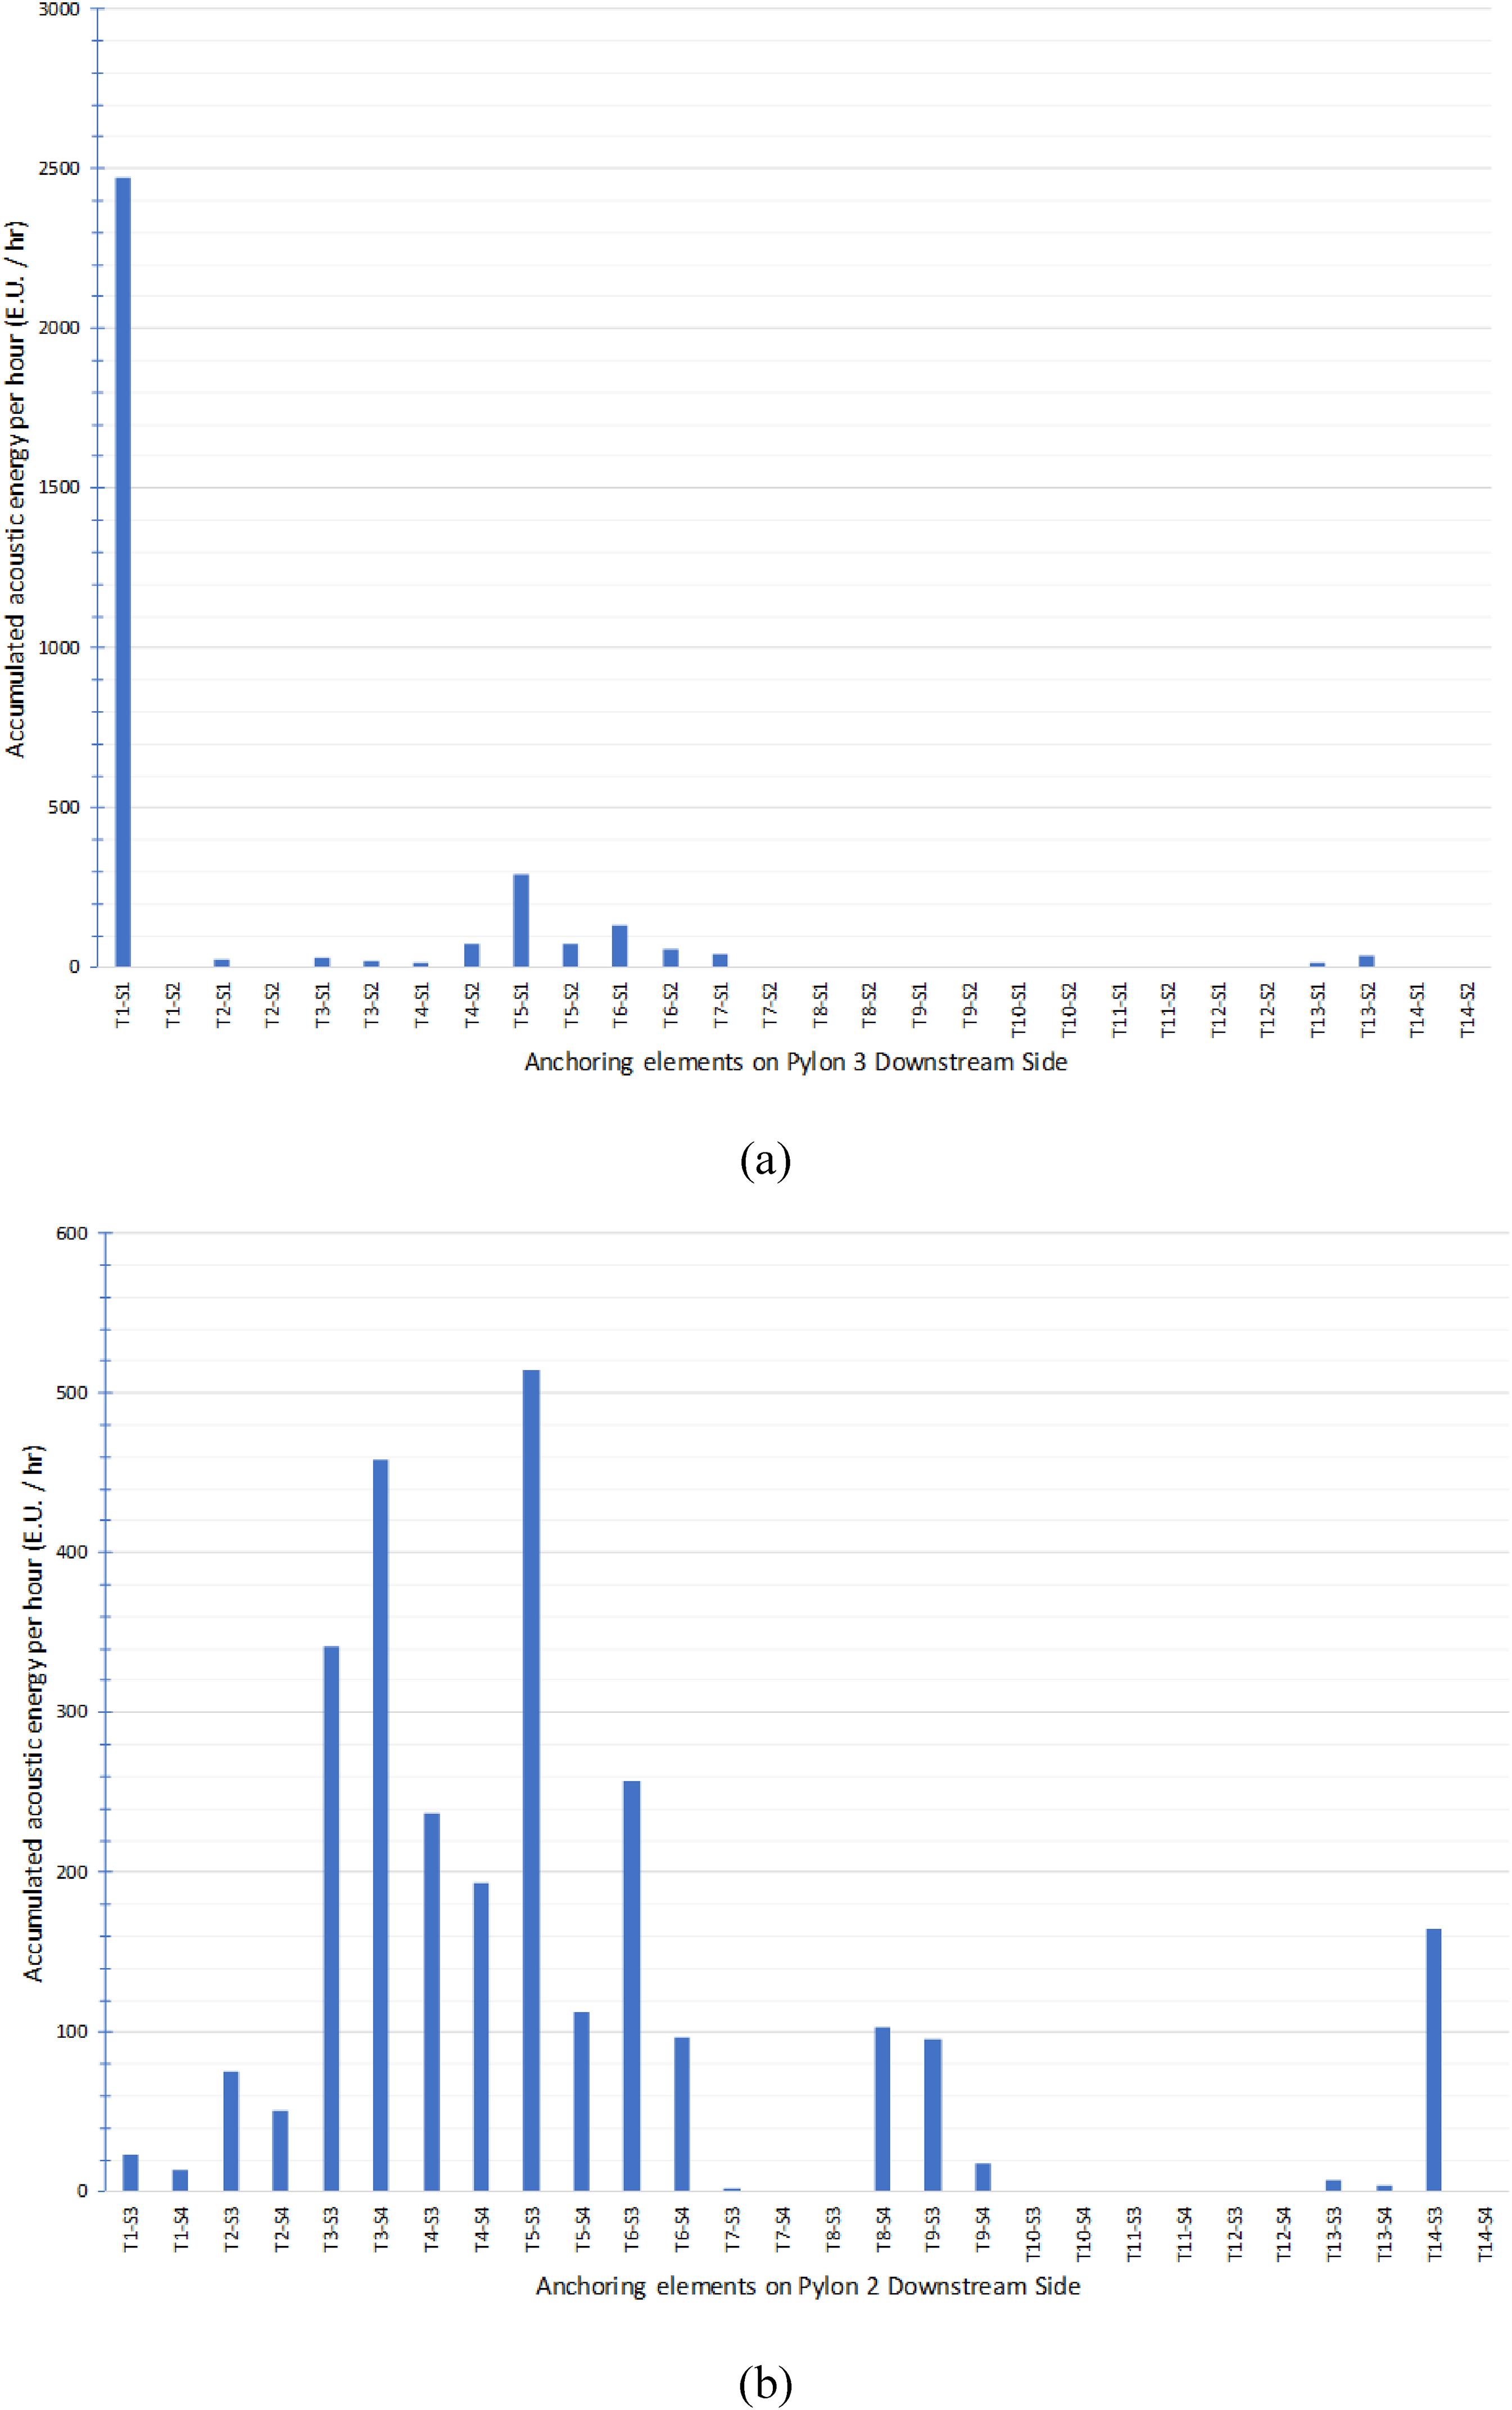
(a) accumulated acoustic energy per hour of elements in semi-harps S1 and S2, associated to pylon 3, downstream and (b) accumulated acoustic energy per hour of elements in semi-harps S3 and S4, associated to pylon 2, downstream.

(a) accumulated acoustic energy per hour of elements in semi-harps S5 and S6, associated to pylon 2, upstream and (b) accumulated acoustic energy per hour of elements in semi-harps S7 and S8, associated to pylon 3, upstream.
Anchoring elements with the highest accumulated acoustic energy during the AE inspections.

Severity index
According to the analysis proposed by T. J. Fowler, the severity index Sr (equation (1)) is a representative indication of AE related to cracking. This index initially used to evaluate carbon steel pressure vessels
23
; it also applies to different materials and loading conditions, like fiber-reinforced composite bridge decks,
24
prestressed concrete beams,
25
and bridge concrete girders.
26

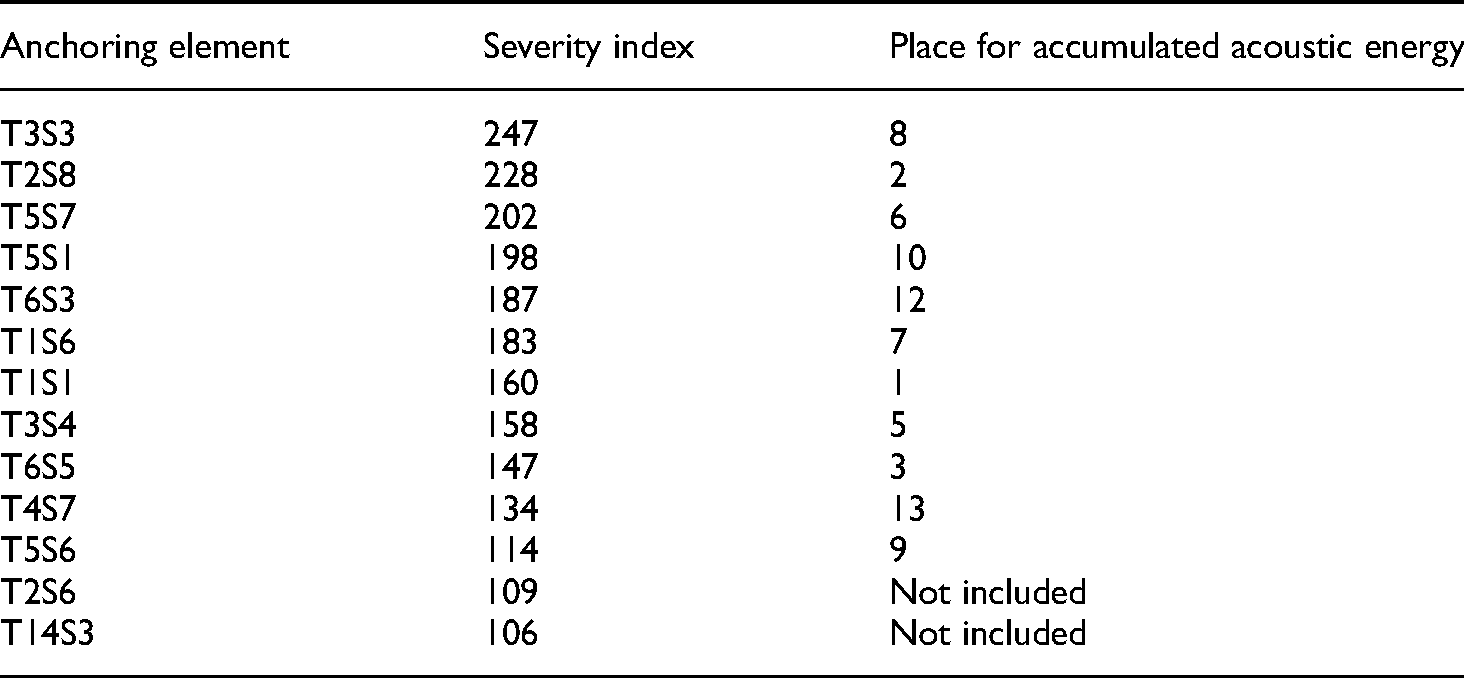
Figure 11 presents the severity index of all anchoring elements; arranged in decreasing order to evaluate and classify the welds’ condition and identify those over the average value (µ = 32.24). Table 3 lists the anchoring elements with the highest severity index, again arranged in decreasing order and compared to their position with respect to what they showed for the accumulated acoustic energy. Note that for this case, among the 13 elements with the highest severity index, there are 11 with the highest accumulated acoustic energy with a different sequence of priority.

Severity index for the inspected anchoring elements. Big red dots indicate the elements with different severity indices selected for direct inspection with ultrasonic technique (T2-S7 and T6-S5) for establishing a correlation between AE measurements and the weld condition of the anchoring element. Regular-size blue dots indicate the rest of all the inspected anchoring elements. Horizontal green line indicates the average value of the severity index for all the inspected anchoring elements.
Anchoring elements with the highest severity index.
Zonal intensity plot
The evolution of the cracking of a structural component is possible by analyzing the accumulated acoustic energy, since the acoustic activity is a direct measurement of the cracking process. However, the sole consideration of this parameter can be misleading because it considers acoustic events associated with phenomena other than cracking. For that reason, the use of the severity index is more accepted because it takes into account the events or hits with the highest acoustic energy, which are most likely to be associated with cracking.
For a better evaluation of the cracking phenomenon through AE, not only the accumulated energy or the severity index is enough; but also, it is necessary to know if there is an evolution of these parameters and they increase over time, which would be an indication of the growth and size of the cracks.
For the above reasons, the zonal intensity plot was defined by the MONPAC system criteria
23
to classify the acoustic activity not only for its intensity but also for its evolution and to classify and label the condition of a structural element in terms of the risk of failure. The zonal intensity plot is based on the severity index (equation (1)) and the historic index, which is defined as follows: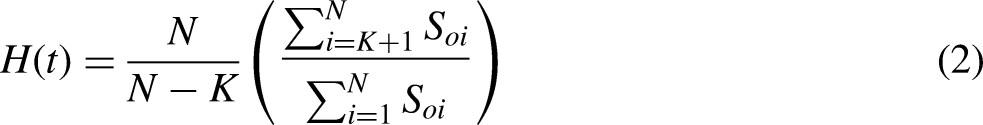
Figure 12 presents the zonal intensity plot, showing the severity index versus the historic index for the relevant cases (H(t) > 1) determined for the anchoring elements of the Rio Papaloapan Bridge. This plot, divided into five different regions (Insignificant, Minor, Intermediate, Follow up, and Major), indicates the structural condition of the anchoring element according to the MONPAC system criteria, which has been used by different researchers for diverse materials and loading conditions.23–26
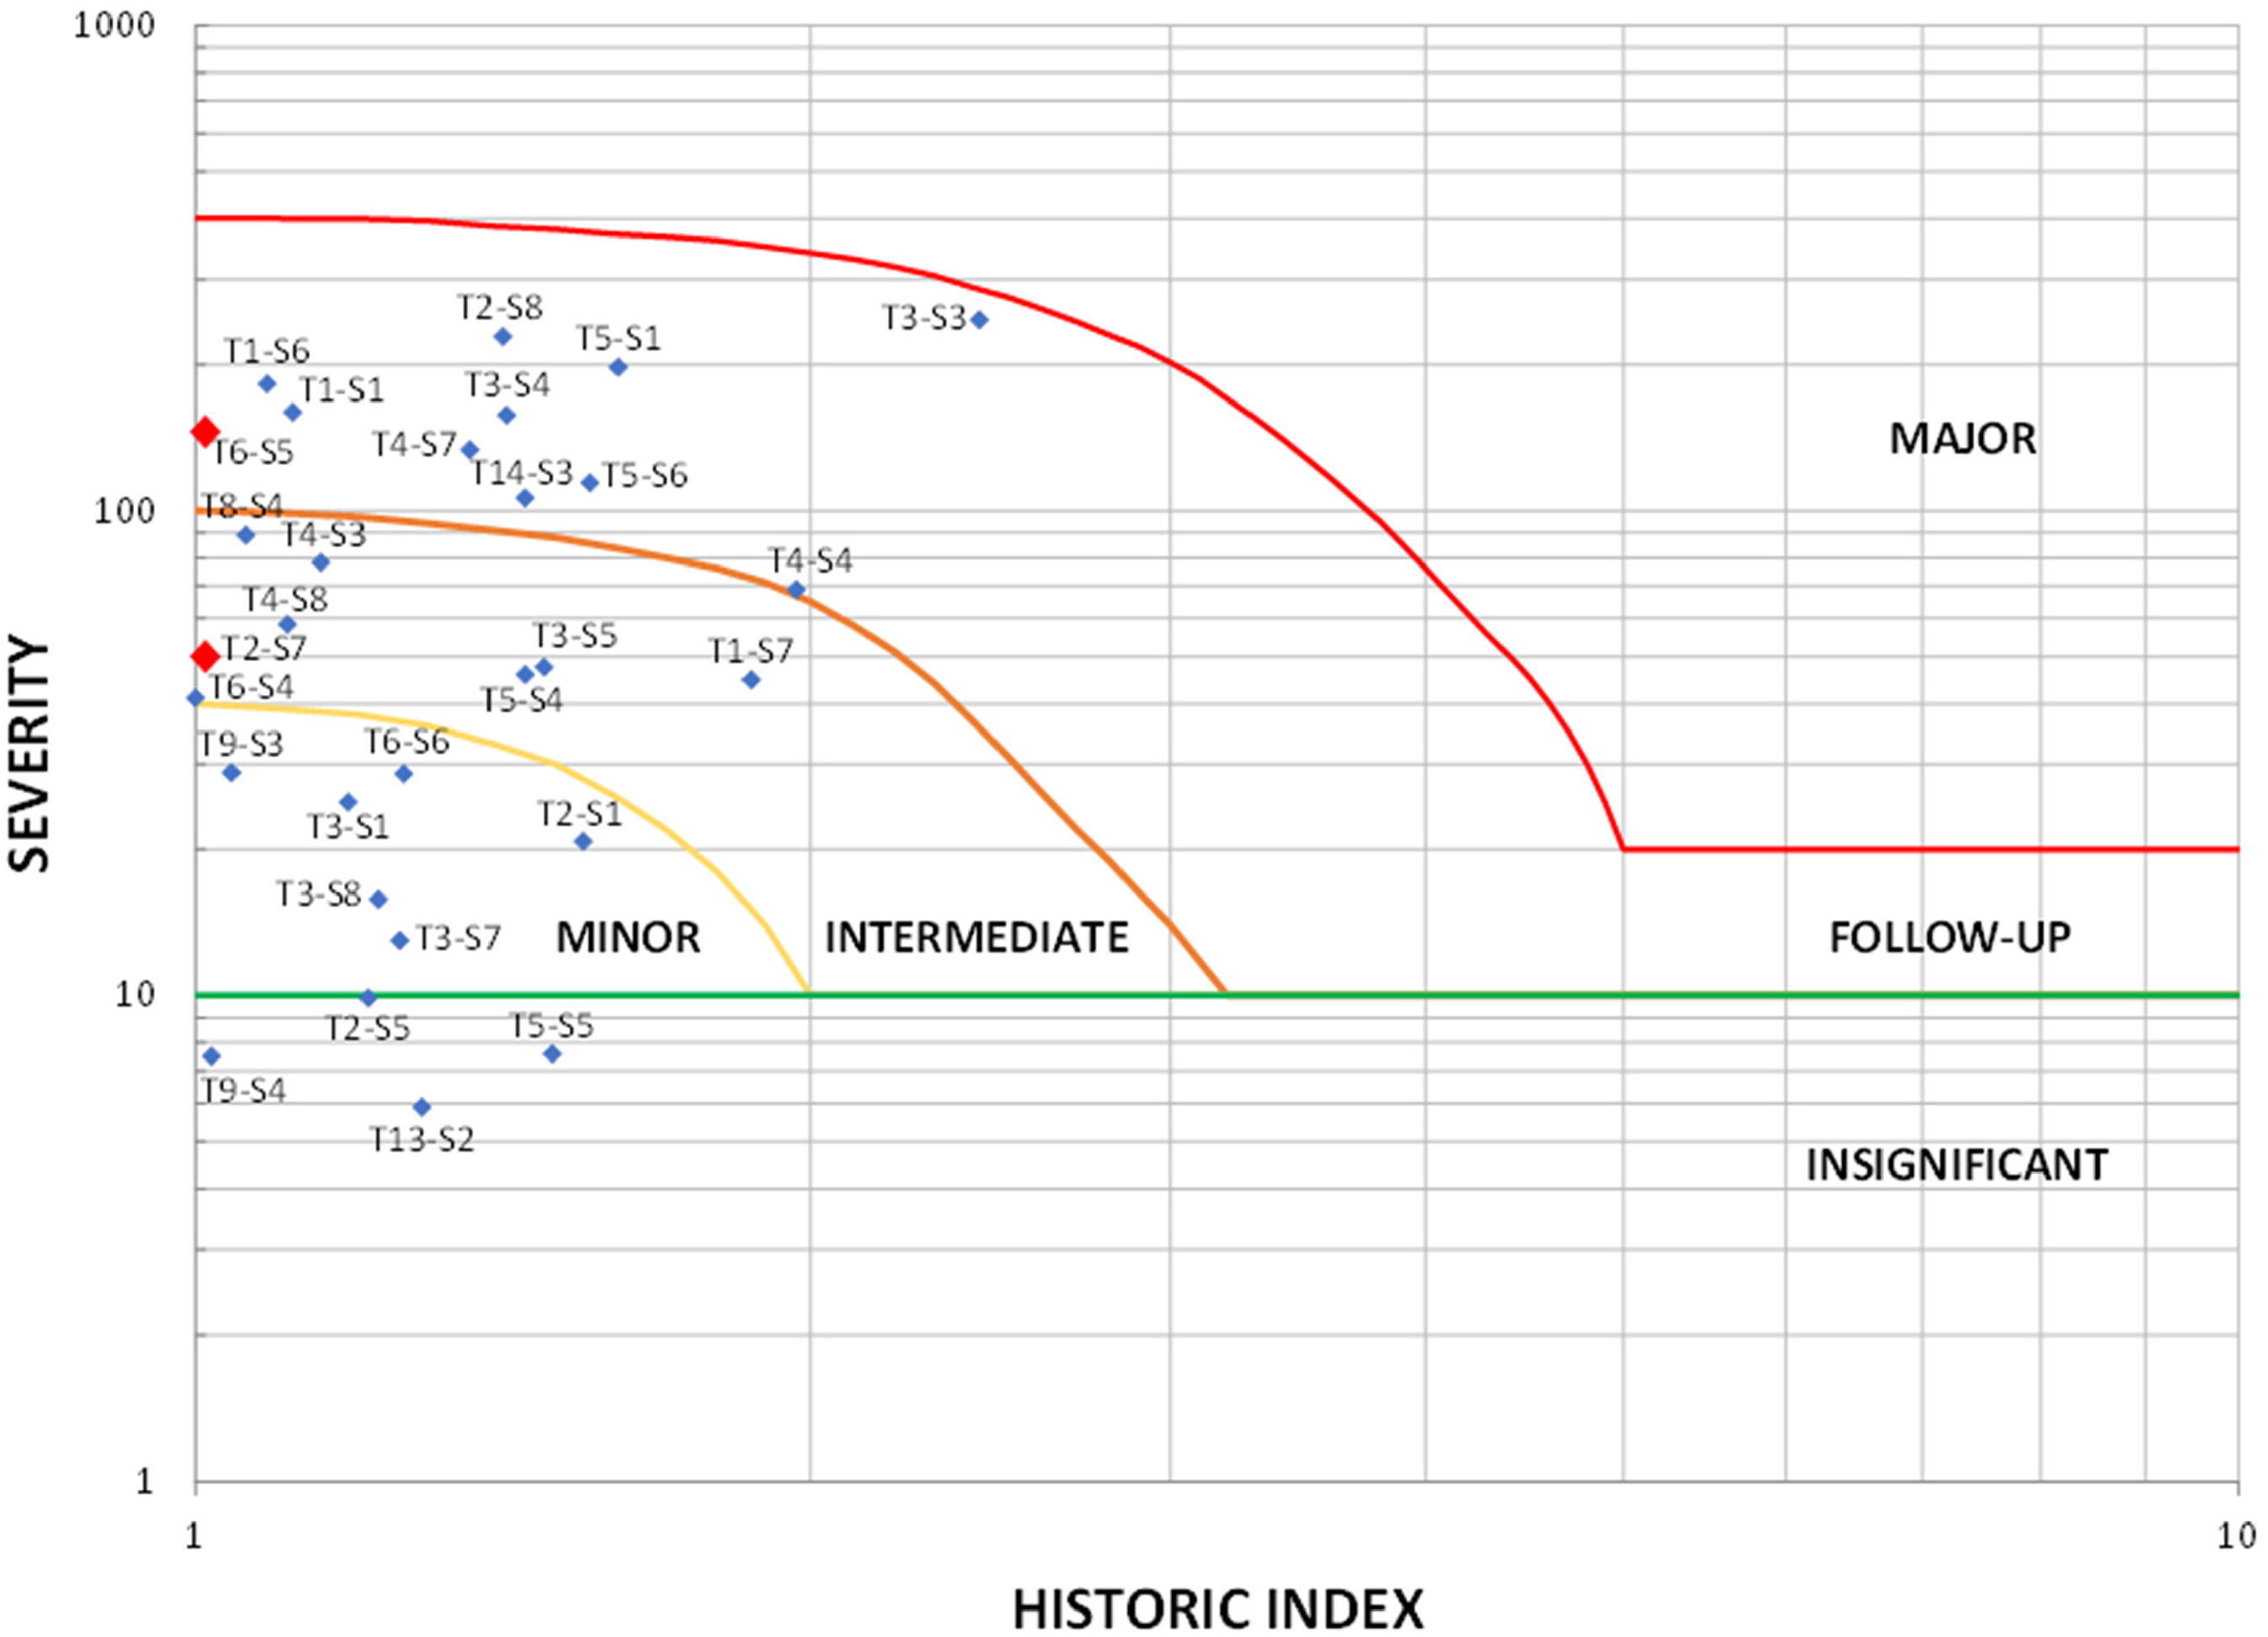
AE zonal intensity plot for the welds’ anchoring elements.
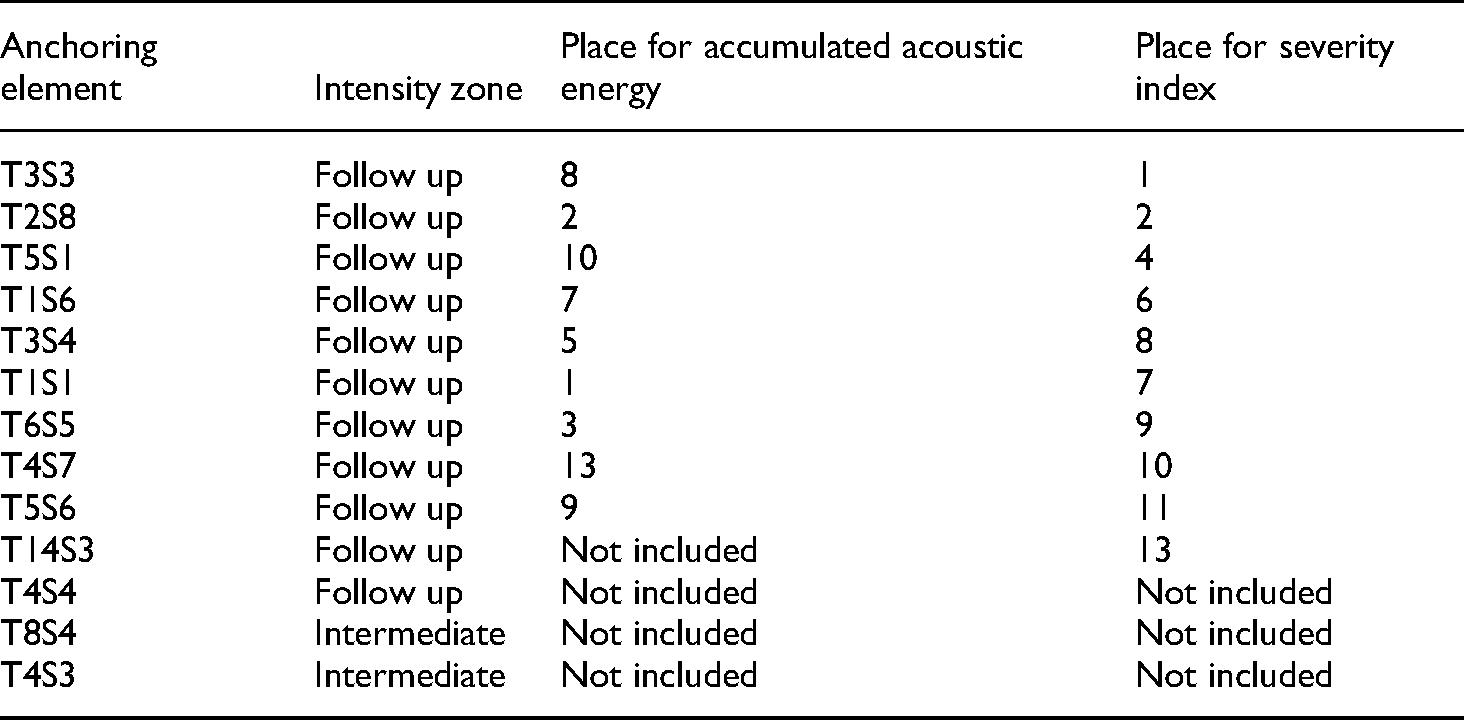
Considering the results in Figure 12, Table 4 identifies the most critical anchoring elements, sorted according to their relative position to the upper limit and not to the severity index, and compared to the position they got considering the accumulated acoustic energy and the severity index. Again, the most critical elements coincide, but in different order or position.
Critical anchoring elements according to the AE zonal intensity plot.
Direct UT inspection of reference anchoring elements
To establish a correlation between AE measurements and the weld condition of the anchoring element, two different elements with different severity indices were chosen for direct inspection with ultrasonic technique. This inspection required demolition of concrete and later rehabilitation of the weld. In this case, the selected elements were T2-S7 and T6-S5 (identified with big red dots in Figures 11 and 12). The more critical of the two, the T6-S5 anchoring element, was chosen for being the most critical of all anchoring elements at the time of the inspection (when it has to be decided which elements would be inspected); the chosen representative element was T2-S7 at a turning point in Figure 12.
After ultrasonic inspection, element T2-S7 (Figure 13(a)) had only two small Class D defects that could be accepted according to the AWS standard. As far as the weld of the T6-S5 anchoring element (Figure 13(b)), it had one minor Class B and three Class A defects, all significant unacceptable indications according to the same AWS standard. 27

(a) layout of the ultrasonic results for the T2-S7 weld and (b) layout of the ultrasonic results for the T6-S5 weld.
Finally, to verify the consistency of the inspection technique after rehabilitation, the anchoring elements that were chosen for direct inspection and defect size evaluation were AE inspected, as described before. Table 5 presents a comparison of the severity index before and after rehabilitation, and clearly, the decrease of the severity index indicates that the AE inspection technique has an adequate correlation to the weld condition of the anchoring elements.
Severity index after and before rehabilitation.

Conclusions
This study proves the capacity of the AE technique to rating the weld condition of all the anchoring elements of a cable-stayed bridge and it is a valuable tool to identify those with high potential for damage. The low or almost null AE activity measured from the already rehabilitated elements is a significant evidence of the effectiveness of this technique for this particular application.
Integrity evaluation of the weld of the anchoring elements by accumulated acoustic energy, severity index and zonal intensity plot have similar results. However, severity index was the most appropriate for this particular case, because the accumulated acoustic energy is more likely to include acoustic events related to other types of phenomena different from cracking. On the other hand, the zonal intensity plot must be taken with care because, in this case, the historic index is not fully representative of the crack evolution, since the loading conditions during the measuring periods were not constant and highly dependent on the traffic, even though, from the statistical point of view, they were the same. 21
The present limits of the zonal intensity plot, along with the results from the AE and ultrasonic inspections, are valid, but it is possible to get a more satisfactory adjustment for the Intermediate and Follow up regions. Future rehabilitation of some other elements will provide precise information to validate present limits or adjust them for a more reliable technique.
In general, this study suggested rehabilitating the most critical anchoring elements to reduce the risk of failure and maintain the remaining elements in the follow up lower region. At the same time, periodic inspections will continue to measure the evolution of the severity index. Under those conditions, new information will be helpful to improve the calculation of the historic index considering and correlating the loading conditions of the traffic (measured from the SHM system already available in the bridge) during the inspection periods.
Footnotes
Acknowledgments
The authors would like to thank Mr Hector Hernandez from CAPUFE, and Mr Luis Rojas and Mr Martín Sandoval from Freyssinet de México, S.A. de C.V., for their support and trust for this project. Appreciation and recognition to Mr Francisco Sepulveda and Instumentalo S.A. de C.V. for their enthusiastic participation for the instrumentation. Thanks to the National Council of Science and Technology (Consejo Nacional de Ciencia y Tecnología, CONACYT-Mexico) for making possible the participation of Dr Jose M. Machorro-Lopez through the project 34/2018 of the program “Investigadoras e Investigadores por México” del CONACYT (Cátedras CONACYT).
Declaration of conflicting interests
The author(s) declared no potential conflicts of interest with respect to the research, authorship, and/or publication of this article.
Funding
The author(s) disclosed receipt of the following financial support for the research, authorship, and/or publication of this article: This work was partially supported by the National Council of Science and Technology (Consejo Nacional de Ciencia y Tecnología, CONACYT-Mexico) through the project 34/2018 of the Program “Investigadoras e Investigadores por México” del CONACYT (Cátedras CONACYT).