
Abstract
The heat exchanger (HE) is an important component of almost every energy generation system. Periodic inspection of the HEs is particularly important to keep high efficiency of the entire system. In this paper, a novel ultrasonic water immersion inspection method is presented based on circumferential wave (CW) propagation to detect defective HE. Thin patch-type piezoelectric elements with multiple resonance frequencies were adopted for the ultrasonic inspection of narrow-spaced HE in an immersion test. Water-filled HE was used to simulate defective HE because water is the most reliable indicator of the defect. The HE will leak water no matter what the defect pattern is. Furthermore, continuous wavelet transform (CWT) was used to investigate the received CW, and inverse CWT was applied to separate frequency bands corresponding to the thickness and lateral resonance modes of the piezoelectric element. Different arrangements of intact and leaky HE were tested with several pairs of thin piezoelectric patch probes in various instrumental setups. Also, direct waveforms in the water without HE were used as reference signals, to indicate instrumental gain and probe sensitivity. Moreover, all filtered CW corresponding to resonance modes together with the direct waveforms in the water were used to train the deep neural networks (DNNs). As a result, an automatic HE state classification method was obtained, and the accuracy of the applied DNN was estimated as 99.99%.
Keywords
Introduction
The main task of heat exchanger (HE) is to transfer heat between two media, operating media can be different depending on the field of application. HE is used in a wide range of applications, primarily in chemical industries, chilling stations, power plants, space stations, oil industry, etc. 1 Leakage from HE unwanted phenomena negatively affects the efficiency of the entire system, leading to financial losses, and environmental side effects. 2 The efficient operation of heat exchangers and mechanical integrity plays an important role in many fields. Flaws and other kinds of defects must be inspected and eliminated before causing above mentioned problems. Among the available NDT techniques, an ultrasonic inspection of HE is a suitable inspection method. In recent years, there has been much research work on the improvement of HE design, which leads to narrowing the space within HE. In terms of ultrasonic inspection areas, the heat exchangers become challenging and require designing an ultrasonic inspection system that is capable of working within limited space and underwater immersion conditions. Recently, much research work on defect detection in circumferential direction has been reported.3,4 However, the main limitation of the abovementioned application is that it cannot be applied to the case where the space between the heat exchangers becomes narrow. Furthermore, most recent research works show the classification of the HE state manually considering the waveform pattern. Manual inspection of the HE is prone to faults related to human factors and more reliable techniques are always desirable.
Guided waves can be used to inspect cylindrical-shaped specimens like HE. Axial and circumferential guided waves can be generated in cylindrical structures. The axially propagating waves are implemented to inspect long-range pipelines, and in most cases, axial waves are suitable to inspect a single cylindrical structure. Usually, the HEs are arranged in an array, and circumferential guided waves are used for inspection. Waves propagating circumferentially can be divided into circumferential waves (CWs) and circumferential shear waves, and both of them are dispersive waves. As CW is generated, a single HE from the assembly can be tested. A thin-walled tube has a similar dispersion property as a plate, whereas a thick-walled tube does not. In recent research works, the guided wave was successfully applied for the detection of circumferential fatigue,5,6 and radial cracks detection, 7 to detect internal load,8,9 and variation of the thickness in the cylindrical specimen.10,11 The advantages of the CW are sensibilities to both small and large defects to stress-induced corrosion. The most common method of generating the CW is through angle beams. 12 HE inspections have a narrow space between pipes, and only a limited number of ultrasonic probes can be used.
In the ultrasonic inspection of cylindrical tubes, the resonance frequency of the thin ultrasonic probe is a critical factor.13,14 Near the resonance frequency, the sensitivity of the probe becomes very high.15,16 Resonance frequencies of the piezoelectric patch transducer might not be single, and values and magnitude depend on the dimensions of the ultrasonic probes. The application of thin and flat ultrasonic probes generates multiple frequency band signals, and each frequency band itself will generate multiple guided wave modes. Proper signal processing techniques can be used to separate CW modes and select the most sensitive wave modes. Several methods have successfully been used to filter Lamb waves using Hilbert transform,17,18 bandpass filters, 19 Fourier transforms, 20 wave decomposition, 21 continuous wavelet transform (CWT) and inverse CWT (iCWT) methods. 22 CWT and iCWT have the advantage of extracting certain frequencies from waveforms without impacting others. Furthermore, CWT and iCWT-based filtering were successfully implemented for defect detection of composite materials, 23 shaft inspection, 24 an inspection of large structures, 25 delamination detection, 26 and rope damage inspection. 27
Ultrasonic inspection has become increasingly popular in recent years with the use of artificial intelligence (AI) and signal processing. Examples include support vector machine algorithms for detecting defects from ultrasonic signals,28,29 artificial neural networks (ANNs) for ultrasonic guided wave classification,30,31 convolutional neural networks (CNN) based ultrasonic testing,32,33 recurrent neural networks (RNN) and Lamb waves,34,35 relevance vector machine (RVM),36,37 k-nearest neighbors (kNNs), etc. All those methods can provide high accuracy in the particular data being used, the CNN and RNN are most suitable for image classification, while RVM and kNN methods show high performance with hierarchical data, and ANN and deep neural network (DNN) are suitable for the vectorial data inputs. DNNs have become widely used in ultrasonic nondestructive testing for inspection and defect classification in the last decade. Among them are RNN-based defect detection, 35 as well as convolutional neural networsks-based fatigue crack detection.38,39 This research used a DNN to detect leaky HE in the immersion test due to its simplicity, flexibility, relatively fast computation, as well as comparatively higher efficiency and accuracy. Also, recent reviews comparing different AI algorithms indicated that DNN has the distinguishable property of automatically extracting features from input signals.40,41
The aim of this work is to propose thin patch-type piezoelectric sensors for use in the water immersion test for the inspection of closely arranged HEs. Water within HE is the main indicator of a defective HE, regardless of the type of defect. In addition, detecting water-filled HE is more challenging than detecting other kinds of defects. The leaky CW is very sensitive to water-filled HE since the waveform amplitude will drop due to ultrasonic energy leaks to the water inside HE. In this study, the DNN was adapted to automatically detect water-filled HE regardless of the instrumental settings. Signals transmitted through the water were used as indicator signals to determine piezoelectric element performance and instrumental settings. Furthermore, the multifrequency waveforms were filtered using the CWT and iCWT methods, which separated the lateral and thickness resonance frequencies. The DNN was trained with combined filtered CW from the center of HE together with direct water-measured waveforms. The performance of the DNN was calculated by inspecting different arrangements of intact and leaky HE with a set of piezoelectric transducers in the range of the instrument's gain settings. As a result of the investigation, the accuracy of the DNN-based method was estimated to be 99.99%.
Materials and methods
In this section, the theoretical background of the circumferential guided wave and its mode selection criteria will be described. Also, the details of the experimental setup will be illustrated together with an explanation.
Circumferential guided waves
As it was mentioned previously the CW possesses the dispersive property, which means that propagation speed is a function of the frequency. To obtain an accurate nondestructive inspection method, physics related to the dispersion has to be investigated. CW is the guided wave that propagates around a hollow cylinder in a circumferential direction. Also, when the ratio of the internal and external radius is close to unity, plane Lamb wave solutions are frequently used to examine circumferentially propagating guided waves.
A calculation of the dispersion curve of the CW can be derived in several steps. In the case of the CW, the displacement components can be reduced to the sole functions of the radius (r), and thickness (t) by assuming that the generalized plane-strain condition prevails, which means that the displacement in the z-direction is uniform. A scalar and vector potential can be used to decompose the displacement field by the gradient of a scalar and zero curl divergence vector:


In this study, stainless steel heat exchanger tubes with an inner radius of a = 7 mm and a thickness of t = 1 mm (b = 8 mm) were used as test specimens, as schematically shown in Figure 1. The thickness of the selected HE is small compared to the radius of curvature, and therefore, the dispersion property will be very similar to that of the Lamb waves in the plate. Within the given frequency range, there are at least two CW modes coexisting in the dispersion curve of the circumference. As it was mentioned earlier closely located HEs will be investigated, the space between HE was 1.5 mm. As a result of narrow spacing between HEs, selection and excitation of a single CW mode are difficult.
A schematic illustration of the heat exchanger (HE).
Circumferential guided wave mode selection
The CW is the dispersive wave that propagates along the circumference. Each mode of the waveform has a different level of sensitivity to the defect. As a matter of fact, the CW consists of two independent wave components: radial displacement (out-of-plane) and circumferential displacement (in-plane) wave components. The contribution of each component might vary depending on the selected mode. CW's modes with dominantly radial displacement components are the most sensitive to the water inside of HEs and they are called leaky-wave modes. On the other hand, wave modes with significant circumferential displacement components are suitable for the inspection of the very large circumferential cross section. Wave modes with significant radial wave components cannot propagate for long distances due to the attenuation caused by the leakage of acoustic energy. With all that being said, an optimal mode selection is the result of a complex combination of factors, and when ultrasonic probe sensitivity is considered, the process becomes even more challenging.
Generally, piezoelectric probes are more sensitive to out-of-plane wave motion and can mainly stimulate modes that possess a sufficient out-of-plane component in a particular frequency range. Also, modes with a large out-of-plane component will be strongly attenuated due to leakage losses. Therefore, it is imperative to select an optimal mode where out-of-plane displacement is sufficiently sensitive to the presence of water inside HE and at the same time strong enough to propagate over a sufficient distance. In real-world applications, however, instrumental limitations must also be considered. Using pulser-receivers for the excitation of ultrasonic waves, both longitudinal and transverse waves are generated. As water has a relatively low viscosity, only longitudinal waveforms propagate, which has an impact on ultrasonic sensitivity. The next subsection discusses the resonant modes of piezoelectric transducers.
Piezoelectric element resonance modes
Ultrasonic probe selection for HE inspection is challenging and requires consideration of several factors. Since the space between HE is limited, only thin ultrasonic probes can be used. Furthermore, the ultrasonic probe must possess a sufficiently long operation life cycle under a range of temperatures, because in some conditions the temperature at the surrounding area of HE might reach the boiling point of the water. Considering all the abovementioned requirements, in this research, piezoelectric patch elements 42 with high Curie points 43 were selected as a pulser and receiver. The selected piezoelectric elements were glued with epoxy to the guiding stainless steel arms. The dimensions of the selected piezoelectric element were 16 × 10.1 × 0.4 mm. The transducer guiding arm is a simple straight plate with 0.8 mm thickness, and the design of the guiding arm does not affect significantly the experimental results.
The efficiency of the piezoelectric elements depends on the excitation frequency, and the particular frequency at which piezoelectric elements oscillate with the highest amplitude is called resonance frequency. However, in these studies, the pulser-receiver is used to excite and receive the signals. The pulser generates a short-time or a wideband signal. In the absence of the damper of the piezoelectric transducer, all resonance modes will be excited. Piezoelectric transducers have minimum electric impedances at their resonance frequencies. Whereas the frequencies corresponding to the peak of the impedance values correspond to the open circuit condition, these frequencies are most suitable for the reception of the waveform.
The impedance variation over the range of the frequency band was scanned by an impedance analyzer. In order to provide a precise analysis, the overall frequency range was divided into two ranges. First, a lower frequency range of up to 1 MHz was analyzed, and in Figure 2 (a) is shown the impedance variation over the given frequency range. The local minimum of the impedance curve indicates the presence of resonance frequencies, and all resonance frequencies below 1 MHz correspond to lateral resonance modes. Also, the higher frequency range between 2 and 13 MHz has been measured, and this frequency range covers the resonance modes corresponding to thickness extensional and thickness-shear modes. According to Figure 2 (b), there are two drops in impedance magnitude, which corresponds to lateral extension and lateral shear resonance modes.

Impedance measurement: (a) Up to 1 MHz frequency range; (b) Frequency range from 2 to 13 MHz.
The analyzed frequency allows for the detection of the lateral and thickness resonance modes. The value of the resonant frequency depends on the geometry of the piezoelectric element. In particular, the thickness and side resonant modes can be generated in the piezo patch transducers. The resonant modes can be generated by the propagation of the longitudinal or shear wave. In the thickness mode, resonant frequencies associated with longitudinal wave propagation are called thickness-extension resonances, while those associated with transverse wave propagation are called thickness-shear resonances. In the thickness-shear mode, the wave propagates along with the thickness by deforming the top and bottom surfaces in parallel and opposite directions. Similarly, the shear and longitudinal waves might propagate along with the lateral sides of the piezoelectric transducer. The resonance frequency excited due to the propagation of the shear wave can be evaluated by the following formula
44
:

Wave processing method
Dispersion of the CW and multimodal resonance frequency of the piezoelectric patch transducer requires implementation of signal processing as well as the time–frequency study of the waveform which allows analyzing the sensitivity of each frequency band to the present water inside HE. It is possible to obtain a time–frequency representation of the time domain waveform by using the following methods: the short-time Fourier transform (STFT), the Wigner–Ville method, the Gabor transform, the Choi–Williams transform, the Stockwell transform, the CWT method, etc.46,47 All the abovementioned methods contain a set of limitations, which makes choosing the correct transform method important. In the case of STFT, the limitation is caused by the fixed windowing function length, where fine time resolution results in a coarse frequency distribution. Alternatively, Wigner–Ville provides finer resolution both in time and frequency than STFT.
48
However, when the Wigner–Ville transform is used for multiple-component signal analysis, cross terms will appear, and the magnitude of the time–frequency transform will be artificially increased. Although the Gabor transform has similar limitations to STFT, its fixed windowing function length prevents fine resolution in the time and frequency domains at the same time.
49
Choi–Williams and smoothed Wigner–Ville transforms possess similar properties, and they correspond to particular modifications of the Wigner–Ville transform with additional kernels, which increases the computation cost and limits application to processing larger numbers of signals. In this research, the CWT was implemented for the time–frequency representation of the wave, since the main advantage of the CWT over alternative techniques is its flexible time–frequency resolution which can be adjusted depending on the frequency of the examining signal. Additionally, CWT itself allows visualizing variations in a wave pattern in both time and frequency domains simultaneously. The CWT can be expressed as follows
50
:


In this study, the thin piezoelectric patch element is implemented to generate and receive CW. As mentioned previously, due to the lateral resonance modes of the patch transducer set of resonance frequencies exists below 1 MHz, and high frequencies correspond to the thickness resonance modes and their harmonics. In addition, the absence of the backing damping element will reduce the signal-to-noise ratio by generating multiple frequencies. In order to resolve the abovementioned limitation of the transducer, CWT and iCWT wave processing were implemented to remove particular waveform frequency bands without damping them. When CWT and iCWT are used, the signal is decomposed into coefficients by wavelets. Afterward, the wave components according to the selected frequency range are reconstructed by iCWT by removing the frequency component from the threshold values. Based on the desired frequency band, threshold values are determined. CWT and iCWT also have the advantage of removing noise from the received signals without affecting the amplitude of useful signal frequency components. The mathematical expression of the iCWT can be written by
54
:

Experimental setup
The schematic representation of the instrument setup applied to detect leaky HEs is shown in Figure 3. The ultrasonic scanning unit includes a pulser-receiver PR 5072 (Figure 3 (a)), a digital oscilloscope Lecroy 604 Zi (Figure 3 (b)), a computer (Figure 3 (c)), and a water immersion test bench (Figure 3 (d-m)). HE samples were arranged in an array (as shown in Figure 3 (f)). The thin stainless steel plate was used as a guiding arm for the piezoelectric elements denoted by “m” in Figure 3. Stepping motors were used to move the piezoelectric transducers, which allowed them to be positioned at the center of each HE. The specimen used in the testing had an inner radius of 7 mm, a wall thickness of 1 mm, and a length of 150 mm. To simulate a defective condition, the HE was filled with water. In a real application, water would enter the HE if it had side defects. During the scanning of HEs, the guiding arms were shifted horizontally, and ultrasonic scans were performed at the center of each HE. Figure 3 (k) shows the HE can arrangement. As can be seen from the schematic representation, six HEs were scanned when the guiding arms were moved horizontally. In the experiments, various arrangements of intact and leaked HEs were set up. As an example, two intact and four leaked HEs could be arranged differently, or all intact and all leaked HEs could be arranged similarly. A waveform and information regarding the instrumental setup and the state of the HEs were stored for all combinations of intact and water-filled HE arrangements. A total of 18 HE specimens were arranged in an array, and the guiding arms were moved forward and backward three times in order to scan all HEs.

Schematic representation of the instrumental setup: (a) computer; (b) oscilloscope; (c) pulser-receiver; (d) sliding arm; (e) water tank; (f) heat exchangers (HEs) an array; (g) position control motors; (k) top view of the immersion test bench; (l) scaled view of the HE and ultrasonic probe guiding arm; and (m) piezoelectric transducer and guiding arm.
Ultrasonic pulser-receivers must possess low-noise receiving and high-performance pulser units. Pulser-receivers work by creating short high-voltage electrical pulses with a wide frequency bandwidth. The oscilloscope was connected to the laptop computer, and data analysis was performed. The maximum sampling rate of the oscilloscope is 40 GHz/s, which is sufficient for appropriately acquiring signals. As a whole, the ultrasonic scanning device can be divided into two units: the ultrasonic wave processing unit and the water immersion test bench unit. An ultrasonic wave processing unit consists of a computer, oscilloscope, and pulser-receiver, which are used for conventional ultrasonic inspections (Figure 3 (a-c)). Additionally, Figure 3 (d-m) shows the major components of the water immersion test bench, which are water tank, HEs arrays, transducers, guiding arms, etc. Figure 4 shows an image of the water immersion test bench unit.

Water immersion test bench and its components: (a) water immersion test bench; (b) thin piezoelectric element guiding arms assembly; (c) side view of the guiding arm for piezoelectric transducers; and (d) array of heat exchangers (HEs).
From Figure 4 (a), it can be seen that the water immersion test bench itself has a reservoir fabricated from acrylic plates. The assembly of thin ultrasonic piezoelectric elements can be seen in Figure 4 (b), whereas Figure 4 (c) shows a single piezoelectric element and guiding arm. Figure 4 (d) illustrates an array of HEs. In the experiment, a conventional water immersion test bench was used, and environmental parameters such as temperature and water salinity and its content were kept constant. The attenuation rate of wave energy will vary according to environmental parameters, resulting in changing waveform amplitudes. In place of those parameters, the instrument gain was variable in the studies, which was compatible with environmental effects. The experimental investigation aim was to establish a testing method that is independent of nonlinear parameters caused by instrumental setup and piezoelectric probe performance.
Experimental results
An instrumental setup schematically shown in Figure 3 was used for experimental analysis. When the pulser-receiver is applied it generates short-duration impulses, several resonance modes occur in the piezoelectric patch transducer. The multiple frequency bands produced by the piezoelectric transducer are caused by its lateral, thickness resonance modes, and their harmonics. Due to the dispersion properties of the CW, each frequency component excites multiple Lamb wave modes. The excited Lamb wave signal propagates along the circumference of HE.
As mentioned in “Experimental Setup” section, each HE was scanned by locating the piezoelectric element at the center of HEs. Experiments were conducted with intact and water-filled HEs, and Figure 5 shows the waveforms measured from the center of the HEs. The solid blue line in Figure 5 corresponds to the signal from the non-defective HE, whereas the red line from the water-filled HE represents the defective case. HEs with and without defects have low- and high-frequency components, which are associated with the piezoelectric element's resonance frequencies. The time domain waveform was limited to 15 ms to avoid receiving longitudinal waveforms from the end of HE. From Figure 5, it can be seen that CW packets arrive from the HE between 4 and 10 ms, whereas later wave packets indicate waveforms through the water. In addition, both intact and water-filled HE waveforms contain different frequency components, so mixing multiple frequency bands complicates the process of identifying leaky waveforms and extracting distinguishable features for classification.
Circumferential wave (CW) from the center of the heat exchanger (HEs). The blue line corresponds to safe HE, and the red line for defective HE.
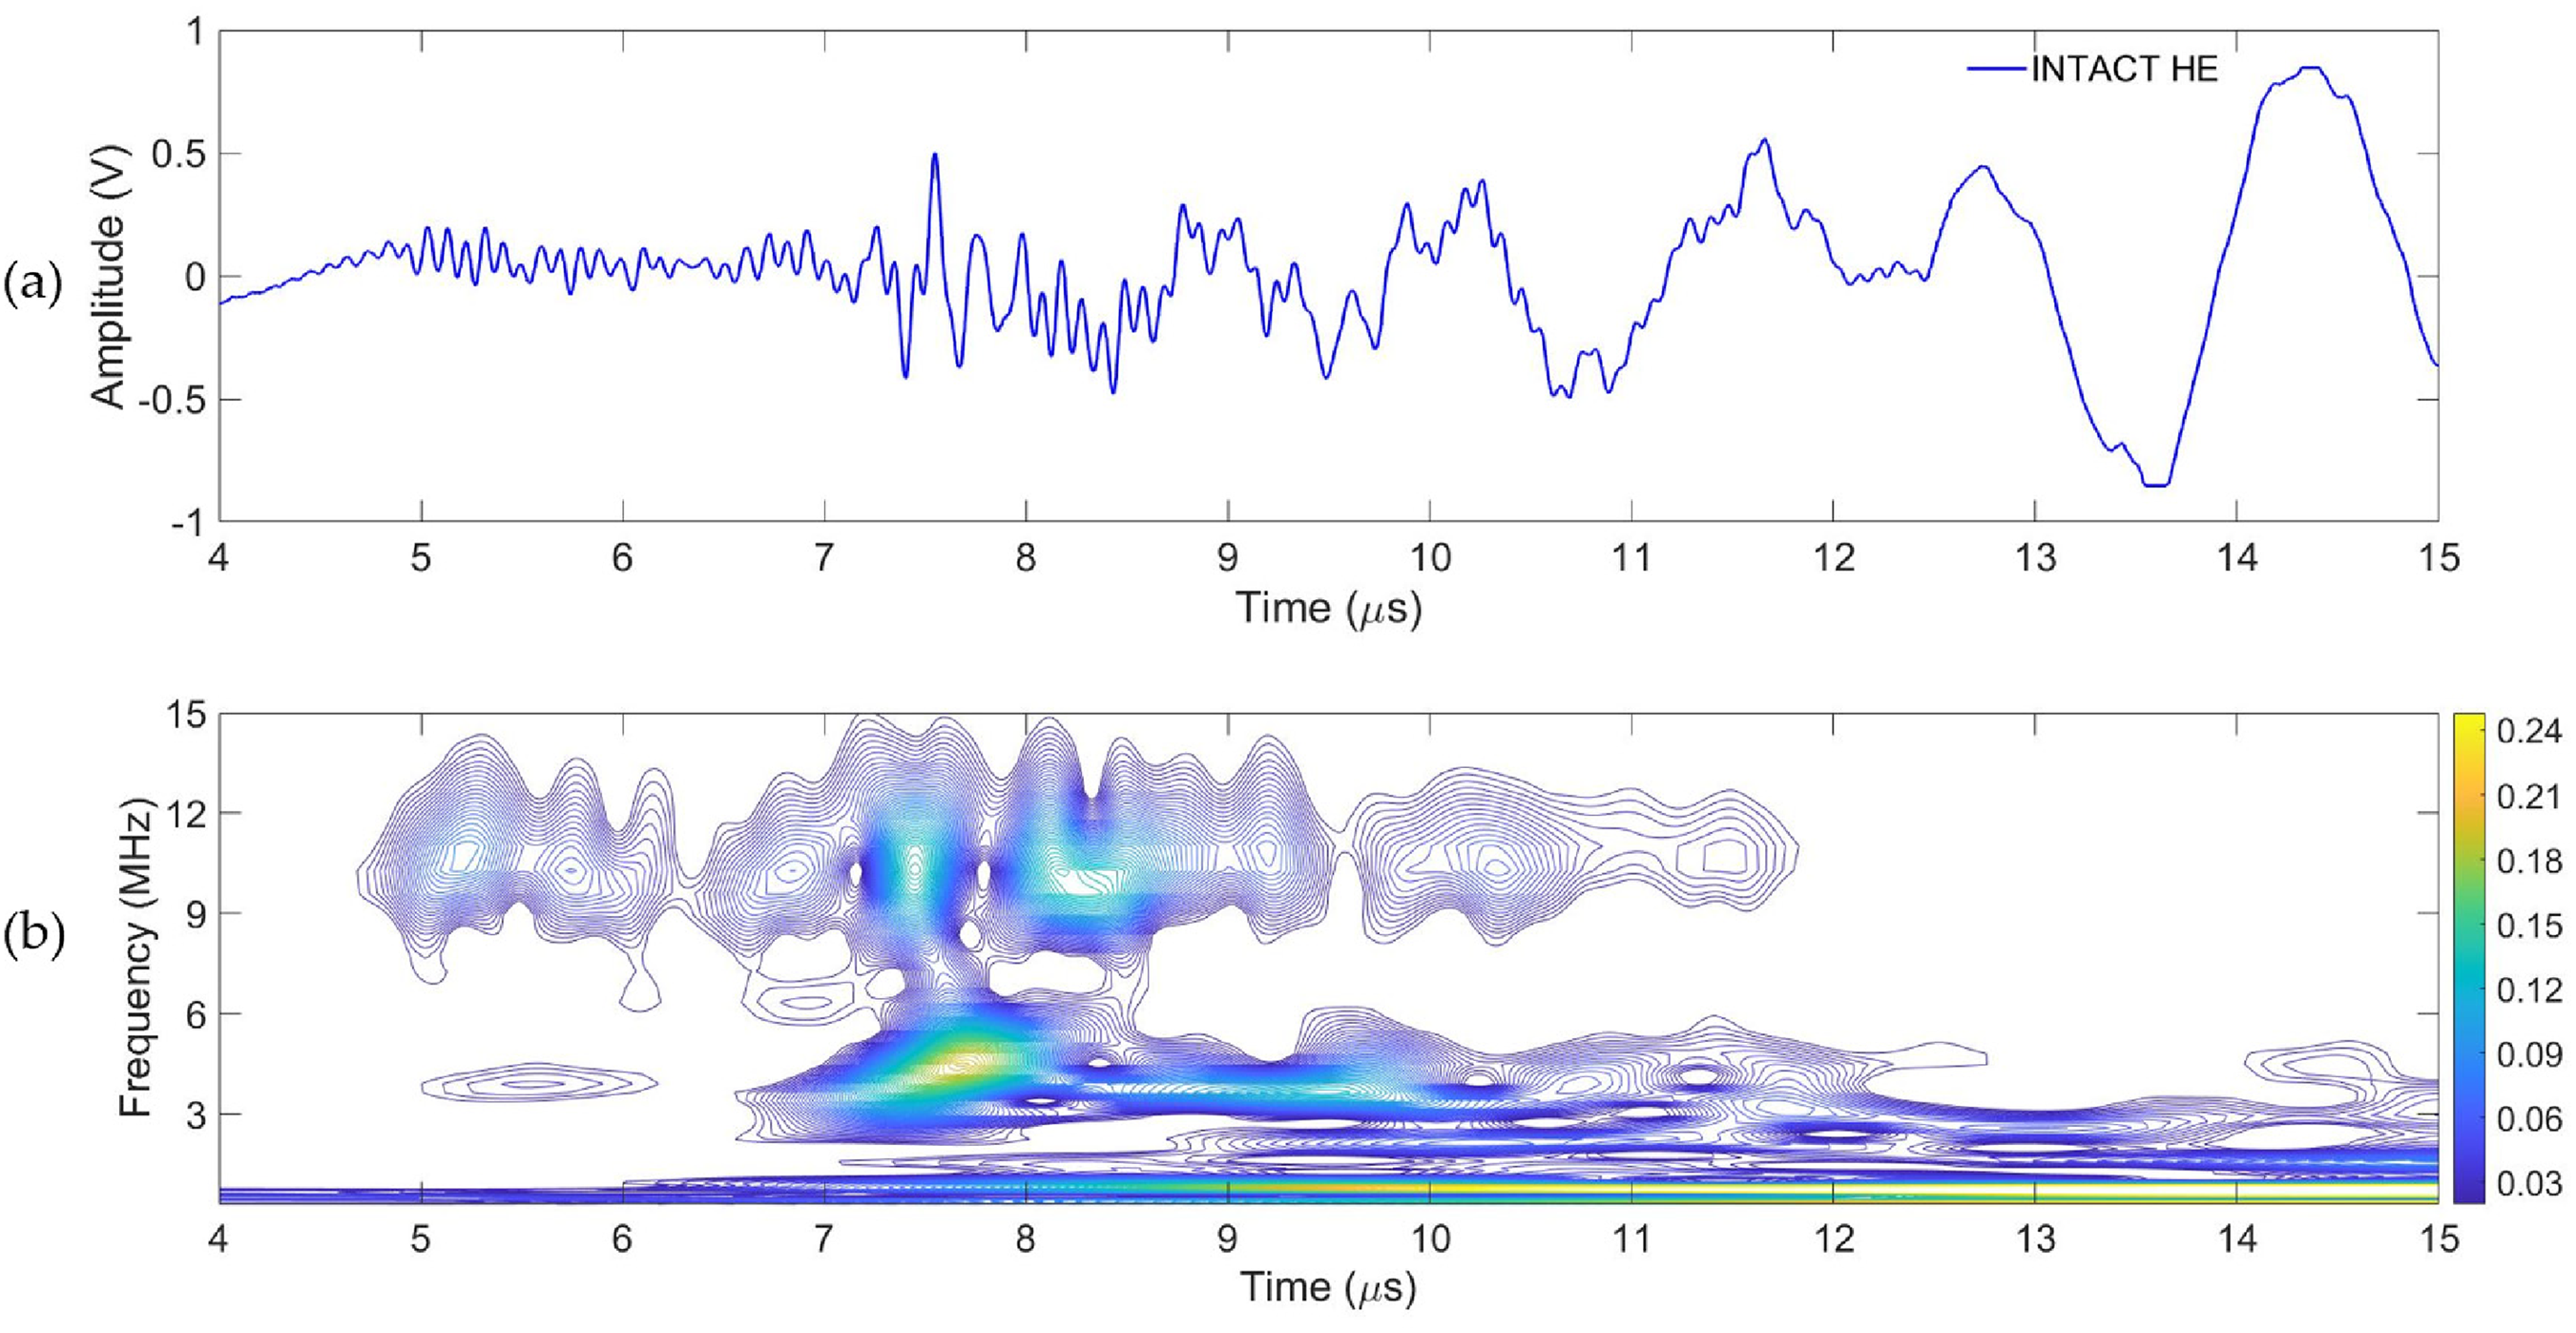
A waveform from defective HE is shown in Figure 6 (a), while its time–frequency representation by CWT is shown in Figure 6 (b). The time–frequency plot of the waveform (Figure 6 (b)) shows that wave packets have both high and low frequencies, which correspond to the thickness and lateral resonance modes of the piezoelectric transducer. A waveform with a frequency band between 4 and 5.5 MHz corresponds to the thickness-shear modes, and a high-frequency component is caused by the thickness extensional modes of the thin ultrasonic element. Time–frequency plot (Figure 6 (b)) of the waveform shows that the frequency components of the received CW packets fully correspond with the measured resonance frequencies of the piezoelectric transducer according to Figure 2.
Waveform analysis: (a) time domain circumferential wave (CW) from the defective heat exchanger (HE); (b) time–frequency representation of (a).
Similarly, a waveform from the intact HE was analyzed in the time–frequency domain by CWT. Figure 7 (a) shows the measured signal in the time domain, and Figure 7 (b) shows the CWT of the same waveform. In Figure 7 (b), both low-frequency wave packets (below 1 MHz) and the high-frequency component (above 10 MHz) can be seen in the time–frequency domain represented waveform. A thickness-shear mode can also be observed between 4 and 5.5 MHz, as shown in Figure 7 (b). As with the defective HE waveform, the frequency bands of the intact HE signal correspond to the resonance frequencies of the piezoelectric patch transducer shown in Figure 2. The presence of the high-frequency signal component along with the low-frequency signal makes it extremely difficult to separate leaky Lamb wave packets from the time domain waveform.
The time domain circumferential wave (CW) from intact heat exchanger (HE) in (a), and the time domain CWT from the time domain signal in (b).
CWT and iCWT technique was used to separate frequency bands corresponding to the resonance of the piezoelectric element. Initially, the lower frequency component in the range of 0.01–1 MHz was separated from the measured signal, and filtered waveforms are shown in Figure 8. The lower frequency component of the original waveform corresponds to the lateral resonance frequencies of the thin piezoelectric element. The CW wave packets cannot be excited by the lower frequency component (below 1 MHz), because all these modes possess transverse waveforms. Due to the low viscosity of the liquid, the transverse wave does not propagate through the water. And in the current case, wave mode conversion occurs, which reduces the efficiency of both the transmitter and receiver.
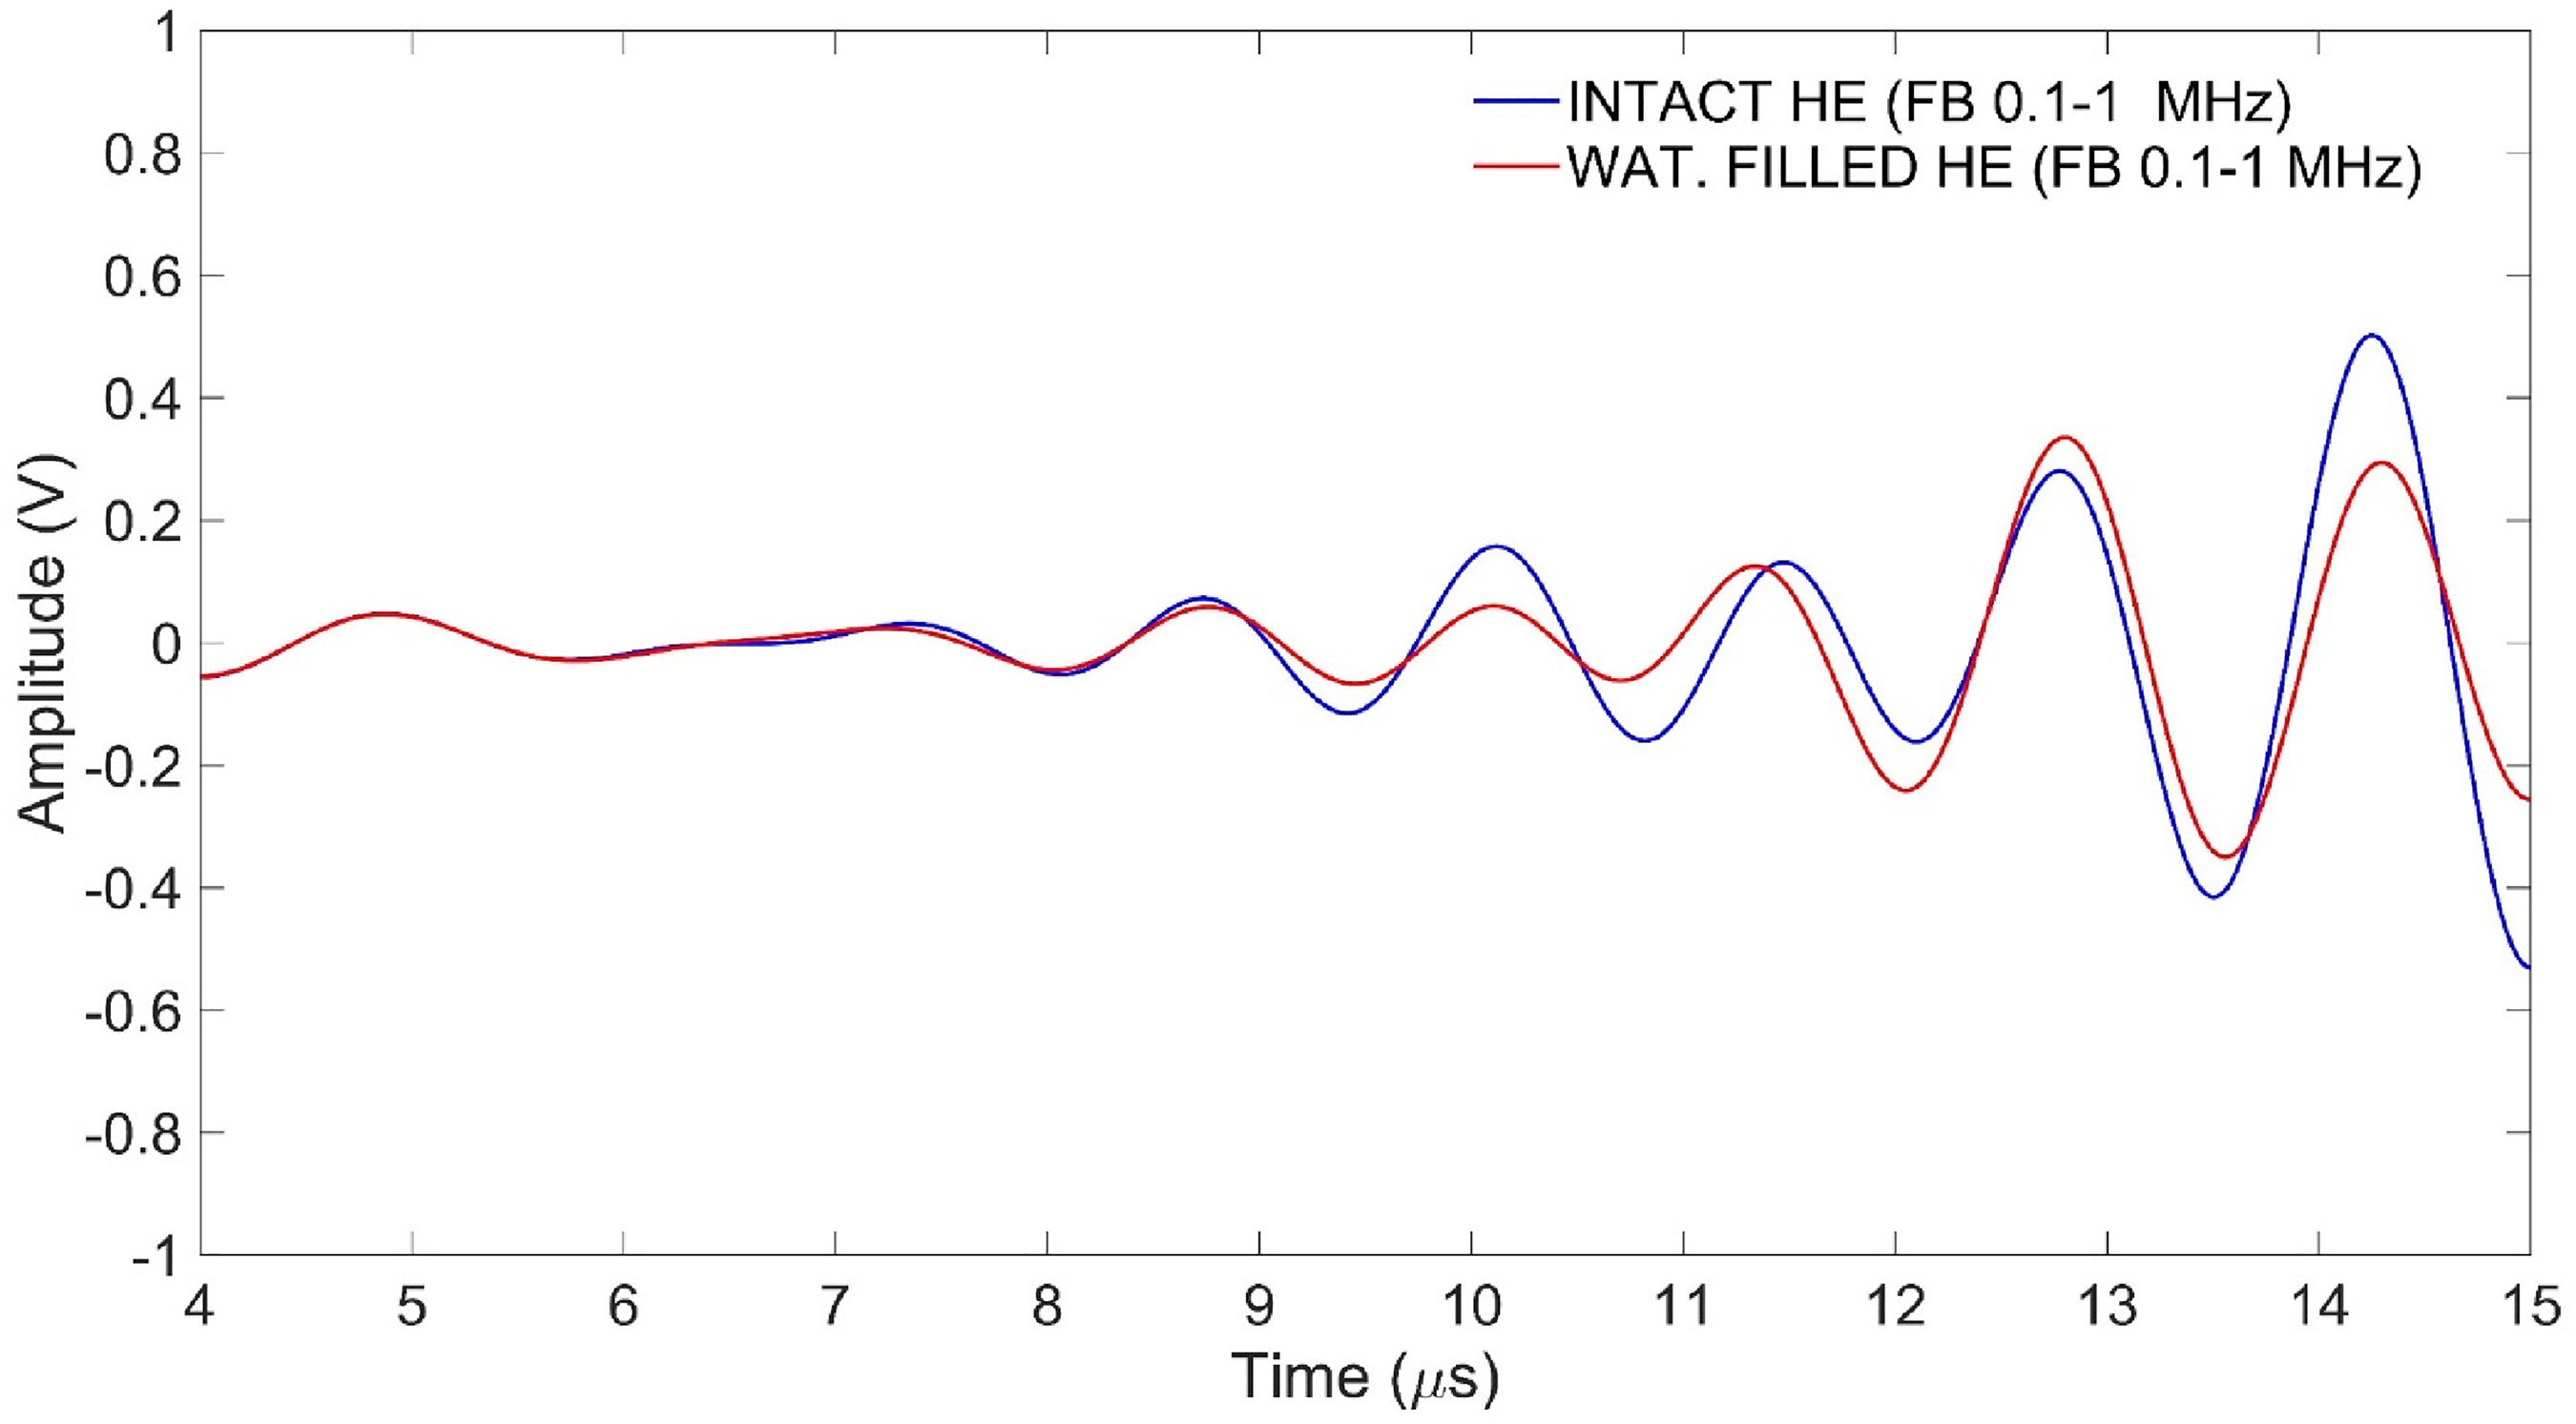
Continuous wavelet transform (CWT) and inverse CWT (iCWT) in the frequency from 0.01 to 1 MHz; the blue line is intact heat exchanger (HE) and the red line is water-filled.
The CWT and iCWT were also applied to separate the frequency range between 4 and 5.5 MHz, and waveforms are shown in Figure 9. A thickness-shear mode is present together with higher harmonics of lateral modes between 4 and 5.5 MHz frequency bands. Figure 9 shows several CW packets in the time range between 4 and 10 ms. From the results in Figure 9, it can be seen that the fastest CW packets are less sensitive to the defective HE (water-filled HE). However, slower wave packets (in the time range between 7 and 10 ms) show a clear difference between the nondetective and water-filled HE.
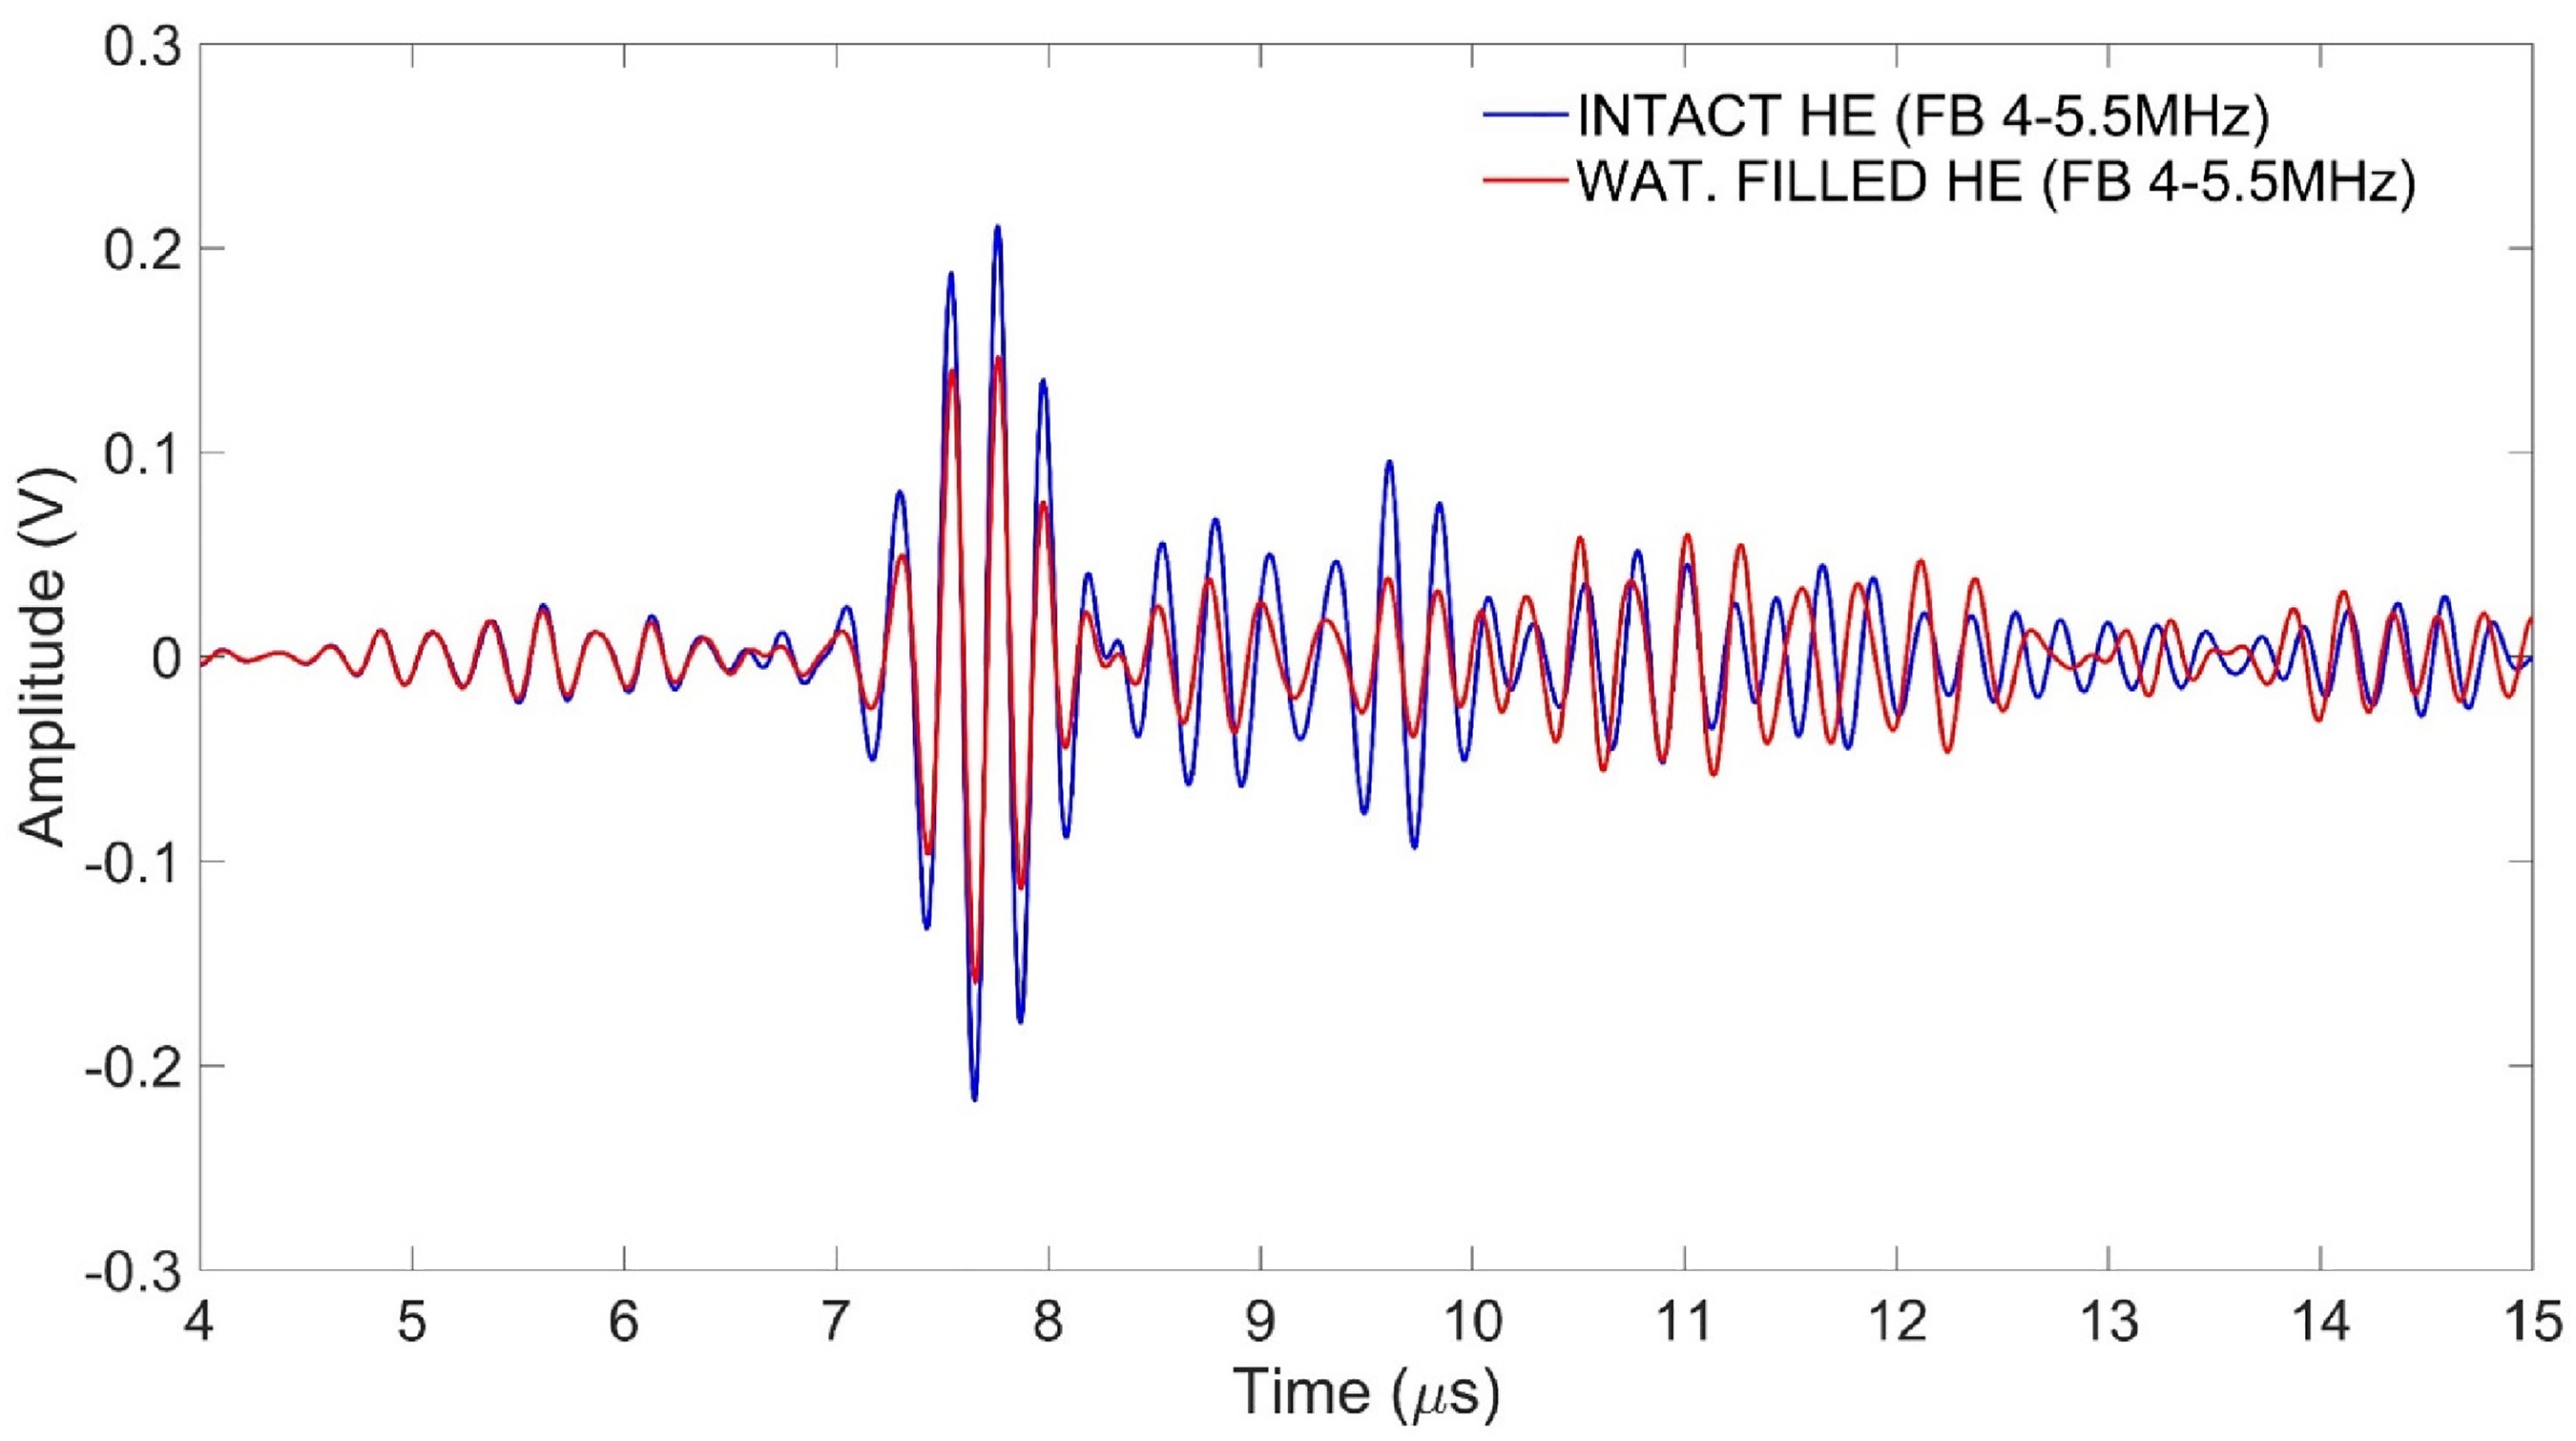
Filtered waveform by continuous wavelet transform (CWT) and inverse CWT (iCWT) in the frequency band from 4 to 5.5 MHz.
Lastly, the higher frequency components have been separated from the originally measured signal (as shown in Figure 5) by applying CWT and iCWT. The highest frequency corresponds to the thickness extensional mode of the patch-type piezoelectric element. In the thickness resonance mode, the piezoelectric element becomes the most sensitive. As shown in Figure 10, CWs have a dispersive property, which results in several wave packets appearing between 4 and 10 ms. In thickness extensional modes, the piezoelectric transducer plate oscillates outward by exciting longitudinal waveforms. Since only longitudinal waveforms travel in water, this leads to more sensitivity to excitation and better reception of signals in modes corresponding to thickness extensional modes compared to other resonance modes.

The high-frequency component of the circumferential wave (CW) is filtered by continuous wavelet transform (CWT) and inverse CWT (iCWT) methods between 9 and 11.5 MHz.
Measured waveform parameters depend on the instrumental setup configuration as well as the sensitivity of the ultrasonic probes. The HE classification is only determined by waveform amplitude, whereas the wave amplitude is greatly affected by the instrument performance and setup. Also, the gain of the instrument affects the amplitude of the received signal. When the gains of the instrument are high, the waveform becomes saturated, which increases noise levels and limits the increase of the main signal. Low levels of the instrument gain reduce the signal-to-noise ratio. Therefore, properly selected instrumental gains are desired. Instrumental setups such as cable and probe aging affect the amplitude of the waveform as well as the signal-to-noise ratios. In this, we propose to use DNN for the automatic detection of the defective HE, and the details of the DNN are described in the following section.
Neural networks
The purpose of this study was to implement a conventional DNN to provide automatic classification of the state of HE. The experimentally measured waveform is significantly affected by the instrument setup, the sensitivity of the ultrasonic probes, and other external factors. Manual inspection of HE requires a qualified NDT person, and the accuracy of ultrasonic inspection is highly dependent on experience. Due to the large number of parameters involved in HE inspection, setting thresholds for signal amplitude is almost impossible. To eliminate measurement errors, a DNN-based automatic classification method is proposed in this research. By using the DNN algorithm, one of the primary objectives is to enable automatic classification despite nonlinearities in the piezoelectric probe sensitivity, instrumental setup, etc. By applying DNN, ultrasonic testing accuracy and speed can be improved. Direct transmission of the wave signal in the water is also used to determine the performance and setup of the transducer.
Any nonlinear function can be approximated by applying DNN,55,56 and in the current application, the relationship between the waveform features and the HE state is approximated by DNN. During the training of the DNN, input data can propagate toward the hidden layers. The weights and biases of the DNN are optimized during the forward and backward propagation of information in DNN structures. The performance of the DNN is influenced by many parameters, such as number of epochs, batch size, hidden layer quantity, learning rate, dropout length, number of neurons in the hidden layer, etc. Arbitrarily setting hyperparameters reduces prediction accuracy, requiring more training time and extensive data to reach satisfactory accuracy. DNN hyperparameters can be optimized using a variety of methods: adaptive boosting, extreme gradient boosting, kNN, Random Forest, Bayesian approach, etc.57–59 For this study, the Bayesian optimization method was selected due to its simplicity and robustness as compared to other optimization methods.
When the Bayesian approach is implemented, a range of parameters must be chosen. In the proposed method, the Bayesian approach has been applied to define optimum values of parameters such as the number of epochs, number of hidden layers, learning rate, size of batches, dropout rate, activation function, and optimization functions. The first and second columns of Table 1 show the list of hyperparameters and their corresponding ranges. A Bayesian optimization method introduces a variety of activation and optimization functions as shown in Table 1, and the type of function affects the accuracy of DNN predictions. 57
Hyperparameters ranges and optimal values.

As a result of the Bayesian optimization procedure, the optimal hyperparameters were obtained, and those values have been shown in the last column of Table 1. Although the Bayesian approach could be extended further to define the optimal number of neurons in each hidden layer, in this study the number of neurons was kept equal in each hidden layer. Although DNN was built on the Google Colab platform utilizing Keras modules, the suggested DNN structure can be implemented on other platforms as well. A schematic representation of the proposed DNN is shown in Figure 11, which predicts HE states with five types of waveforms. In the DNN, the directly transmitted waveform in the water and the CW waveform measured at the center of HE were combined with signals filtered in the frequency ranges of [0.1 1], [4 5.5], and [9 11.5] MHz.

Structure of a deep neural network (DNN) for automatically identifying heat exchanger (HE) states in water immersion tests.
To train the neural network with enough measured waveforms, the HE was tested with different instrumental gain configurations. It is not possible to specify a standard for setting up an instrumental gain; however, it is usually done based on the inspector's experience. In addition, there are many variables associated with the connection as well as ultrasonic sensitivity, which result in a variation of the signal. Ultrasonic instruments with low ultrasonic gain settings will reduce the signal-to-noise ratio, and these conditions correspond to an aged piezoelectric probe. Moreover, a high instrumental gain setting also reduces signal-to-noise ratios due to waveform saturation. In addition, we used four pairs of piezoelectric patch transducers in this experiment by exchanging them as pulse generators and receivers, which allowed us to examine variations in sensitivity. The ultrasound waveform is measured from the center of the heat exchangers and filtered by CWT and iCWT. Additionally, the waveforms measured in the absence of HE were also recorded.
In DNN models, prediction accuracy is mainly affected by the distribution of the training and testing datasets. The optimal distribution of those datasets can significantly impact DNN precision and computation time. It is possible to train DNN faster with fewer data, but testing accuracy may drop significantly with fewer data as well. Also, R2 scores can be used to evaluate the effect of dataset distribution on the performance of the DNN. Using the R2 score method, we can evaluate how well the DNN fits the model. A DNN's R2 score describes its predictive and extrapolative performance, which can be expressed mathematically as follows: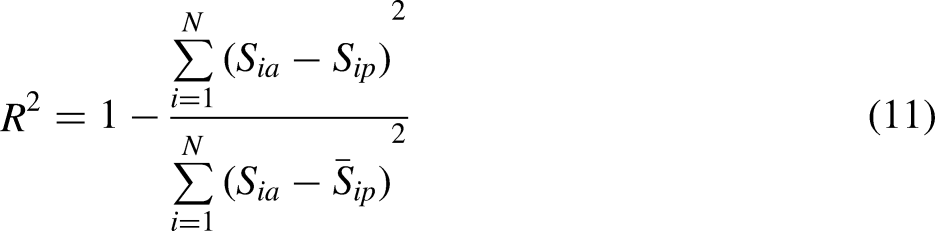
Training and testing data distribution and corresponding R2 score values.

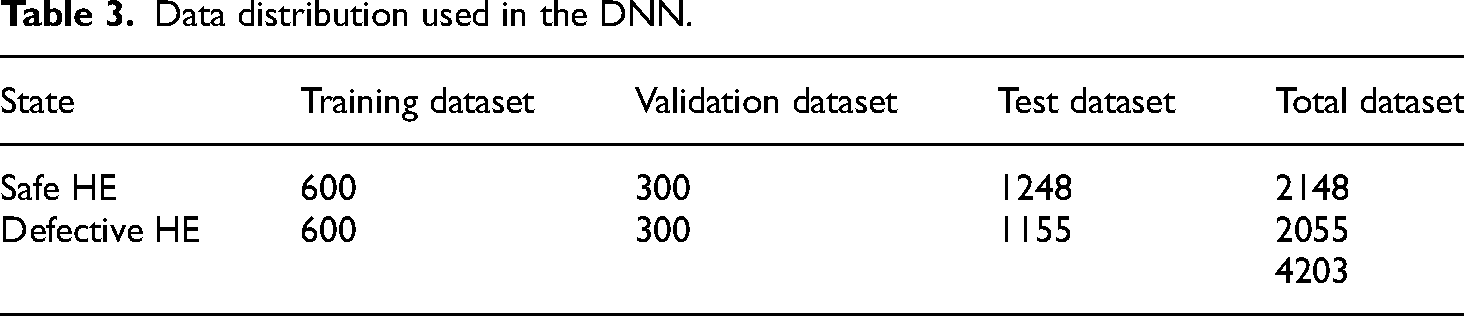
From Table 2, it can be seen that increasing the distribution of training data has a positive impact on the performance of the DNN. There was no significant improvement in R2 score values above 30% of the training data. During the training and validation of the proposed DNN, the optimal DNN parameters defined by the Bayesian algorithm were set. Overall, 30% of waveforms were used for training and the remaining for validation and testing of the DNN. Table 3 below illustrates the distribution of data.
Data distribution used in the DNN.
Incorrectly designed DNN parameters and poor distribution of training and validation datasets lead to underfitting and overfitting. Overfitting occurs if the parameters of a DNN are not precisely chosen so that the noise signal is considered a feature during the training process. An overfitted DNN structure shows a high level of accuracy at the training stage but produces poor predictions at the test stage. Similarly, underfitting of DNNs can result from the improper design of DNN parameters, so that the DNN does not fit the model. Whenever the DNN model is underfitted, the R2 value in both the training data and the validation data is low.
A confusion matrix is used to show the prediction results of applied DNN, which provides a comparison between the predicted value and the actual value. As can be seen from Figure 12, the confusion matrix illustrates how DNN classifies particular class data, which allows for a clear display of prediction accuracy. A neural network's accuracy is determined by the ratio of correct predictions to overall predictions.
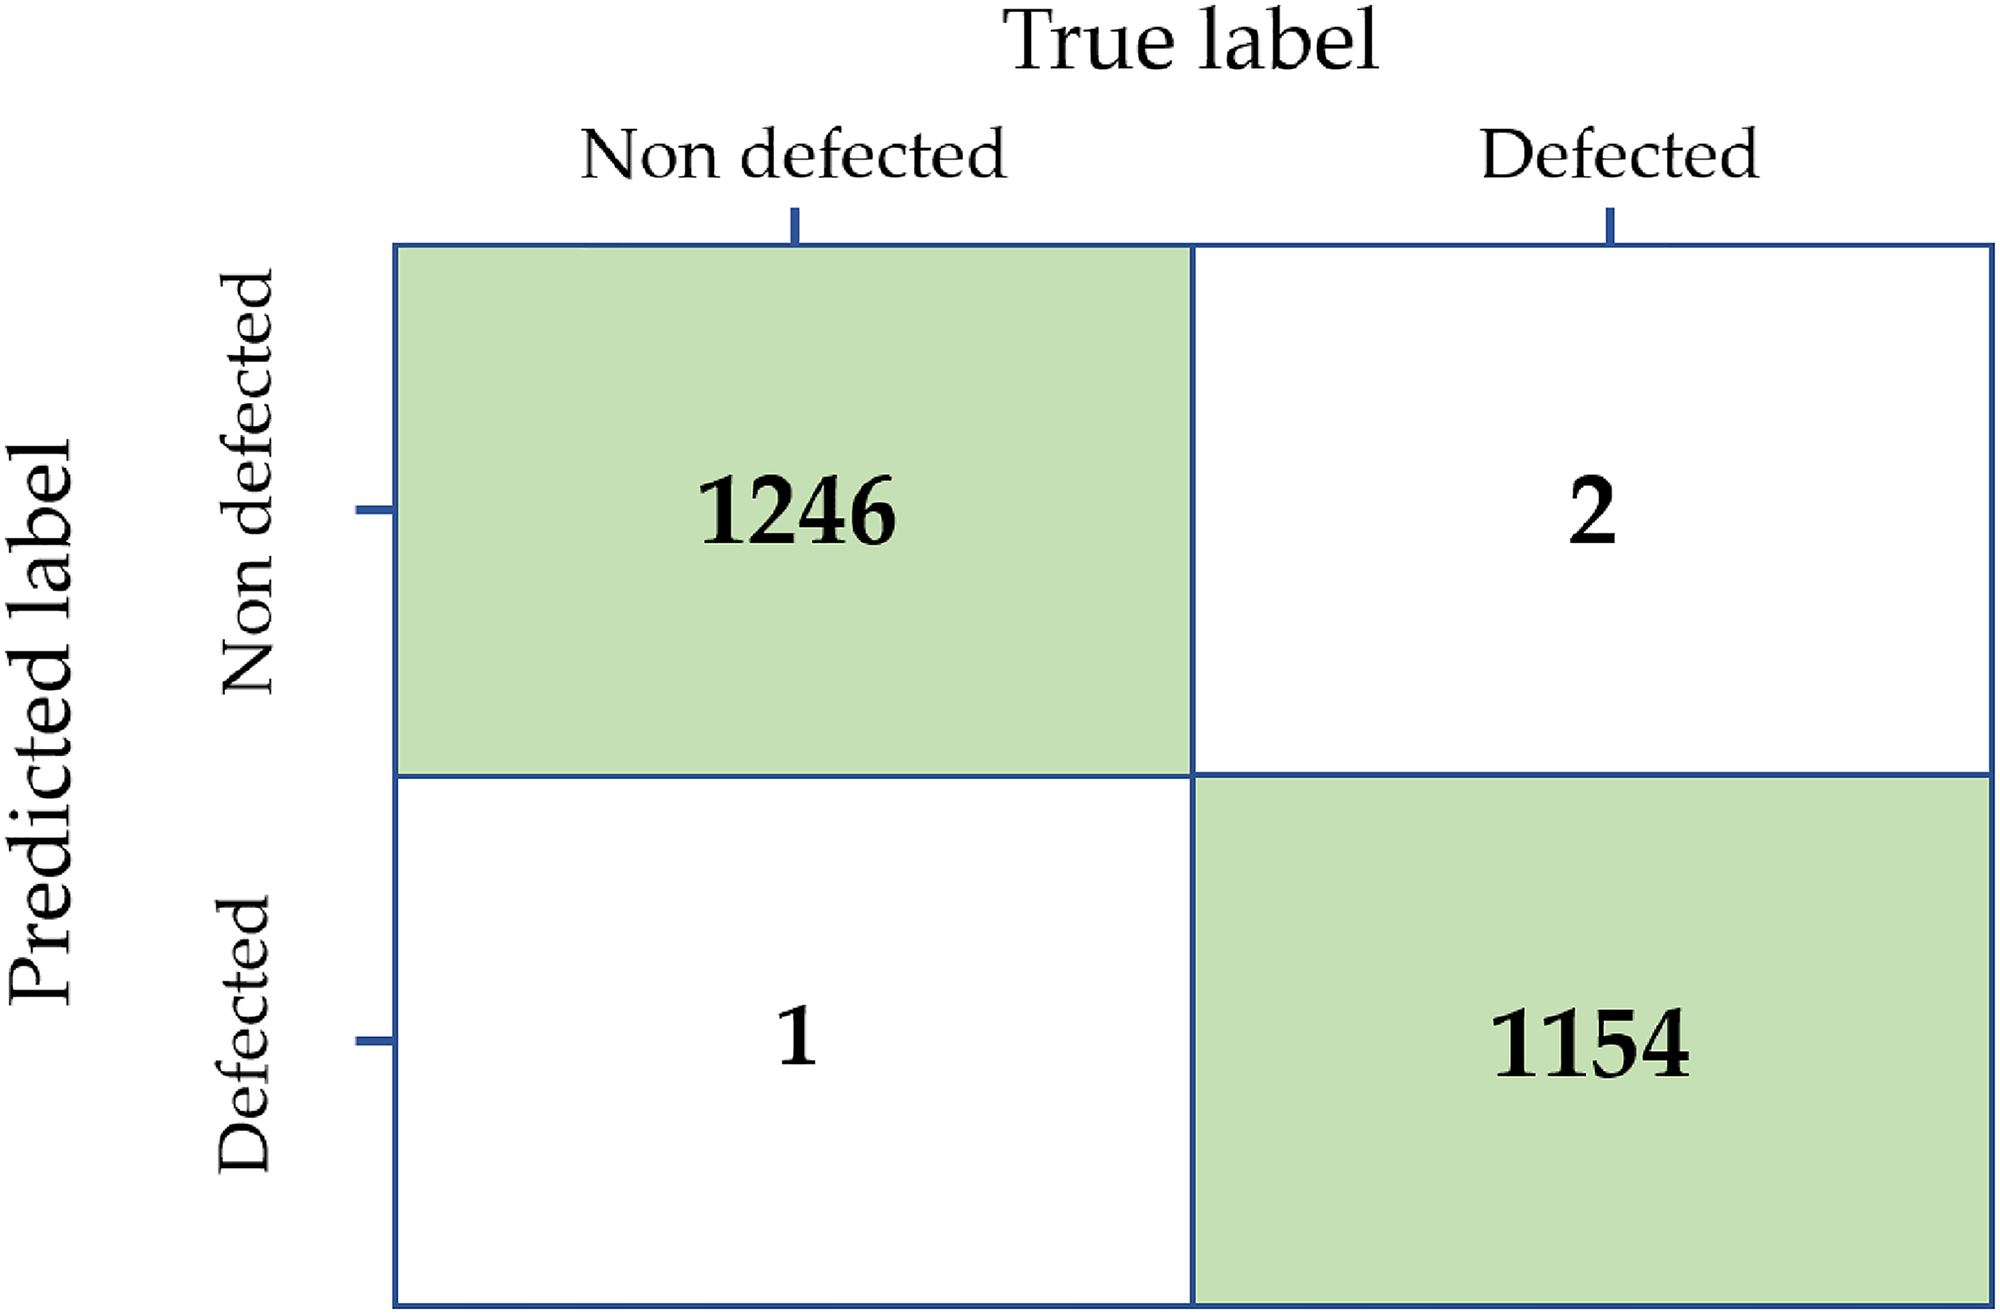
The confusion matrix of prediction and true labels of heat exchanger (HE) state estimation using deep neural network (DNN).
In the above formula, TN is a true negative, TP is a true positive, a false positive is FP and FN indicates a false negative. The accuracy of the DNN was estimated at 99.99%, which means almost all predicted values were correct. According to our DNN model, we were able to predict almost all leaky HEs regardless of their instrumental settings. This also indicates that the selected waveforms were highly sensitive to the amount of water inside HEs. DNN algorithms can reduce human-related errors during HE inspections and allow prediction of HE state regardless of the instrument gain setting.
Discussion
The patch-type piezoelectric transducer generates multiple frequency bands when excited by the pulser-receiver. Multiple CW modes are excited by each frequency band of the waveform generated. Both intact and water-filled HEs are excited at multiple frequencies and lead to several CW modes, as shown in Figures 5 and 6. Each frequency band of the received signal corresponds to the lateral and thickness resonance modes of the applied thin piezoelectric transducer. The different frequency bands in the received signal make it difficult to distinguish leaky CW without signal processing.
In this study, the CWT and iCWT methods were applied to separate the waveforms corresponding to the resonant frequency mode of the piezoelectric patch probes. The three main frequency components corresponding to the thickness-shear, thickness-extension, and lateral modes of the waveforms were selected for wave processing, as can be seen in Figures 7–9. The frequency of ultrasound probes plays an important role in the accurate classification of HE. Theoretically, the lower frequencies of the CW wave are best suited for ultrasonic inspection because the wave contains a waveform with the greatest out-of-plane motion. CWs with a significant out-of-plane component lead to leaky wave modes that are highly sensitive to water inside HEs. However, with thin piezoelectric patch probes, transverse waves are excited at lower frequencies (less than 1 MHz), and these signals correspond to lateral resonance modes and their harmonics. Due to the low viscosity of the water, the transverse wave cannot be propagated in the water. Accordingly, no wave packet is received between 4 and 10 ms at the low frequency (below 1 MHz) of the waveform, as shown in Figure 8. Differently, wave frequency components in the range of 4–5.5 MHz excite CW and show relative sensitivity to water leak HEs. The frequency bands in the range of 4–5.5 MHz are excited by the thickness-shear resonance mode of the piezoelectric element. According to Figure 9, the water-filled HE showed a wave amplitude drop between 7 and 10 ms due to leakage of wave energy in defected HEs.
Compared to other frequency bands, the higher frequency component associated with the thickness extensional mode showed more sensitivity to leak HEs. In the thickness extensional resonance mode of the piezoelectric element, the plate oscillates out-of-plane by exciting longitudinal waves in the water. As can be seen from Figure 10, the wave amplitude shows a leaking effect for the wave packet in the time range between 7 and 10 ms. Additionally, by comparing waveforms in Figure 10, it can be seen that high-magnitude wave packets appear after 10 ms in water-filled HEs. These are direct waves traveling through the water inside the leaky HE. Only longitudinal waves propagate in water, and longitudinal waves propagate slower than CW, resulting in slow wave packets that arrive after 11 ms. Although intact HE does not contain water, it consistently produces no wave packets after 11 ms.
The operating environment of HEs can vary, including temperature, pressure, and water salinity. The suggested instrumental setup does not include the variation of those parameters. Many researchers have found that temperature affects wave attenuation.60,61 In addition, the increase in pressure in HE reservoirs also affects signal amplitude.62,63 Moreover, water salinity in HE may also vary due to a variety of external factors. An increase in water salinity results in a faster attenuation of the waveform.64,65 Additionally, ultrasonic inspections of the HE occur primarily when the operating system is shut down, 66 which corresponds to an atmospheric pressure environment in the reservoir of the HE. Furthermore, most parameters that vary due to the surrounding environment of the HE reservoir may lead to decreases in the waveform amplitude, so in the laboratory-based experiments, parameter effects were artificially created by varying the pulser-receiver gain. Because the variation of instrumental gain affects the signal amplitude.
Applied DNN enables sorting the state of the HE automatically. Several features of waveforms can be used to distinguish them. A DNN was used to automatically define the characteristics of waveforms and to classify them into intact and water-filled cases. Using DNNs, the proposed algorithm showed a high prediction accuracy of 99.99% for detecting defective HEs. A number of recent studies have investigated kNN, support vector machine algorithms, and fully connected DNN to detect leaked HE, and their efficiency was around 99%. 67 In addition, convolutional RNN-based inspections of pipes showed just 98%. 68 The current study analyzed closely arranged HEs and demonstrated that CWT and iCWT-based signal processing, along with DNN with multiple waveforms, had higher detection accuracy than the alternative method.
Conclusions
In this study, we have investigated a patch-type piezoelectric probe for inspecting narrow-spaced HEs immersed in water. Based on the experimental results, the following conclusions can be drawn:
Multiple frequency bands are generated when the patch-type piezoelectric ultrasonic probe is excited by the pulser-receiver. Due to the dispersion property of the CW, each frequency band excites many CW modes with different frequencies. According to the time–frequency analysis of the waveforms performed by CWT, the received waveforms from both intact and defective HE frequencies are the same as the resonance mode of the piezoelectric probes measured by the impedance analyzer. Wave processing based on wavelet analysis has been used to separate different frequency bands of the CWs. Frequencies, corresponding to lateral and thickness resonance modes were separated by using the CWT and iCWT, allowing for better distinction of intact from water-filled HE. Filtered signals by CWT and iCWT allow separate wave modes which are most sensitive to water-filled HEs. A lower frequency component (below 1 MHz) of the signal generates the transverse waveform due to the later oscillation of the piezoelectric element. Because of the low viscosity of water, transverse waves cannot propagate, resulting in poor signal reception. Frequency bands corresponding to the thickness lateral and thickness extensional modes showed a clear difference between waveforms from the intact and water-filled HEs. CW modes suffer waveform amplitude drop for the water-filled HE, due to the leaks of the ultrasound energy. Also, the wave packet propagated through water and showed a high peak amplitude signal, after 11 ms for the water-filled HE. Through transmission signal in the water of the HE, the specimen can be used as a reference, which will indicate the performance of the ultrasonic probe and instrumental gain setups. The results of experiments show that directly transmitted waves can be used as an indicator of the instrument's and probe's sensitivity to water. The experiments have been carried out through the use of five types of waveforms such as transmission waves in water, the signal from the center of the HE, and three filtered waveforms generated by CWT and iCWT. Hyperparameters of the DNN were optimized by the Bayesian optimization approach. As a result of the proposed DNN structure, it automatically classified the states of heat exchangers with high accuracy, which was estimated at 99.99%.
Footnotes
Authors' contributions
Declaration of conflicting interests
The author(s) declared no potential conflicts of interest with respect to the research, authorship, and/or publication of this article.
Funding
The author(s) disclosed receipt of the following financial support for the research, authorship, and/or publication of this article: This work was supported by the National Research Foundation of Korea (NRF) grant funded by Korea government (MSIT) (grant number NRF-2020M2D2A1A02069933).
Author biographies
Azamatjon Kakhramon ugli Malikov is a PhD student at Pusan National University. His particular research interest is the application of artificial intelligent models to ultrasonic inspection systems.
Yunho Cho is a professor at Pusan National University, Korea. He received his PhD in Engineering Science and Mechanics from Pennsylvania State University. He is developing a technical diagnostic system that applies to the engineering of reliability analysis and diagnostics (structural health monitoring) of mechanical equipment. His laboratory is designated as a World-Class Research Center for World-Class Universities by the National Science Foundation, where he conducts research and develops world-class talent through ongoing government grants.
Young H. Kim is a researcher at the Institute of Nuclear Safety and Management, Pusan National University, Busan, Korea. He received his PhD in Physics from KAIST. He has worked as a principal researcher at the Korea Research Institute of Standards and Science, a visiting researcher at the National Bureau of Standards and Iowa State University, the head of the KIECO R&D Center, a research professor at Sungkyunkwan University, and a teacher at the Korea Science Academy of KAIST. He has served as a lecturer at several universities, including Seoul National University and Pusan National University. He is interested in wave propagation and gifted education.
Jeongnam Kim is a PhD student at Pusan National University. His research interests include guided waves, structural health monitoring, nonlinear analysis, long-range inspection, and viscoelastic materials.
Hyun-Kyun Kim is a principal researcher at the Nuclear Fuel Safety Research Division of the Korea Atomic Energy Research Institute.