
Abstract
The aim of this study was to explain the mechanical differences between EdgeTaper Platinum (ETP) and ProTaper Gold (PTG) determining the transition temperatures and the composition of the alloy of ETP, since no data are present in literature. A total of 130 instruments were selected: 65 ETP F2 and 65 PTG F2. 20 instruments per type were submitted to each mechanical tests. The cyclic fatigue and torsional tests were performed at a pre-set temperature of 35 °C ± 1 °C. During the cyclic fatigue test, Time to fracture, number of cycles to fracture (NCF) and the fragment length (FL) were recorded. During the static torsional, Torque to Fracture (TtF) and FL were recorded. The fracture surface of 5 randomly selected fragments from each test was examined through a Scanning Electron Microscopy (SEM) and an EDX analysis was performed. 20 instruments per type were submitted to a bending test The force generated (grams) to bend each was recorded. Recorded data of mechanical and metallurgical tests were statistically analyzed using a one-way analysis of variance (ANOVA) test with significance set to a 95% confidence level. ETP F2 showed a higher cyclic fatigue resistance and bending ability than PTG F2, with a statistically significant difference (p < 0.05). PTG showed a higher torsional resistance with a statistically significant difference (p < 0.05). DSC analysis of 5 samples for each instrument type pointed out that the austenite finish temperature of PTG was higher than the ETP, respectively of 49.99 ± 3.31 (°C) and 38.92 ± 1.75 (°C). EDX analysis confirmed the near-equiatomic composition of the Ni-Ti alloys, with a presence of a third component recognized as rubidium in the ETP samples. ETP showed higher flexibility in comparison with PTG, despite the latter is characterized by a more martensitic characterization. since its Af temperature is higher than the ETP.
Keywords
Introduction
The intracanal separation of Ni-Ti rotary instruments is one of the most concerns for endodontists. As thoroughly studied, the main causes of failure are cyclic fatigue, excessive torsional loads and the combination of these two factors.1–3 The first one is a direct consequence of the continual tension and compression stress, whilst the second one is caused by the locking of a part of the instrument in the canal, while the file shank continues to rotate. 4 As previously stated, mechanical resistance of Ni-Ti instruments is determined by several factors related to the instrument. The cyclic fatigue resistance is mostly influenced by the metal mass and heat-treatment, while the torsional resistance is defined by the cross-sectional design, the length of the instrument and its stiffness, a direct consequence of its crystallographic phase.5–8
The Ni-Ti alloy can be characterized by two different crystallographic phases according to the temperature and the stress at which the endodontic instrument is subjected: the austenite and the martensite. 9 The better way to explain the phase transformation of Ni-Ti alloy is undoubtedly through the hysteresis diagram. In fact, it clearly shows the points of the martensite start temperature (Ms) and the martensite finish temperature (Mf) within which an increasing amount of austenite is transformed in martensite, and the austenite start temperature (As) and austenite finish temperature (Af) within which an increasing amount of martensite is transformed in austenite. Thus, below the Mf temperature the Ni-Ti alloy is represented by martensite and above the Af temperature it is represented by austenite.10,11 As demonstrated by several studies, the transformation temperature range (TTR) is influenced by different factors such as the differences in the starting wire blanks, the manufacturing procedures of the instrument (milling, twisting or electrical discharge machining) and the heat-treatment used by the manufacturer.12,13
The conventional Ni-Ti alloy (austenite) is stable at ambient and intracanal temperatures, with the Af temperature below the 25 °C that permits a superelastic behavior of the instrument. Nevertheless, in the last decades, several heat treatments have been introduced by manufacturers to obtain stable martensitic instruments at ambient and intracanal temperatures. They are characterized by improved cyclic fatigue resistance, softness, ductility and greater flexibility that allows the instrument to better adapt to intracanal anatomy. 13
The crystallographic phase of the Ni-Ti alloy, TTR and the effect of heat-treatments are conveniently studied using the differential scanning calorimetry (DSC), in which the difference in thermal power supplied to a test specimen and an inert control specimen heated at the same rate is measured very accurately.14,15 As stated by Brantley et al. the structural transformations of the Ni-Ti endodontic rotary instruments are revealed as endothermic peaks on the heating DSC curves and as exothermic peaks on the cooling DSC curves, and information is obtained about the temperature ranges and enthalpy changes for the phase transformations. 12
To improve the flexibility and the cyclic fatigue resistance of Ni-Ti endodontic instruments, manufacturers have developed several heat treatments enabling the widespread of martensitic instruments. For example, recently, EdgeEndo (Albuquerque, NM, US) has introduced several file systems characterized by similar shape, manufacturing process, and preparation techniques to other file systems on the market. In particular, the EdgeTaper Platinum (ETP) system (EdgeEndo, Albuquerque, NM, US) has been introduced in the marketplace with the claim to propose an endodontic systematic similar to the ProTaper Gold (PTG; Dentsply Sirona, Ballaigues, Switzerland) one, with an enhancement in the flexibility and cyclic fatigue resistance arising from a new heat-treatment: the FireWire™.
In the last years, the manufacturing of NiTi endodontic systems has become widespread, involving more countries and determining the emergence of new companies which begun an economic policy based on the emulation of well-known endodontic instruments with the addition of proper modification (i.e. heat-treatment).
Although there are different studies in the literature regarding the comparison of ETP and PTG in terms of flexibility, cyclic fatigue resistance and torsional resistance, there are no studies regarding the correlation between the mechanical properties and the metallurgical features, the transition temperatures, the composition of the alloy and the heat-treatment of ETP in comparison with those of PTG.16–20 Moreover, to date there are no studies that simultaneously evaluate both mechanical and metallurgical characteristics of the above-mentioned instruments, giving to readers a fragmented overview of the topic. As stated by Silva et al., a multimethod approach is suggested to minimize the phenomenon of compartmentalization of the knowledge, resulting in a limited understanding and in a gross oversimplification in knowledge application. 21
Therefore, this study aimed to explain the mechanical differences between ETP and PTG through the investigation of the differences between the two heat-treatments (FireWire™ and Gold) determining the transition temperatures and the composition of the alloy of ETP, topics never addressed before.
Materials and methods
The sample size for the mechanical tests was calculated using G*Power v3.1 (Heinrich Heine, University of Düsseldorf, Düsseldorf, Germany) setting a significance level of 5% and a power of 90%. 130 endodontic instruments were selected for the research, 65 F2 PTG (Group A) and 65 F2 ETP (Group B). Before submitting each instrument to the tests, a stereomicroscopic observation at 20x was performed (Carl Zeiss Microimaging, Göttingen, Germany) to evidence any manufacturing defects and none of them was discarded.
The instruments of each group were divided into four subgroups according to the selected test or analysis as follows: subgroup 1 (n = 20) for the cyclic fatigue test, subgroup 2 (n = 20) for the bending test, subgroup 3 (n = 20) for the static torsional test and subgroup 4 (n = 5) for the DSC analysis.
Cyclic fatigue test
All the instruments of the two brands were rotated according to the manufacturers

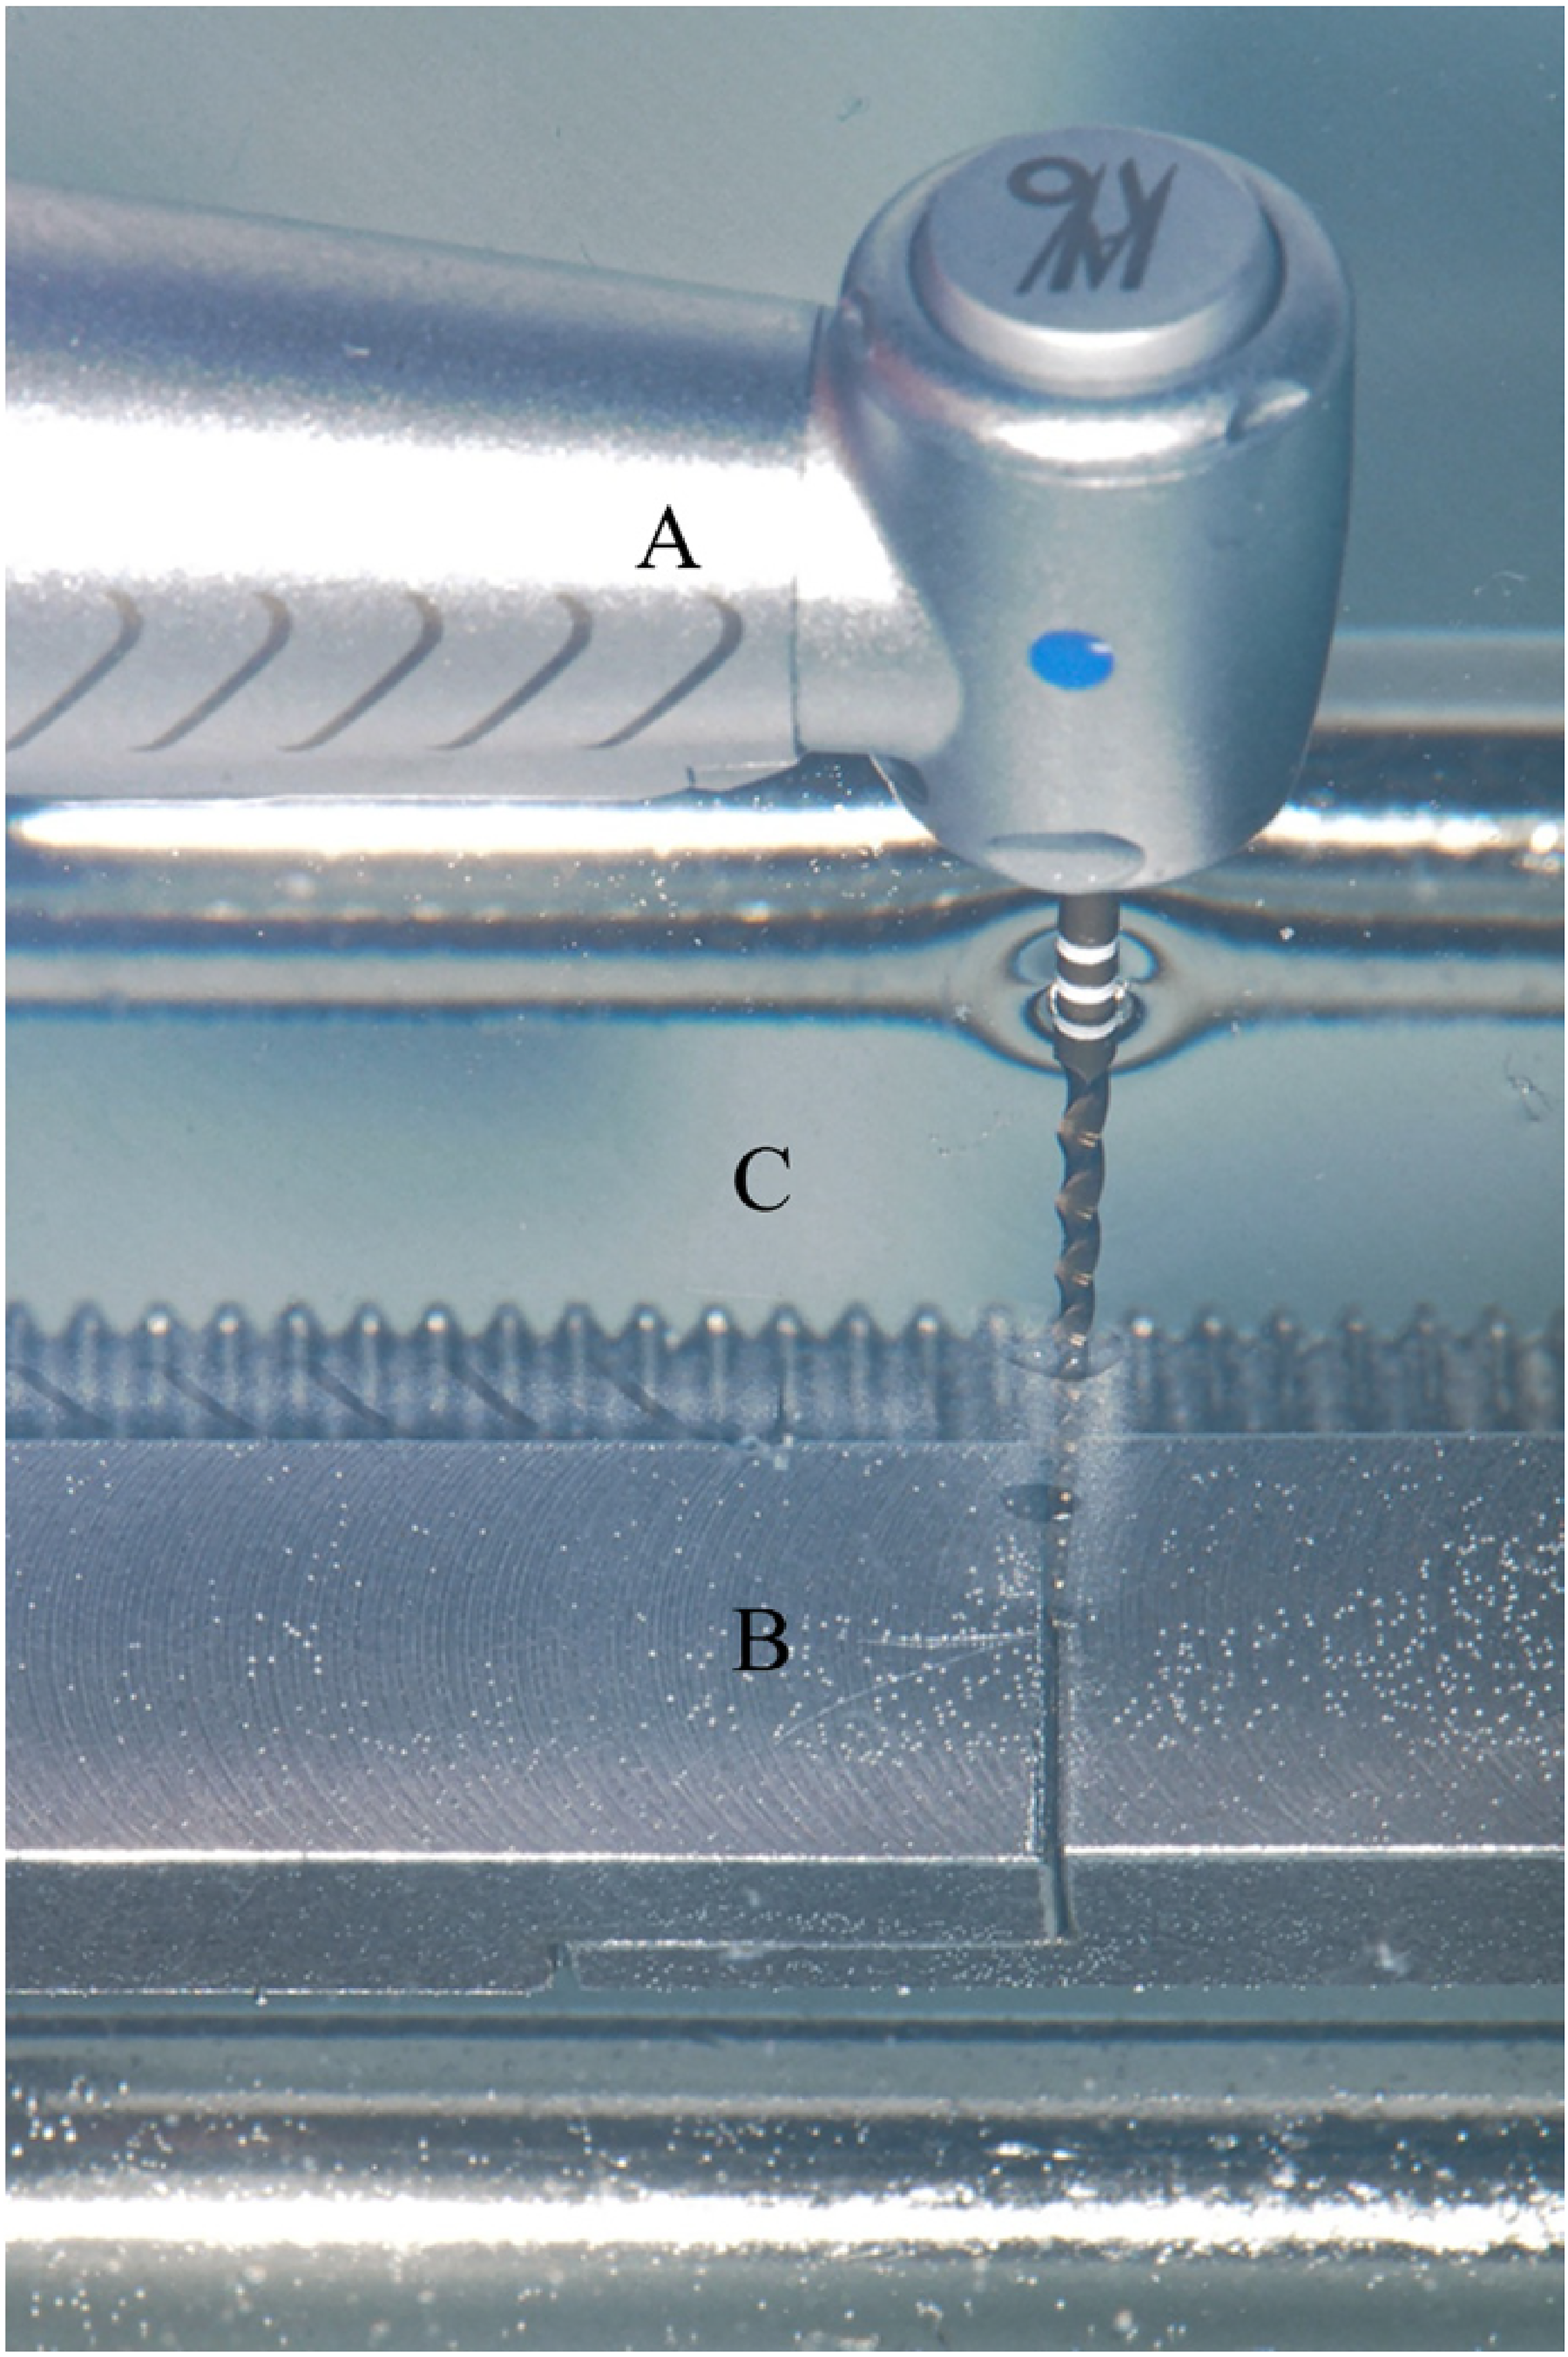
Tapered stainless-steel artificial canal: image of the used tapered stainless-steel artificial canals characterized by 60° angle of curvature and 5
Each instrument was freely rotated inside the artificial canal until the fracture had occurred and the time between the activation of the instrument and the fracture was registered using a digital chronometer with a sensitivity of 0.01 s. Then, to determine the number of cycles to fracture (NCF), the following formula was adopted: NCF = revolutions per minute (rpm) × time to fracture (sec)/60.
Moreover, the fractured tips of each instrument were collected and measured with a digital caliper with a sensitivity of 0.01 millimeters. The length of the fragments (FL) was statistically analyzed to evaluate the correct positioning of the instruments inside the artificial canal and to assess the quality of the cyclic fatigue test
The mean values and the standard deviations of each group were calculated and statistically analyzed using a one-way analysis of variance (ANOVA) test with significance set to a 95% confidence level. Parametric tests were adopted after performing a visual inspection of the distribution histograms, which confirmed the normal distribution of the analyzed data.
Bending test
The bending test was performed using a custom-made device consisting of: a main platform made of a stainless steel alloy with a mounted load cell linked to a digital display able to record the force generated during bending; a mobile device that allowed the repeatable position of the instrument on the load cell at different length from the tip; an analog protractor able to determine the angle at which the bending resistance is tested. 18
All instruments were tested by the same operator to avoid any procedural error. The bending test was performed at a 45° angle and 6
All measurements indicated by the load cell display were recorded, the mean values and the standard deviations were calculated and then, statistically analyzed using a one-way analysis of variance (ANOVA) test with significance set to a 95% confidence level. Parametric tests were adopted after performing a visual inspection of the distribution histograms, which confirmed the normal distribution of the analyzed data.
Static torsional test
All the selected instruments were of the same length (25
The static torsional test was performed by blocking each instrument at 5
To reproduce the intracanal temperature, the tested instrument and the vice were immersed inside a water bath of saline solution with a pre-set temperature of 35 °C ± 1 °C. The water temperature was controlled with a digital thermometer (Figure 2).
Torsional static testing device: The image of the torsional testing machine apparatus composed by: (a) 1:1 handpiece connected to a dedicated endodontic motor (Kavo, Biberach, Germany) allowing a real-time (0.1 s) recording of the torque with a sensitivity of 0.05 Ncm; (b) a vice to firmly secured the instrument tip at 5 mm; (c) water bath of saline solution with a pre-set temperature of 35 °C ± 1 °C.
Moreover, the fractured tips of each instrument were collected and measured with a digital caliper with a sensitivity of 0.01 millimeters. The length of the fragments (FL) was statistically analyzed to evaluate the correct blockage of the tip of the instrument imposed by the vice and to assess the quality of the static torsional test
The mean values and the standard deviations of each group were calculated and statistically analyzed using a one-way analysis of variance (ANOVA) test with significance set to a 95% confidence level. Parametric tests were adopted after performing a visual inspection of the distribution histograms, which confirmed the normal distribution of the analyzed data.
Differential scanning calorimetry (DSC)
The tests were carried out with a Perkin-Elmer DSC Pyris 8500 (PerkinElmer, Shelton, CT) equipped with a cooling module. Purified nitrogen was the used purge gas (30
The DSC measurements have been reported as mean values and standard deviations. The comparison between the values of samples was carried out using a one-way analysis of variance (ANOVA) with significance set to a 95% confidence level.
Scanning electron microscopy (SEM) and energy-dispersive X-ray analysis (EDX)
In order to assess the causes of fracture, the topographic features of the surface of the fractured instruments consequent to the cyclic fatigue and torsional tests were performed by observing five randomly selected fragments of Ni-Ti rotary instruments for each subgroup under a scanning electron microscopy (SEM) (FEI Quanta™ 400, FEI Company, Tokyo, Japan).
Moreover, during the SEM observations the chemical composition and the quality of the Ni-Ti alloy of the instruments of the two brands were determined by performing an energy-dispersive X-ray analysis (EDX) using the microanalysis system EDAX Genesis equipped with the SEM FEI Quanta 400. The chemical composition was assessed in the center of the fractured instrument to avoid any external contamination of the surface.
Results
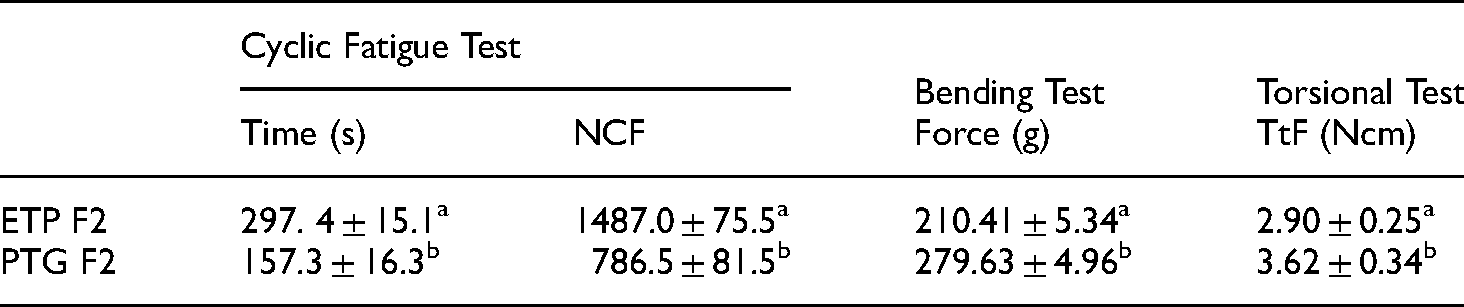
All results derived from the mechanical tests are shown below in the corresponding subparagraph and summarized in Table 1.
Schematic summary of the mechanical properties of ETP F2 and PTG F2 instruments resulting from cyclic fatigue, torsional and bending tests. Different superscript letters in the same column indicate statistical differences among groups (P < 0.05).
Cyclic fatigue test
The results of the cyclic fatigue tests are shown in Table 1, reporting mean values and standard deviation of time to fracture (s) and NCF. ETP F2 showed statistically significant higher values of NCF than PTG F2 (p < 0.05), with mean values and standard deviations respectively of 1487.0 ± 75.5 and 786.5 ± 81.5, showing the better resistance to cyclic fatigue of ETP F2 than PTG F2.
FL measurement showed a mean value and a standard deviation respectively of 5.98 ± 0.40 (mm) for ETP F2 and 6.10 ± 0.34 (mm) for PTG F2, with no statistically significant difference between each other (p > 0.05).
Bending test
The results of the bending tests are shown in Table 1, reporting mean values and standard deviation of the force (g) generated to bend the instruments at 45° at 6 mm from the tip. PTG F2 showed a higher value of applied force (g) than ETP F2 (p < 0.05), with mean values and standard deviations respectively of 279.63 ± 4.96 (g) and 210.41 ± 5.34 (g), showing the higher stiffness and the lower flexibility of PTG F2 compared to ETP F2.
Torsional test
The results of the static torsional tests are shown in Table 1, reporting mean values and standard deviation of the TtF (Ncm). PTG F2 showed a higher value of TtF (Ncm) than ETP F2 (p < 0.05), with mean values and standard deviations respectively of 3.62 ± 0.34 (Ncm) and 2.90 ± 0.25 (Ncm), showing better resistance to torsional stress of PTG F2 than ETP F2.
FL measurement showed a mean value and a standard deviation respectively of 5.75 ± 0.46 (mm) for ETP F2 and 6.05 ± 0.26 (mm) for PTG F2, with no statistically significant difference between each other (p > 0.05).
Differential scanning calorimetry (DSC)
The DSC heating and cooling curves of ETP and PTG obtained from the analysis in the aluminum pan were reported respectively in Figure 3.
On the heating curves a single endothermic peak was recorded for both samples. It represents the martensitic transformation. The peak of PTG sample was at a higher temperature, and the change in enthalpy (area of the peak) related to the transition was lower in comparison to ETP one.
A similar thermal behavior was observed in the cooling curves, where the exothermic peaks related to the reverse transformation of austenite to martensite, were at a higher temperature for PTG, if compared to ETP samples. In the case of ETP, another peak at temperatures under 0°C was recorded. As reported by Alapati et al. (2009) this may be interpreted in two ways: by the transformation from austenite to martensite at a higher temperature, followed by low-temperature twinning transformation within martensite, or by the transformation from austenite to R-phase in the peak at higher temperature and the transformation from R-phase to martensite at a lower temperature. 13
The Transformation temperatures, Onset (As, Ms) and End (Af, Mf), and the related change in enthalpy (ΔH) are summarized in Table 2. The data obtained for PTG F2 in the heating measurement significantly differed from those of ETP F2 samples with p < 0.05.
Phase transformation temperatures and associated energy of PTG F2 and ETP F2 instruments (mean ± SD, n = 3), tested in aluminum pans. Means sharing the same letter are not significantly different (p > 0.05).

Letters a-i indicate statistical analysis differences.
Scanning electron microscopy (SEM) and energy-dispersive X-ray analysis (EDX)
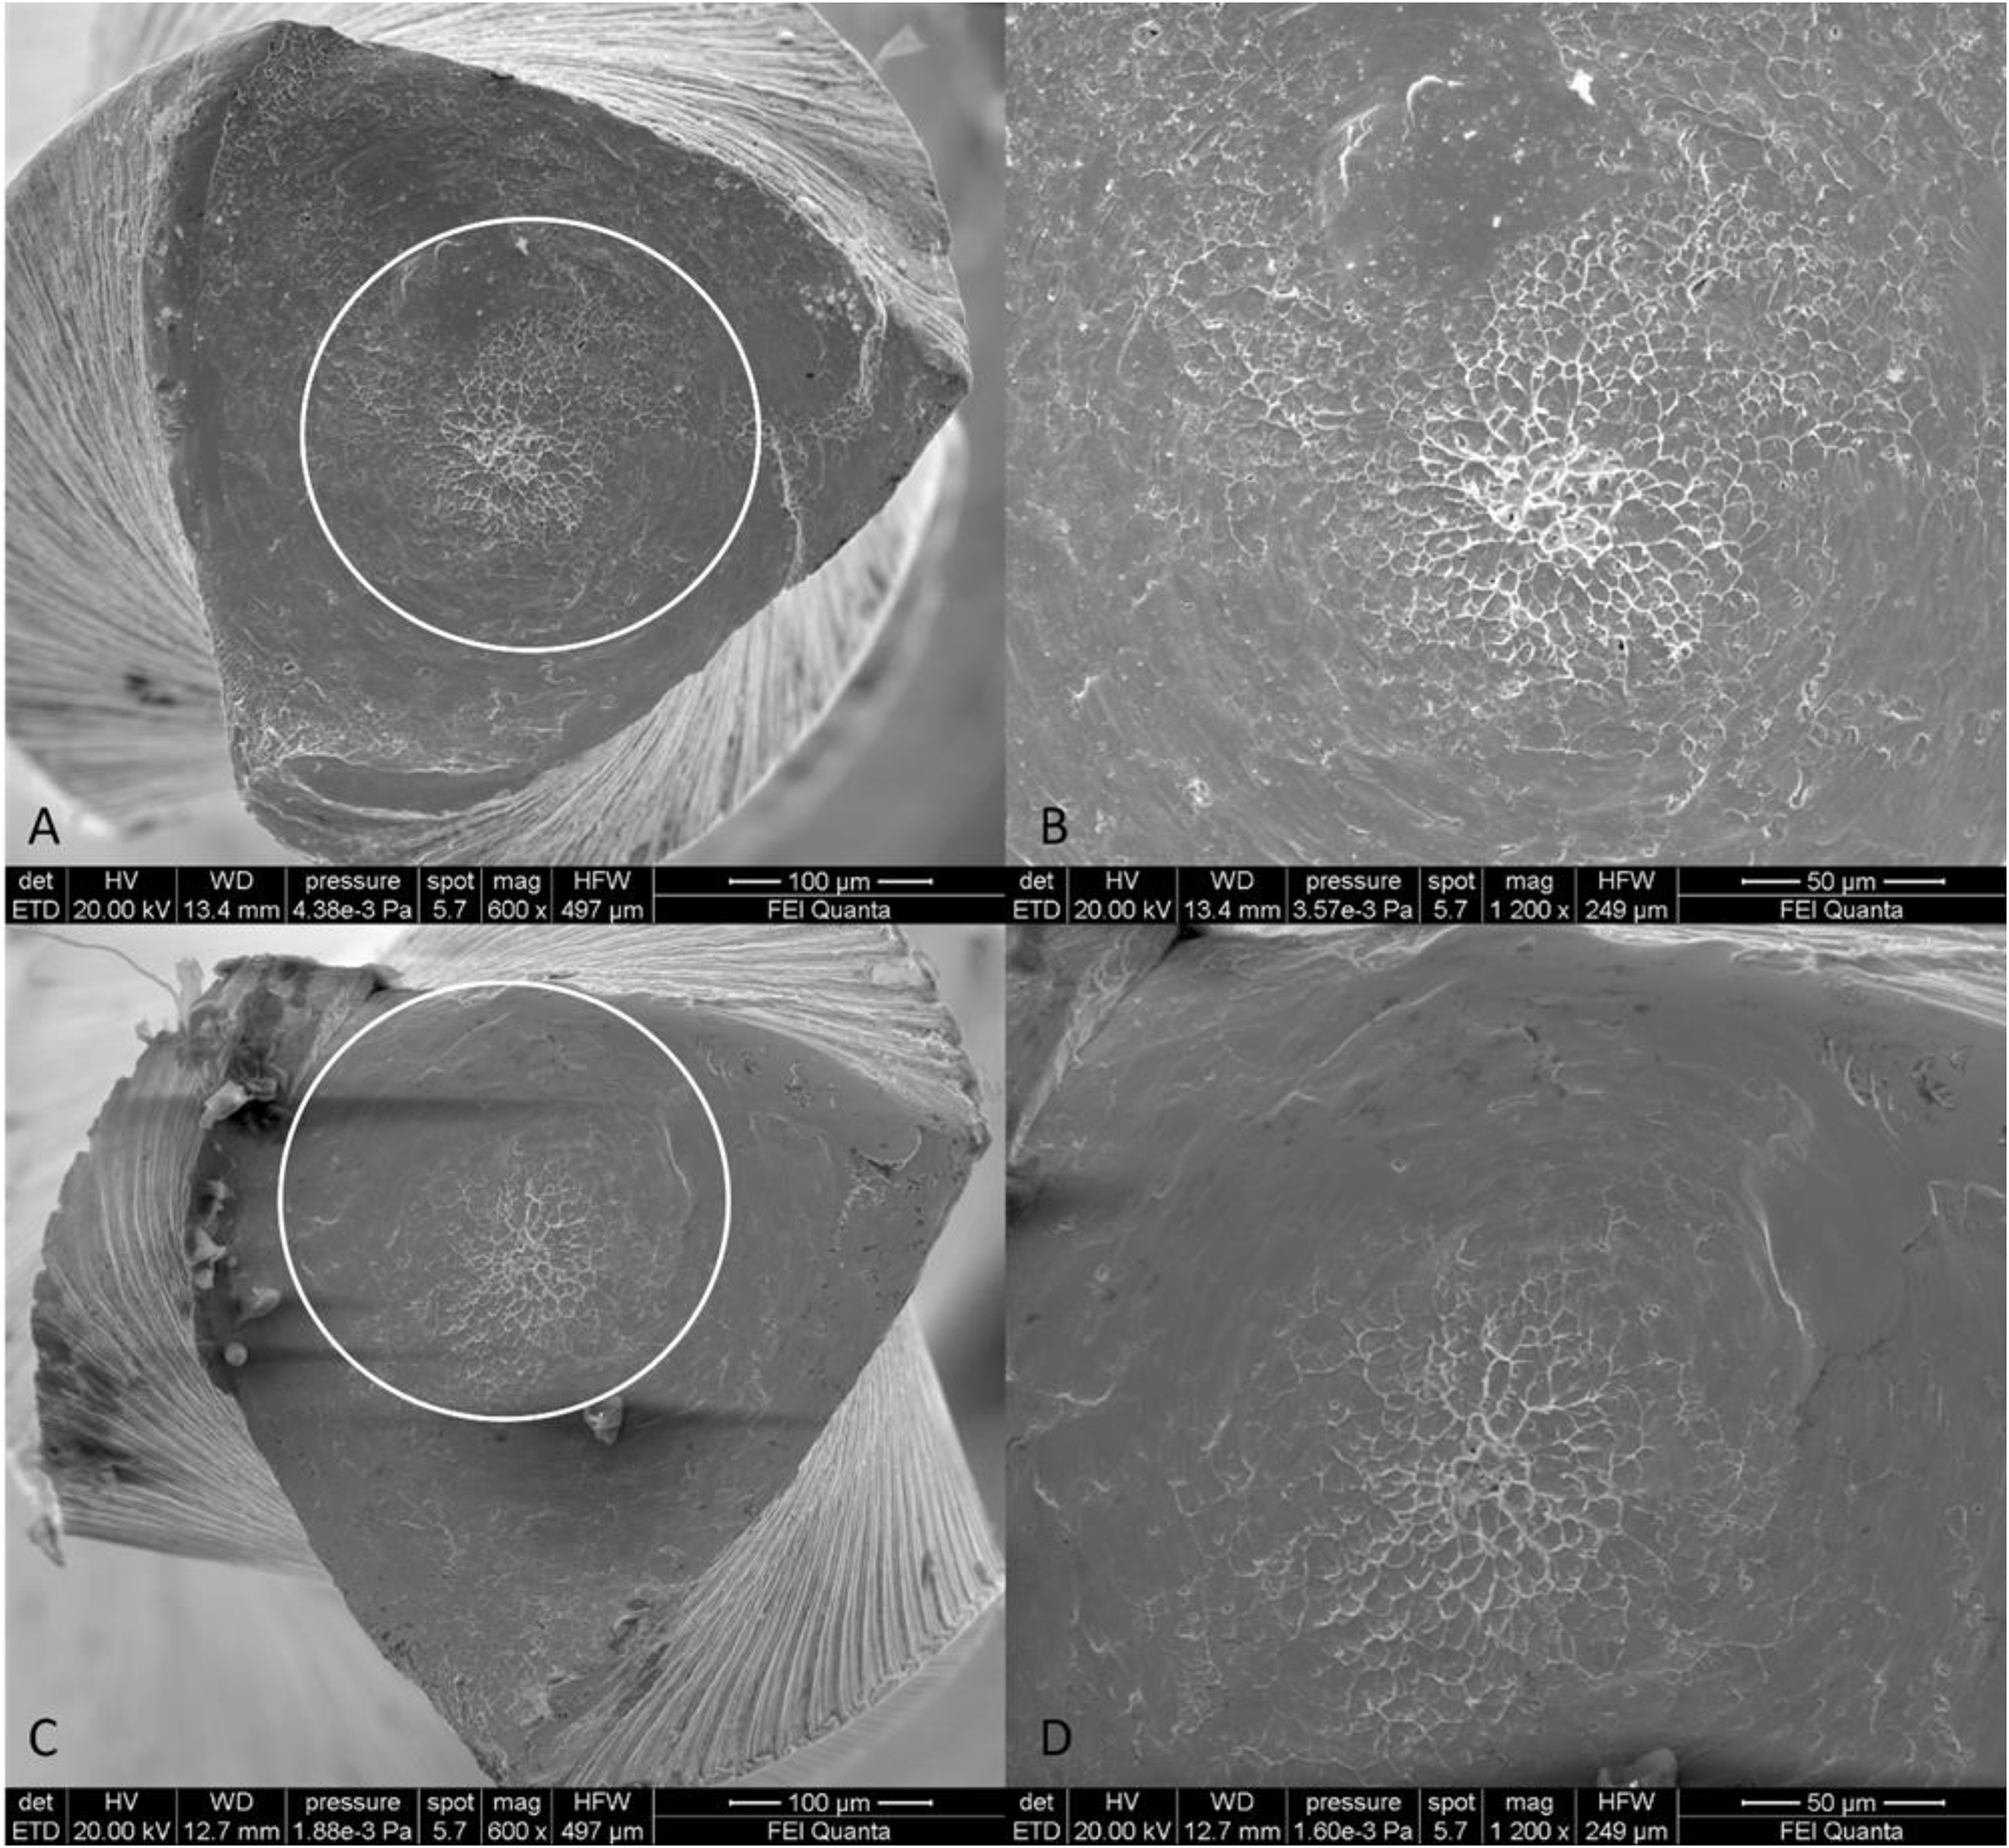
The fractographic analysis after SEM evaluation of the fractured Ni-Ti instruments showed the typical features of fracture arising from cyclic fatigue for subgroup 1 and arising from the excessive torsional load for subgroup 3.
Figure 4 shows the typical fractographic pattern due to cyclic fatigue, highlighting the crack initiation point in correspondence to the external surface of the fracture cross-sections, with an area of microscopic dimples.

DSC curves. DSC curve of ETP and PTG F2 instruments with a heating/cooling rate of 5°C. The DSC charts revealed different phase transformation temperatures among the two tested instruments. On the heating curves (top lines reading from right to left) a single endothermic peak was recorded for both instruments that represent the martensitic transformation. The peak of ETP sample was at lower temperature than PTG. A similar thermal behavior was observed in the cooling curves (bottom lines reading from left to right), where the exothermic peaks related to the reverse transformation of austenite to martensite, were at a higher temperature for PTG than ETP samples.
Figure 5 shows the typical fractographic pattern due to excessive torsional loads, highlighting the typical concentric abrasion marks on the periphery of the cross-section with a dimpled surface with micro-voids at the rotational center.

SEM images of cyclic fatigue failure. SEM images at different magnifications of fractured surface of two samples of ETP F2 (images A and B) and PTG F2 (images C and D) after cyclic fatigue tests. All acquisition specifications are shown in the black box below each image. For both instruments it is evident the typical fractographic pattern of cyclic fatigue failure is characterized by fatigue striations and by numerous dimples spread across the whole surface, evidenced in the images at higher magnification (images B and D). Images B and D are the respective particulars of images A and C at higher magnification in correspondence to the white squares.
The EXD analysis performed with EDAX Genesis system clearly confirms the near-equiatomic composition of Ni-Ti alloy of both instruments (ETP and PTG).
As shown in Figure 6, the ETP F2 sample is composed by 47.80% of Ti, 51.95% of Ni and a third component present in a lower percentage <1% (0.25%). Since its very small quantity, the microanalysis system was not able to identify with absolute precision the type of the material, however, the EDAX Genesis system recognized it as Rubidium (Rb).
SEM images of torsional failure. SEM images at different magnification of fractured surface of two samples of ETP F2 (images A and B) and PTG F2 (images C and D) after static torsional tests. All acquisition specifications are shown in the black box below each image. For both instruments it is clearly evident the typical fractographic pattern of torsional failure characterized by concentric circular abrasion marks and fibrous dimples near the center of rotation, evidenced in the images at higher magnification (images B and D). Images B and D are the respective particular of the images A and C at higher magnification in correspondence of the white circumferential lines.
As shown in Figure 7, the PTG F2 sample is composed of 48.52% of Ti and 51.48% of Ni, without any detectable inclusion of other materials other than Nickel and Titanium.

ETP EDAX analysis. EDAX quantification of the composition of Ni-Ti alloy of ETP F2, showing the graphical distribution of the components (summarized in the below table). As it can be observed the EDAX microanalysis system detected a third component other than Ni (51.95%) and Ti (47.80%) in a percentage of 0.25%, that recognized as Rubidium (Rb).

PTG EDAX analysis. EDAX quantification of the composition of Ni-Ti alloy of PTG F2, showing the graphical distribution of the components (summarized in the below table). Contrarily to EDX analysis of ETP, PTG instruments are composed only by Ni (51.48%) and Ti (48.52%), without any other material.
Discussion
The knowledge of the mechanical properties, the composition and the manufacturing processes such as heat-treatment, is fundamental for properly choosing the correct instruments during root canal treatments. 19 Despite the information present in the current literature regarding torsional and cyclic fatigue resistance and flexibility of ETP and PTG, little research has been conducted regarding the determination of the TTR and the composition of the alloy of PTG, and none on ETP.16–18,21–23
For this reason, this study aimed to determine and compare the TTR and the alloy composition of ETP and PTG, analyzing the different mechanical behavior in terms of torsional and cyclic fatigue resistance through the evaluation of the two Ni-Ti alloy and heat-treatment processes of which the two instruments are characterized.
For this purpose, the ETP F2 and the PTG F2 instruments were selected for the research. The manufacturer has introduced ETP system as a replica-like system of PTG with a different heat treatment which guarantees enhanced flexibility and cyclic fatigue resistance, despite the similar morphological characteristics. However, Alcade et al. compared the morphological characteristics of ETP and PTG through a Micro-CT analysis, finding that the first one has the metal mass volume (mm
For the cyclic fatigue and torsional resistance evaluation, the static tests were performed according to the ISO standardization, except for the setting of the rotational speed during the torsional tests. However, as previously demonstrated, the rotational speed does not affect the torsional resistance of Ni-Ti endodontic rotary instruments. 24 As stated by Schäfer et al., the establishment of official specifications has unfortunately not kept pace with rapid developments in endodontics. 25 All ISO specifications were stipulated for the evaluation of the stainless-steel manual file, not considering the different mechanical and metallurgical behavior of NiTi instruments. In other words, to date, the specifications do not take into account relevant clinical properties of newer NiTi rotary instruments and do not adequately reflect the use of the instruments under clinical conditions. 25 For example, the above-mentioned specification does not consider the temperature at which the tests should be performed, considering that, as thoroughly demonstrated in the literature, it is well known that temperature has a marked impact on mechanical tests of NiTi instruments25–27 The choice to perform the tests at the clinical temperature (35 ° ± 1 °C), when the testing conditions allow it, was made to obtain more reliable results. It has been demonstrated that the temperature deeply influences the mechanical behavior of Ni-Ti instruments, since the alloy is susceptible to temperature variation according to its crystallographic organization. So, performing a test at intracanal temperature guarantees a better clinical correspondence of the obtained data. 28
According to the results arising from mechanical tests, it can be stated that the ETP F2 instruments are characterized by greater flexibility and by an increased cyclic fatigue resistance, approximately two-fold higher, than PTG F2 instruments. On the contrary, they show a lower torsional resistance in comparison to the PTG.
The obtained data are consistent with previously published studies. Regarding the cyclic fatigue, Jamleh et al. (2019) observed that the cyclic fatigue resistance of ETP F2 and PTG F2 instruments at simulated body temperature was respectively 1506.0 ± 482.0 (NCF) and 1002.3 ± 304.8 (NCF) with a statistically significant difference. 16 Despite the mean values of the above-mentioned study being slightly higher than those reported in this research, the results are however consistent since the standard deviations of the published study were much higher than those reported in this research. Also, Alcalde et al. (2020) reported similar results, respectively of 1453 ± 61 (NCF) for ETP F2 and 732 ± 42 for PTG F2. 17 Moreover, the two above-mentioned pieces of research also obtained comparable results regarding the torsional resistance of ETP F2 and PTG F2.16,17
Regarding the bending ability of ETP and PTG, the obtained results are consistent with another research that used the same custom-made device and methodology. In that study, the authors found generated forces of 205.67 ± 4.55 (g) for ETP F2 and 281.67 ± 5.39 (g) for PTG F2, when the flexibility test was performed at a 45° angle and 6
As mentioned before, in the scientific literature there are no studies regarding the TTR and the qualitative analysis of the ETP alloy, for this reason, to date, it is not possible to compare the obtained data. However, a comparison of the TTR and the alloy composition of PTG instruments shown in this research can be performed. Hieawy et al. (2015) reported an Af temperature of PTG instruments of 50.1°C ± 1.7 (°C) comparable to that obtained in this research (49.99 ± 3.31 (°C)), whilst, regarding the EDX analysis, Silva et al. (2020) reported an atomic percentage of 51.00% of Ni and of 49% of Ti, absolutely consistent with the results of this research.21,22
Observing the DSC data, it can be stated that, surprisingly, the austenitic TTR (As and Af) of PTG is at a higher temperature than the ETP one, showing a more martensitic behavior of PTG than ETP. The latter showed an Af of 38.92 ± 1.75 (°C), whilst the Af of PTG was 49.99 ± 3.31 (°C). This result does not properly reflect the mechanical behavior of the above-mentioned instruments. As highlighted before, ETP F2 showed an increased cyclic fatigue resistance and greater flexibility than PTG, all characteristics belonging to a more martensitic instrument. The rationale behind these unexpected results could be found in observing the enthalpy results of the DSC analysis. The change in enthalpy is equivalent to the total amount of energy needed for the Ni-Ti alloy to complete the crystallographic transformation, and, in this case, in the heating transformation, the enthalpy change of ETP was 13.42 ± 2.66 (J/g), while for the PTG was 2.74 ± 0.41 (J/g). In particular, the Area and ΔH values (Table 2) calculated for ETP in the heating thermogram were 5-fold higher than PTG. This suggested that in ETP samples there was more unstable martensite that passed to austenite form than in PTG samples, which contained a higher amount of work-hardened and more stable martensite. The low values of ΔH indicated the presence of stable martensite as reported by Brantley et al. (2002) and Generali et al. (2020).12,14 The presence of substantial amounts of R-phase in ETP was confirmed by the sharper transformation peak in the heating curve compared to PTG. The intervals between Austenite start and finish temperatures were different for ETP and PTG instruments. In the heating curve, ETP transformation started and finished at lower temperatures, near the body temperature, than PTG. As reported by Generali et al., it can be assumed that ETP possesses a higher physical activity probably due to the ability to form higher amounts of R-phase and lower amounts of martensite. 14 As reported by several Authors a remarkable difference in enthalpy change is probably due to differences in the starting wire blanks, designs of the machined instruments and perhaps processing procedures for the two batches of each instrument product.12,13 Those hypotheses and in particular that regarding the differences in the starting wire blanks and the manufacturing procedures could be confirmed by analyzing the chemical composition of the alloy. The EDX analysis of the ETP showed a third component other than Ni and Ti.
The purpose of this research was to evaluate the mechanical performance of ETP and PTG, considering their different heat-treatment and manufacturing processes and their different Ni-Ti alloy composition. Despite this, their mechanical behavior has been investigated through static tests, that, as stated by Silva et al., only partially represent the clinical scenario. It was also pointed out that this type of research does not resemble the reality, however, it is important to highlight that torsional and cyclic fatigue resistance tests allow the variables to be isolated and tested individually, increasing the validity and reproducibility of the study. 22 According to this, the main limitations of this research are fundamentally related to no dynamic evaluation of the two tested instruments, not considering important clinical characteristics such as shaping ability, cutting efficiency, dynamic cyclic fatigue resistance and dynamic torque-generated evaluation. Nevertheless, the pure purpose of this research was not to make a comparison between two instrumentation systematics but to investigate the relationship between their basic mechanical properties and their metallurgical characteristics. According to this, further research is needed to guarantee a global evaluation of these two instrumentation systematics.
Conclusions
Within the limitation of this study, the following conclusion could be done:
ETP instruments show an increased cyclic fatigue resistance (approximately 200%) and flexibility than PTG, thus, in case of complex tooth anatomy that requires an increased flexural behavior, such as abrupt or severe curvature, ETP should be preferred to PTG. PTG instruments show an increased torsional resistance than ETP, thus, in the case of narrow or calcified canals, PTG should be preferred to ETP. The EDX analysis of the ETP showed a third component other than Ni and Ti, that the EDAX microanalysis system recognized as Rb, despite it being detected in a percentage < 1%. ETP, although shows increased flexural and cyclic fatigue behavior, is characterized by lower austenitic TTR than PTG (ETP is less martensitic than PTG) but shows a higher enthalpy change to complete the transformation from martensite to austenite. Thus, the crystallographic phase of Ni-Ti instruments should not be generally considered as the only parameter to evaluate the cyclic fatigue resistance or the flexibility of Ni-Ti rotary instruments, but also the manufacturing processes should be taken into account, such as the composition of the blank alloy, its processing and the heat-treatments.
Footnotes
Acknowledgment
We thank Dr Tania Ruspandini and the Laboratory of Electron Microscopy and Microanalysis of the Department of Earth Sciences, Sapienza University of Rome, for the SEM and EDX analysis, performed with FEI QUANTA 400 Scanning Microscope with EDAX GENESIS Microanalysis System.
Author contributions
Conceptualization, A.Z. and P.R..; methodology, P.D.M. and A.Z.; software, R.R.; validation, L.T. and P.R.; formal analysis, G.G..; investigation, A.Z. and P.D.M.; resources, D.D.N. and R.R.; data curation, D.D.N. and A.Z.; writing—original draft preparation, A.Z. and P.D.M.; writing—review and editing, G.G.; visualization, L.T.; supervision, L.T. and P.R..; project administration, G.G.
Declaration of conflicting interests
The author(s) declared no potential conflicts of interest with respect to the research, authorship, and/or publication of this article.
Funding
The author(s) received no financial support for the research, authorship, and/or publication of this article.