
Abstract
Immune cells have emerged as key regulators in the occurrence and development of multiple tumor types. However, it is unclear whether immune-related genes (IRGs) and the tumor immune microenvironment can predict prognosis for patients with gastric cancer (GC). The mRNA expression data in GC tissues (n = 368) were obtained from The Cancer Genome Atlas (TCGA) database. Differentially expressed IRGs in patients with GC were determined using a computational difference algorithm. A prognostic signature was constructed using COX regression and random survival forest (RSF) analyses. In addition, datasets related to “gemcitabine resistance” and “trastuzumab resistance” (GSE58118 and GSE77346) were obtained for GEO database, and DEGs associated with drug-resistance were screened. Then, we analyzed correlations between gene expression and cancer immune infiltrates via Tumor Immune Estimation Resource (TIMER) site. The cBioportal database was used to analyze drug-resistant gene mutation status and survival. One hundred and fifty-five differentially expressed IRGs were screened between GC and normal tissues, and a prognostic signature consisting of four IRGs (NRP1, PPP3R1, IL17RA, and FGF16) was closely related to the overall survival (OS). According to cutoff value of risk score, patients were divided into high-risk and low-risk group. Patients in the high-risk group had shorter OS compared to the low-risk group in both the training (p < 0.0001) and testing sets (p = 0.0021). In addition, we developed a 5-IRGs (LGR6, DKK1, TNFRSF1B, NRP1, and CXCR4) signature which may participate in drug resistance processes in GC. Survival analysis showed that patients with drug-resistant gene mutations had shorter OS (p = 0.0459) and DFS (p < 0.001). We constructed four survival-related IRGs and five IRGs related to drug resistance which may contribute to predict the prognosis of GC.
Introduction
Gastric cancer (GC) is one of the most common cancers in the world and has a high mortality rate. The incidence and mortality of males in undeveloped countries are higher than that in developed countries. 1 Although major progress has been made in GC in recent years, surgery is the only radical cure. Recurrence and metastasis continue to be the barriers to the effective treatment of GC. 2 Most GCs are diagnosed at an advanced stage and are becoming metastatic at distant sites. Neoadjuvant chemotherapy followed by radical surgery represents a treatment option for patients with advanced disease. However, most patients with advanced disease have lost the opportunity for surgery, resulting in shorter survival time and poor prognosis.3–5 Chemotherapy and molecular targeted drugs are important treatments for advanced and metastatic gastric cancer. Almost all patients have progressed after a period of treatment due to the patient’s intolerance and acquired drug resistance. Immune checkpoint inhibitors are currently emerging as a new potential option in GC treatment.6,7 Hence, there is an urgent need to find biomarkers which can predict the prognosis and immunotherapy efficacy of GC patients.
Many studies have proposed that gene expression-based signature can used to survival stratification in GC. However, due to the lack of sufficient validation cohorts, none has been incorporated into routine clinical practice. With the availability of large-scale gene expression data sets, many novel biomarkers have emerged. 8 The establishment of multigene-expression signatures make it possible to identify reliable biomarkers for GC. Emerging evidence has shown that immunity plays an important role in tumor development. 9 Recently, many types of research predicted multiple cancer prognosis by constructing prognostic immune signatures. Previous studies have screened out some prognostic IRGs for GC. For example, Liu et al. constructed a 14 OS-related IRGP signature based on the GEO database to predict the prognosis of gastric cancer patients. 10 Zhao et al. 11 used Lasso regression analysis to screen out 14 IRG pairs, which can effectively distinguish the survival risk of GC. In addition, Yang et al. 12 predicted cervical cancer survival and response to immune checkpoint inhibitor (ICI) by constructing an 11-IRG prognostic signature. Moreover, a nomogram based on IRGs was used for preoperative evaluation of triple-negative axillary lymph node metastasis in breast cancer. 13 Considering GC are significantly associated with infectious agents such as Helicobacter pylori and Epstein-Barr virus (EBV), the molecular characteristics of immune interaction should be extensively studied.
In the current study, we aimed to explore IRGs associated with prognosis of GC that could be used for prognostic stratification and therapeutic efficiency. We systematically analyzed the expression profiles of large-scale IRGs to screen and identify molecular markers. Our study could offer a novel insight into immune-related mechanisms of response and act as a promising approach for the clinical management of patients with GC.
Material and methods
Screening for differentially expressed IRGs
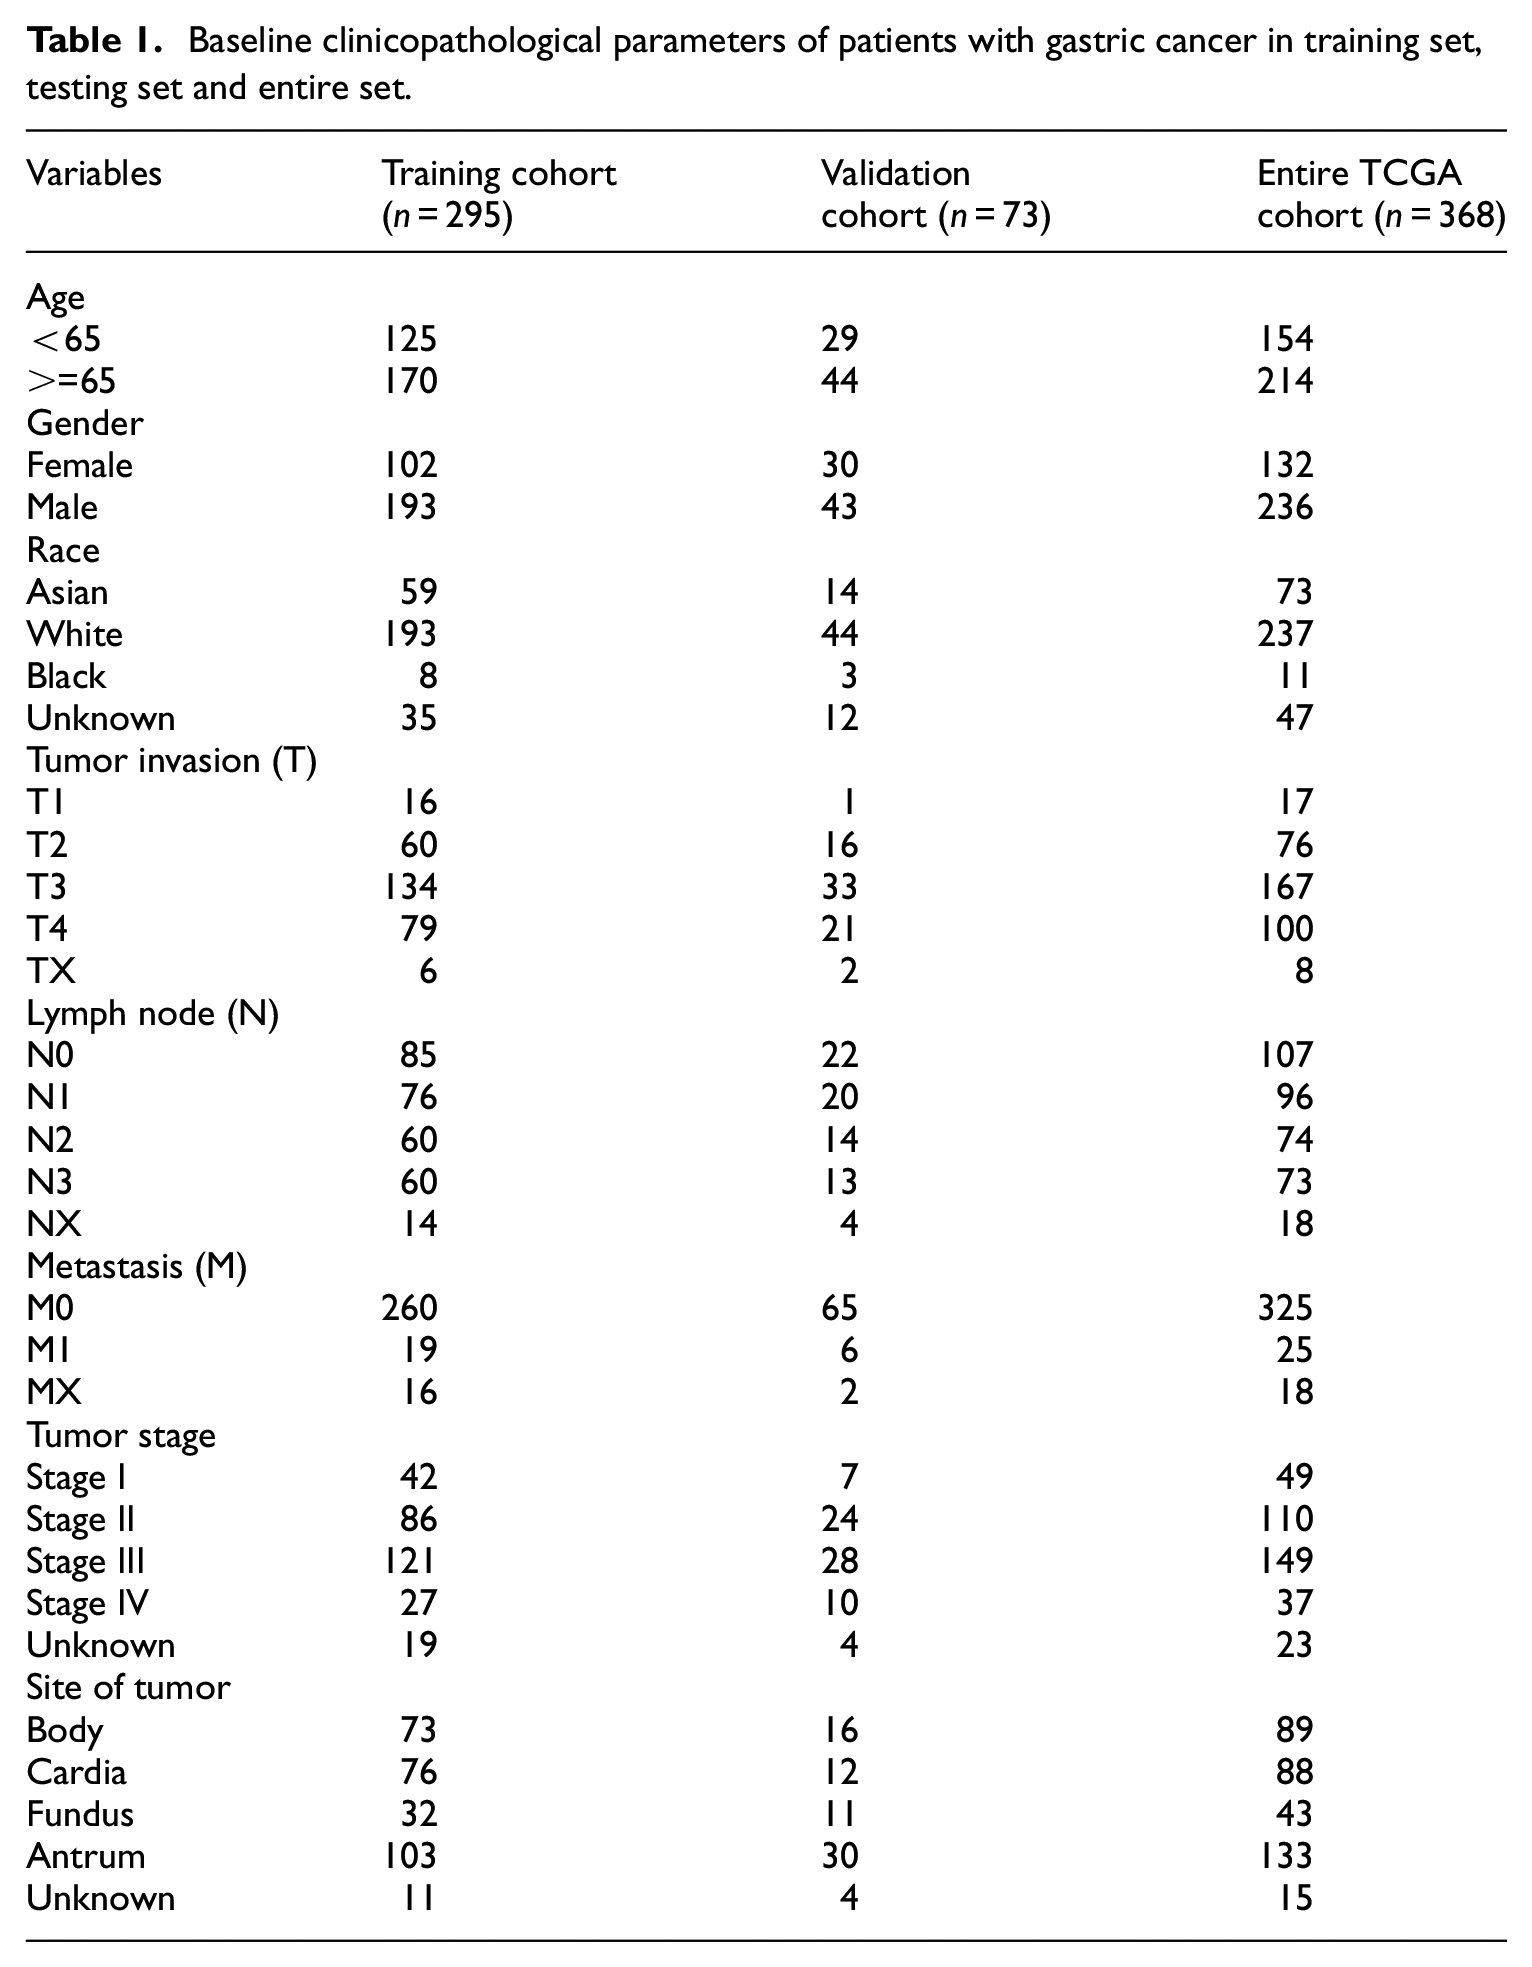
RNA-sequencing data (level 3) and corresponding clinical information of 368 patients with gastric cancer were downloaded from the TCGA data portal (https://cancergenome.nih.gov/). The baseline information of included patients in TCGA database was shown in Table 1. 2498 immune genes were obtained from the IMMPORT database (https://www.immport.org/home). 14 IMMPORT contains a list of human IRGs reported in the literature. To selected IRGs involved in the onset of gastric cancer. The limma package based on R software was used to analyze the differential expressed IRGs of tumor samples and normal samples. p-value <0.05 and a log2 |fold change (FC)| > 2 were considered as the thresholds. Then differentially expressed genes were extracted from all IRGs for subsequent analysis.
Baseline clinicopathological parameters of patients with gastric cancer in training set, testing set and entire set.
Enrichment analysis of DE-IRGs
Gene Ontology (GO) enrichment analysis including biological process (BP), cell components (CC) and molecular functions (MF) were used to analyze gene functions of differentially expressed IRGs, which were performed using the R software with “ClusterProfiler” package. 15 The same tool is also used for the enrichment analysis of Kyoto Encyclopedia of Genes and Genomes (KEGG) enrichment analysis. False discovery rate (FDR) <0.05 were considered significantly enriched and results were visualized using the “ggplot2” package.
Construction of the prognostic related model
Patients in the TCGA-STAD were randomly separated into a training set and a testing set in a 4:1 ratio. Then, we screened IRGs, in the TCGA-STAD using univariate Cox proportional hazards regression model, gene at p-value <0.05; Hazard ratio >1.3 and <0.7 were included for subsequent analysis. To optimize our prediction model, we carried out the random survival forests variable hunting (RSFVH) algorithm using the R “randomForestSRC” package. 16 The training samples were randomly selected to build the tree by taking bootstrap samples, and a total of 1000 classification trees were constructed. Then, in the process of tree construction, some prediction variables (mtry) were randomly selected as candidate variables to classify the node and were classified according to the survival criteria containing survival time and truncation information. Exponential sequencing or frequency of gene occurrence was used to screen genes in variables entering the model. Every decision tree in the random survival forest is a binary survival tree. Then, continuous variables were dichotomized for overall survival before the log-rank test by using best cutoff values determined by the “surv_cutpoint” function of the “survminer” R package. The log-rank test was applied to analyzing and comparing the Kaplan-Meier survival curves of patients’ overall survival. ROC curve. Riskplot analysis was used to study the accuracy of the model prediction. The AUC values were calculated according to ROC curves. The p-value <0.05 was considered significant. 17 In order to identify the predictive ability of our model in which part of the patients, we conducted a subgroup survival analysis based on the patient’s age, gender, race, and TNM staging.
The relationship between risk score to clinicopathologic features and immune infiltration
The “Beeswarm” package was used to verify the relationship between the risk score and the patients’ clinical features (gender, grade, stage, T stage, and N stage). The TIMER database (https://cistrome.shinyapps.io/timer/) is the use of RNA-Seq expression spectrum data detection of immune cells infiltration in tumor tissue. In this study, the TIMER database immune cell file was read, and the correlation coefficient test was used to explore the relationship between immune score and immune cell infiltration. p<0.05 was considered statistically significant.
Resistance gene analysis
GSE58118 (Expression data of gemcitabine resistance in gastric cancer) and GSE77346 (Expression data of trastuzumab resistance in gastric cancer) data sets were selected to screen genes related to gastric cancer drug resistance. The differential gene screening conditions were: |logFC| ≥ 1, p < 0.05. Then, we overlapping differentially expressed genes in GEO dataset with prognostic genes in the TCGA database. We further use the TIMER database to explore the relationship between gene mutation and immune cell infiltration. cBioportal database was used to explore the mutations status of these genes (TCGA, Provisional for the data set), and the relationship between the mutations and patient’s overall survival and disease/progression free survival.
Statistical analysis
R software 3.6.1 was used for all statistical analyses. Survival curves were generated by the Kaplan-Meier method and compared by log-rank test. All statistical tests were bilateral with p < 0.05 being statistically significant.
Results
Differentially expressed IRGs and functions
A total of 155 differentially expressed IRGs were screened, including 86 up-regulated genes and 69 down-regulated genes (Figure 1), which enriched in multiple biological processes and signaling pathways associated with cancer (Figure 2(a) and (b)). GO analysis shows that these IRGs can be enriched in several basic biological processes (BP). For instance, humoral immune response, leukocyte migration, phagocytosis, acute inflammatory response. KEGG analysis showed that the IRGs were mainly related to Cytokine-cytokine receptor interaction and IL-17 signaling pathway.

Differentially expressed immune-related genes: (a) volcano plot of differentially expressed immune-related genes (IRGs) and (b) heatmap of differentially expressed immune-related genes (IRGs).
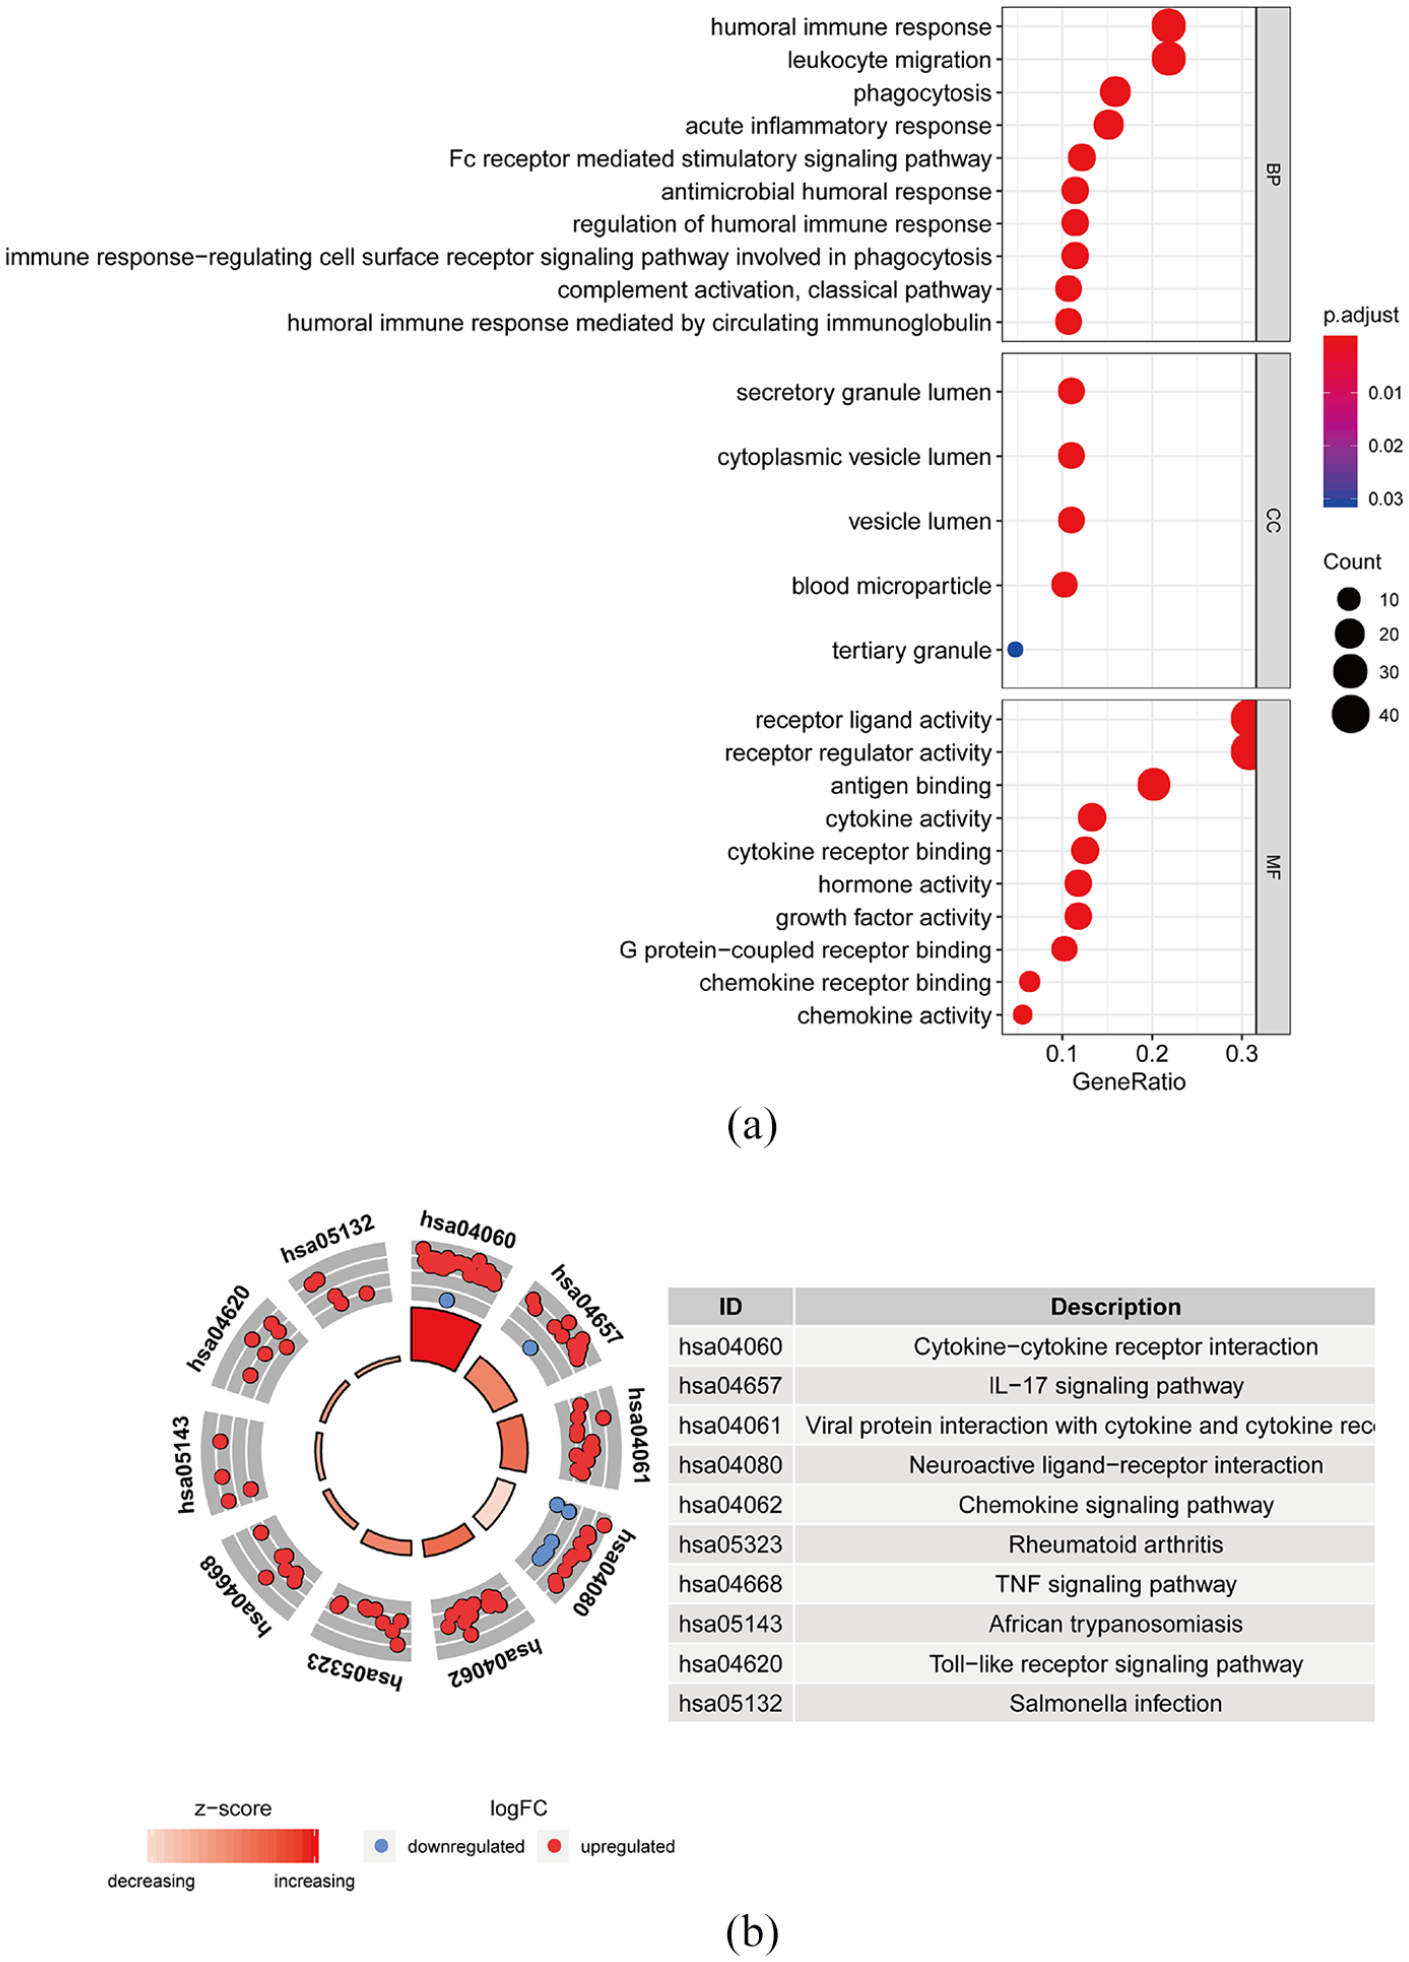
Gene functional enrichment of differentially expressed immune-related genes: (a) gene ontology analysis of biological process, cellular component and molecular function and (b) Kyoto encyclopedia of genes and genomes analysis.
The four-IRGs signature-based prognosis model improve GC survival prediction
Firstly, the prognostic value of IRGs expression was assessed using a univariate COX analysis. Sixty IRGs closely correlated with OS in GC (p < 0.05), and top 20 most significant IRGs were displayed in Table 2. For obtaining an optimization model, further screening was performed for 60 IRGs using the random survival forest (RSF) algorithm. As a result, four IRGs (NRP1 (Neuropilin1), PPP3R1(protein Phosphatase 3 Regulatory Subunit B, Alpha), IL17RA (interleukin 17 receptor A), FGF16 (fibroblast growth factor 16)) were identified as independent predictors (Figure 3(a)). Subsequently, according to best cutoff value, patients were divided into high-risk group (n = 97) and low-risk group (n = 198), and Kaplan-Meier curves illustrating high risk-score of four IRGs were correlated with significantly worse prognosis in patients with GC (p < 0.05). The median survival time for the high-risk group was 0.77 years, and 6.02 years for the low-risk group (Figure 3(b)). The four-IRGs signature reached an AUC value of 0.969 at 1 year, 0.940 at 2 years and 0.933 at 5 years (Figure 3(c)). Moreover, the distribution of the prognostic index, survival status in different groups and heatmap of the expression profile of the four IRGs are demonstrated in Figure 3(d).
Top 20 genes related with gastric cancer patients’ survival by univariate analysis.


Selection of feature IRGs by RSF-VH algorithm: (a) Function tree’s error rate. There were 1000 trees (Ntree), (b) the Kaplan–Meier survival analysis of highrisk and low-risk, (c) the ROC curve in the training set and (d) how four-IRGs risk score is distributed, survival status of patients and IRGs expression signature.
Our four-IRGs signature was further validated on the testing dataset. Each patient in the testing dataset was marked as high-or low-risk based on best cutoff value of four-IRGs expression. Kaplan-Meier survival curves exhibited the low-risk group had a better survival time. The median survival time in the high-risk group was 2.10 years. In the low-risk group, the median survival was 6.02 years (Figure 4(a)). In the testing dataset, the 1-year, 3-year, and 5-year AUC values were 0.824, 0.654, and 0.542, respectively (Figure 4(b)). Risk scores, survival time and expressions of four IRGs in the testing dataset are demonstrated in Figure 4(c).
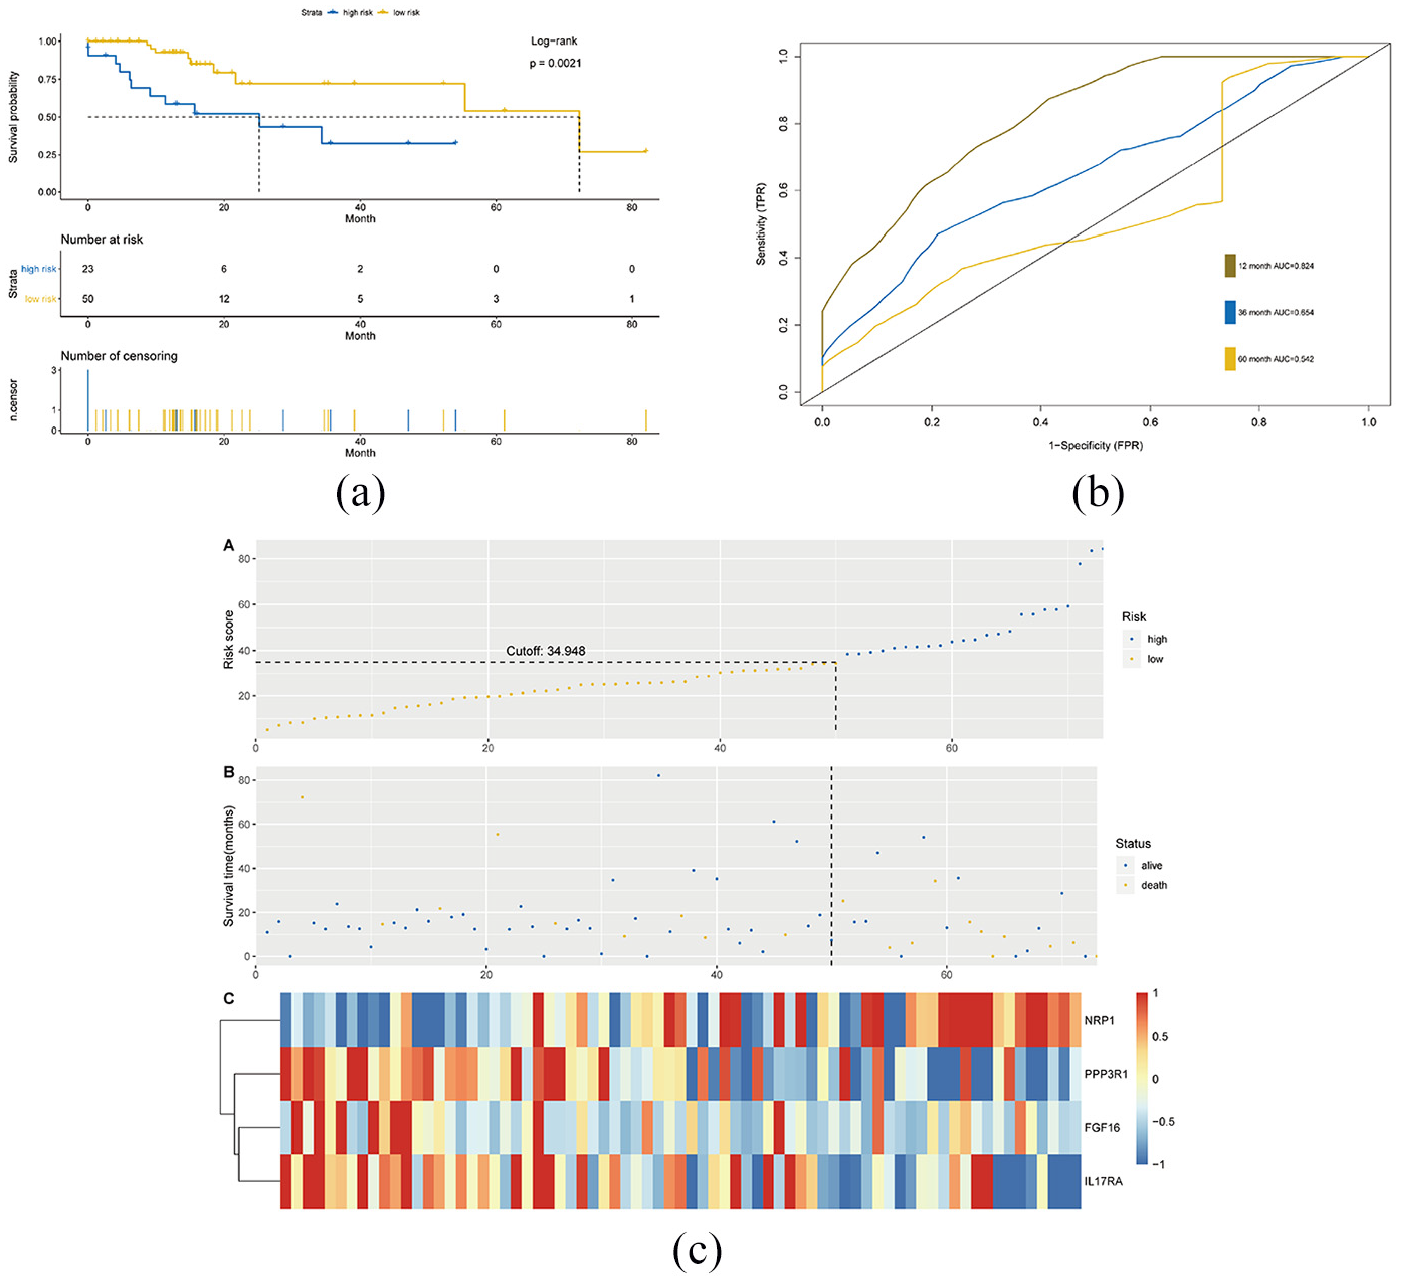
IRGs risk score analysis on TCGA in the testing data set: (a) the Kaplan–Meier survival analysis with log-rank test in the testing data set, (b) the ROC curve in the testing set and (c) the distribution of four-IRGs risk score, survival status of patients, and IRGs expression signature.
Four-IRGs signature is the independent risk factor for shorter OS in GC
The relationship between four-IRGs risk scores and clinicopathological factors (age, gender, grade, pathological stage and tumor, node, metastasis (TNM) stage) were analyzed using univariate and multivariate Cox regression analyses. Results found that four-IRGs, risk scores, age, race and tumor invasion depth, lymph node metastasis and distance metastasis were correlated with prognosis of GC (Figure 5(a)), and a four-IRGs signature, age and tumor invasion depth were the independent factors for OS (Figure 5(b)). Validations were conducted in subgroups of patients with different age, gender, race, T stage, N stage, and M stage. Similar results were also obtained (Figure 6). As shown in Figure 7, higher risk scores were associated with males and tumors of higher grade, late-stage, larger size and lymph node metastasis. To discern distinct patterns of immune infiltration, the correlation between immune score and the level of immune cell infiltration was researched. The results showed the contents of various immune cells increased with increasing risk scores (Figure 8). It was demonstrated that changes in IRGs may promote tumor growth by altering the tumor immune microenvironment.

Univariate analysis and multivariate analysis of prognosis immune score and patients’ clinicopathological characteristics: (a) univariate analysis with Cox proportional hazard model and (b) multivariate analysis with Cox proportional hazard model.

Subgroup analysis of various clinicopathological factors by Kaplan–Meier curves for patients with gastric cancer. Kaplan–Meier curves of OS in different subgroups stratified by (a and b) age, (c and d) gender, (e and f) race, (g and h) T stage, (i and j) N stage, (k and l) M stage.

Relationships of the variables in the model with the clinical characteristics of patients in the entire TCGA cohort: (a) risk score and gender, (b) risk score and grade, (c) risk score and stage, (d) risk score and T stage and (e) risk score and N stage.
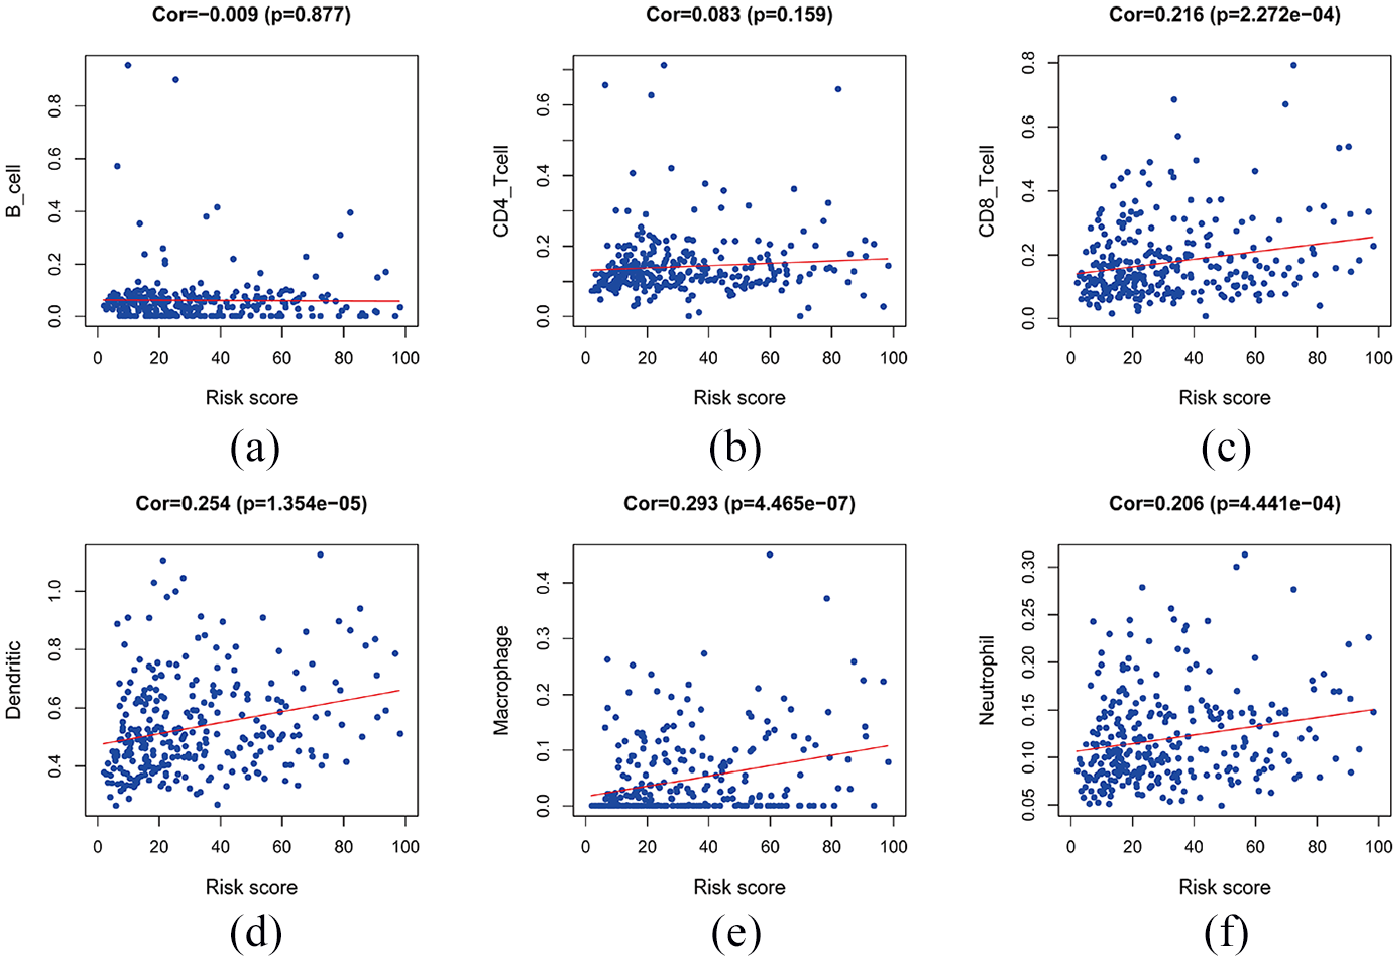
Immune cell type abundance correlation with risk score: (a) risk score and CD4_T cell, (b) risk score and CD8_T cell, (c) risk score and dendritic, (d) risk score and macrophage, (e) risk score and neutrophil and (f) risk score and B_cell.
Identification and integrated analysis of five-IRGs associated with drug-resistant in GC
The mRNA expression profiles arrays of GC (GSE58188 and GSE77346) were downloaded from the GEO database, normalized analysis was performed prior to DEGs. Finally, 2962 DEGs in the GSE77346 and 2478 DEGs in GSE58188 were respectively screened. Then, we overlapped the screened DEGs with 92 survival-related IRGs in TCGA. A Venn plot showed that five genes including CXCR4, DKK1, LGR6, NRP1 and TNFRSF1B were involved in the drug resistance process (Figure 9).

Venn diagram for the intersections between differential expressed IRGs of TCGA STAD and differential expressed drug resistance gene in GSE58188 and GSE77346.
To understand the expression changes and functions of five genes related to tumor resistance, the genetic changes of these genes in patients with GC were analyzed by the cBioportal database. Genetic alteration rates in the five genes (CXCR4, DKK1, LGR6, NRP1, and TNFRSG1B) ranged from 2.3% to 6% (Figure 10). Gene amplification and missense mutation were the most common mutations. We further performed survival analysis on the drug-resistant genes. The results showed that the patients with drug-resistant gene mutations lived longer than those without drug-resistant mutations (p = 0.0459). The median survival was not reached in the mutant group and involved 28.55 months in the wild-type group (Figure 11(a)). Disease-free survival and progression-free survival analyses yielded similar results (p < 0.01). The median survival was not reached in the mutant group and was 28.55 months in the wild-type group (Figure 11(b)).

Analysis of genetic alterations of five drug resistance IRGs.

Survival analysis of drug-resistance genes: (a) overall survival and (b) disease-free survival.
Then, we analyzed the association between drug resistant-related genes expression and the immune cell infiltration. We found that the screened IRGs were positively correlated with immune cell infiltration in the tumor microenvironment. Of these genes, NRP1, TNFRSF1B, and CXCR4 were significantly correlated with infiltration of six main immune cells (B cells, CD8+ and CD4+ T cells, macrophages, neutrophil, and dendritic cell) (Figure 12(a–c)). DKK was mainly related to CD8+ T cells and macrophage infiltration (Figure 12(d)). Also, the higher the expression level of leucine-rich repeat containing, G protein-coupled receptor 6(LGR6), the higher the infiltration level of B cells, CD4+ and CD8+ T cells and neutrophils (Figure 12(e)).

Six immune cell abundance correlation with five drug-resistant IRGs: (a) NRP1 expression and immune cell infiltration level, (b) TNFRSF1B expression and immune cell infiltration level, (c) CXCR4 expression and immune cell infiltration level, (d) DKK1 expression and immune cell infiltration level and (e) LGR6 expression and immune cell infiltration level.
Discussion
Although the incidence and mortality of GC have declined in recent years, GC remain on of the most common malignancies in the world. GC constitutes a serious medical burden, especially in East Asia. 18 A comprehensive, Genome-wide gene expression profiling study can be used for prognostic stratification and may help to develop individualized treatment options in GC patients. Recent studies have identified potential biomarkers associated with the diagnosis, treatment, and prognosis of GC through integrated bioinformatics analysis. Pan et al. suggest that LAYN can be used as a prognostic biomarker for GC, and LAYN expression showed correlations with immune infiltrating level in GC. 19 Mao et al. 20 identified candidate biomarker KLF8 and its pathway for GC from TCGA database. Moreover, NT5E is a prognostic biomarkers, and can serves as a potential therapeutic target in GC. 21
Some studies have shown that IRGs play important roles in the development and treatment of cancers.13,22 In our study, we screened IRGs related to prognosis and drug resistance of GC to enrich our understanding of their underlying mechanism and clinical significance. We screened out 155 differentially expressed IRGs from 2498 IRGs in the Cancer Genome Atlas Stomach Adenocarcinoma (TCGA-STAD) dataset. Functional analysis results showed that 155 differentially expressed IRGs were significantly involved in cytokine interactions and immune-related response. It has been reported that interactions between chemokines and their receptors recruit types of leukocytes affect immune response. 23 Multiple chemokines and their receptors have identified distinct expression and promote proliferation and migration in GC.24,25 In our study, an immune-related risk signature for GC was composed of four IRGs that had prognostic capability. Of these genes, three IRGs (NRP1, PPP3R1, IL17RA) were associated with high risk and FGF16 was identified as a protective factor. It has been shown NRP1 is frequently expressed on intra-tumoral Tregs in human tumors and is critical for Treg function in the TIME.26,27 The high expression level group of NRP1 in GC had a higher death risk than others, and NRP1 antagonist has potential in mediating immunotherapeutic effects. 28 Moreover, IL17RA had been implicated in controlling autoimmune inflammation, was highly expressed in a variety of tumors and associated with poor survival.29–32 In addition, FGF16 was shown to stimulate the proliferation and migration of hepatocellular carcinoma cells and ovarian cancer cells.33,34
Based on a four-IRGs signature, we divided GC patients into high- and low-risk groups. Patients with low-risk scores had much longer survival times than the high-risk scores. Multivariate Cox regression analysis further determined our four-IRG signature remained as an independent prognostic factor for OS. Our study indicated that NRP1, PPP3R1, IL17RA, and FGF16 may be involved in GC pathogenesis and serve as potential biomarkers for predicting prognosis of GC. Furthermore, previous studies have shown that immune cell infiltration can determine therapeutic effect in GC.35,36 We assessed the relative proportions of common immune cells in each sample and determined the relationship between tumor-infiltrating immune cells and risk scores. Our data showed that the abundance of multiple tumor-infiltrating immune cells is positively related to risk scores. Previous studies have shown that tumor-infiltrating immune cells play key roles in predicting the prognosis of GC.37,38 Our data indicated the changes in TIME may lead to poor prognosis of patients.
Many types of cancers may develop resistance to therapy, leading to poor therapeutic efficacy and reduced survival time. 39 Emerging evidence has shown that mutations in the genomes may participate in the resistance mechanisms.40,41 In our study, the association between survival-related IRGs and drug-resistant genes was explored, and we constructed a valid resistance IRGs risk signature. Then, we found patients in the mutation group had a higher proportion of tumor-infiltrating immune cell and lower survival rates. It is suggested that mutations may change the TIME and participate in the drug resistance process. Immunotherapies are effective and promising for advanced GC in the future. Because immunotherapy interferes with the tumor’s immune response instead of killing tumor cells directly. It is important to fully understand the underlying mechanisms of tumor immunity. Our results supplement the gap in immuno-oncology and laying the foundation for immunotherapy and immune mechanism exploration. However, some limitations were also found in our study. Firstly, our sample size is small, and a larger sample size is needed to verify our results. Next, our signature was constructed from information available on a public database in which the Asian population is relatively small and so our signature may not function effectively for Asian patients.
Conclusion
Our study identified several IRGs that may be associated with prognostic and drug resistance processes in GC. Based on the identified IRGs, the prognostic and drug resistance models were constructed, respectively. This may provide a deeper understanding and precision in the application of immunotherapy for patients with GC.
Footnotes
Acknowledgements
We thank the patients and investigators who participated in TCGA and GEO for providing data.
Abbreviations
IRGs: immune-related genes; TIME: tumor immune microenvironment; TCGA: The Cancer Genome Atlas; GEO: Gene Expression Omnibus; RSF: random survival forest; GC: gastric cancer; ICI: Immune Checkpoint Inhibitors; GO: gene ontology; KEGG: Kyoto Encyclopedia of Genes and Genomes; ROC: Receiver Operating Characteristic; AUC: Area Under Curve; DEGs: differentially expressed genes; FDR: false discovery rate.
Author contributions
All of the authors worked collaboratively on the work presented here. XL and CXF designed research; ZSR performed the data acquisition; LZ, DH, and WPH supervised the data and algorithms; LY, GTS, and LC performed data analysis and interpretation; WS, QXJ, and LYP carried out the statistical analysis; ZSR performed manuscript preparation; XL and CXF participated in manuscript editing and review. All authors read and approved the final manuscript.
Declaration of conflicting interests
The author(s) declared no potential conflicts of interest with respect to the research, authorship, and/or publication of this article.
Funding
The author(s) disclosed receipt of the following financial support for the research, authorship, and/or publication of this article: National Natural Science Foundation of China (No. 81673025), and The National Key Research and Development Program of China (No. 2017YFC1308900), and National Science and Technology Major Project of the Ministry of Science and Technology of China (No. 2017ZX09304025), and The Key Research and Development Program of Liaoning Province (2018225060).
Ethic approval
Since our data comes from public databases, ethics approval is not applicable for our study.
Informed consent
Since our data comes from public databases, informed consent is not applicable for our study.