
Abstract
Gastric cancer (GC) is one of the most common malignant tumors in the world. As far as we know, no biomarker has been widely accepted for early diagnosis and prognosis prediction of GC. The purpose of this study is to find potential biomarkers to predict the prognosis of GC. The differentially expressed gene (DEG) was analyzed from GSE93774. Enrichr was used to analyze the gene ontology (GO), Kyoto Encyclopedia of Genes and Genomes (KEGG) pathway, the enrichment of transcription factors (TF), miRNA, and kinase. GO analysis showed DEGs was enriched in the process of amino acid metabolism. Pathway results showed DEGs was mainly enriched in cell cycle. Propionyl CoA carboxylase alpha (PCCA), Enoyl coenzyme A hydratase short chain 1 (ECHS1), and 3-hydroxyacyl-CoA dehydrogenase (HADH) have prognostic value in patients with GC. ECHS1 and HADH genes were significantly associated with disease-free survival. There was a significant correlation between PCCA and overall survival rate. The results of this study suggest that PCCA, ECHS1, and HADH may be new biomarkers for predicting the prognosis of GC.
Introduction
Gastric cancer (GC) is the third leading cause of cancer-related death in the world. Due to the widespread use of endoscope, the detection rate of GC is generally improved.1,2 With the development of modern medical technology,3,4 carcinoembryonic antigen 19-9 (CEA 19-9) has been used in clinic.5–10 However, due to its sensitivity and specificity, the level of early diagnosis of GC is still not ideal. Although great progress has been made in the diagnosis and treatment of GC, 11 the prognosis is still not satisfactory, and the 5-year survival rate of patients with GC is less than 20%. Without regional lymph node metastasis, the survival rate of patients with GC will be greatly improved. Unfortunately, however, it is difficult to diagnose GC in the early stages. Therefore, people are very interested in looking for these potentially curable prognostic markers, especially their role in metastasis and cancer progression.12,13
The integrity of the tight junction of the gastrointestinal tract of the human body is the basis for maintaining the stability of the host environment, but it is also an important target for infectious and inflammatory drugs. The lack of tight junction integrity is not only a risk factor for inflammatory bowel disease, but also a major risk factor for cancer. Claudin-18 (CLDN18) is a transmembrane tight junction protein, 14 which is associated with the invasive phenotype and poor prognosis of GC.15,16 CLDN18 is a very effective tumor suppressor, which regulates the signal transduction and differentiation pathway of gastric epithelial cells by regulating paracellular permeability and transmucosal ion flux, including cellular signals and differentiation pathways needed for intramucosal homeostasis, thus inhibiting the development of GC.17–19
In the present study, we downloaded the original data (GSE93774) from Gene Expression Omnibus (GEO), 20 which is repository leads to the archiving as a hub for microarray data deposit and retrieval. Stomach neck region mRNA profiles of 7-day-old wild-type (WT) and claudin-18 knockout (CLDN18−/−) mice were generated to identify the DEGs. Subsequently, the DEGs were screened using GeneSpring software, followed by gene ontology (GO) and pathway enrichment analysis. By way of analyzing their biological functions and pathways, and Transcription Factor (TF) and miRNA and Kinase Enrichment Analysis. We may light the further insight of GC development at molecular level and explored the potential candidate biomarkers for diagnosis, prognosis, and drug targets, especially their role in metastasis and cancer progression.
Methods
Microarray data
The gene expression profiles of GSE93774 were downloaded from GEO database. GSE93774, which was based on Agilent GPL13112 platform (Illumina HiSeq 2000, Mus musculus), was submitted by Hagen et al. The GSE93774 dataset contained six samples, including three CLDN18−/− mice and three wild-type mice (WT).
Identification of DEGs
GeneSpring software was used for analysis. We use hierarchical clustering analysis to divide the data into two groups, and the two groups have similar expression patterns in terms of control and disturbance. The probe quality control was determined by principal component analysis (PCA) in GeneSpring software. It is statistically significant that we use the classical t-test to determine the DEG, with a change of twice as much and defined a p value cutoff of <0.05 to be statistically significant.
Gene ontology (GO) and pathway enrichment analysis
GO is a common and useful method to annotate genes and gene products and to identify the characteristic biological attributes of high-throughput genome or transcriptome data. KEGG is a knowledge base for systematic analysis of gene function, which connects genomic information with high-order functional information. To sum up, mapping the user’s genes to the relevant biological annotations in the DAVID database is an important basis for the success of any high-throughput gene function analysis.
Protein-protein interaction (PPI) network and modules analysis
The online resource Search Tool for the Retrieval of Interacting Genes STRING (https://string-db.org/cgi/input.pl) was used to construct relationships for hub proteins. Subsequently, the Molecular Complex Detection (MCODE) plug-in Cytoscape 3.6.0 software is used to filter the modules of PPI network. The default settings are as follows: degree cut-off, 2; node score cut-off, 0.2; K-core, 2; maximum depth, 100. Eventually, DEGs from different modules were used to analyze the enrichment of GO term and KEGG pathway in the DAVID database.
Transcription factor (TF) and miRNA and kinase enrichment analysis
Enrichment results were generated by analyzing the up-regulated and down-regulated gene sets using Enrichr. The following libraries of TF and miRNA were used for the analysis: ChEA and ARCHS4, miRTarBase, respectively. Significant results are determined by using a cut-off of p-value <0.1 after applying Benjamini-Hochberg correction. Protein kinases are enzymes that modify other proteins by chemically adding phosphate groups. Databases such as Kinase Enrichment Analysis (KEA) contain a large number of associations between kinases and their substrates. This information can be leveraged by Enrichr to identify the protein kinases whose substrates are over-represented in the up-regulated and down-regulated genes identified by comparing two groups of samples.
Expression levels, correlation, and survival analysis of hub genes
The online resource Gene Expression Profiling Interactive Analysis (GEPIA), which originated from The Cancer Genome Atlas database, was used to determine the overall survival (OS) and disease-free survival (DFS) outcomes of hub genes. Furthermore, the genes associated with OS and/or DFS were applied for further analysis, including Pearson correlation analysis and analysis of expression levels in tumor and normal tissues.
Results
Gene expression profiling and hub genes
GSE93774 was used to identify DEGs from CLDN18−/− and WT. Because the CLDN18−/− and WT were from the same individual, paired t-tests and Bonferroni post hoc p value adjustment were used. Firstly, there were 1000 differentially expressed genes with p values of <10−6. As shown in Figure 1(a), the −log (P) of each gene was plotted against the log2 ratio of CLDN18−/− intensity to WT intensity. The number of up-regulated genes (ratio >0) was similar to that of down-regulated ones (ratio <0), but more down-regulated genes (blue spots) had p values of <10−6 than up-regulated ones (red spots).
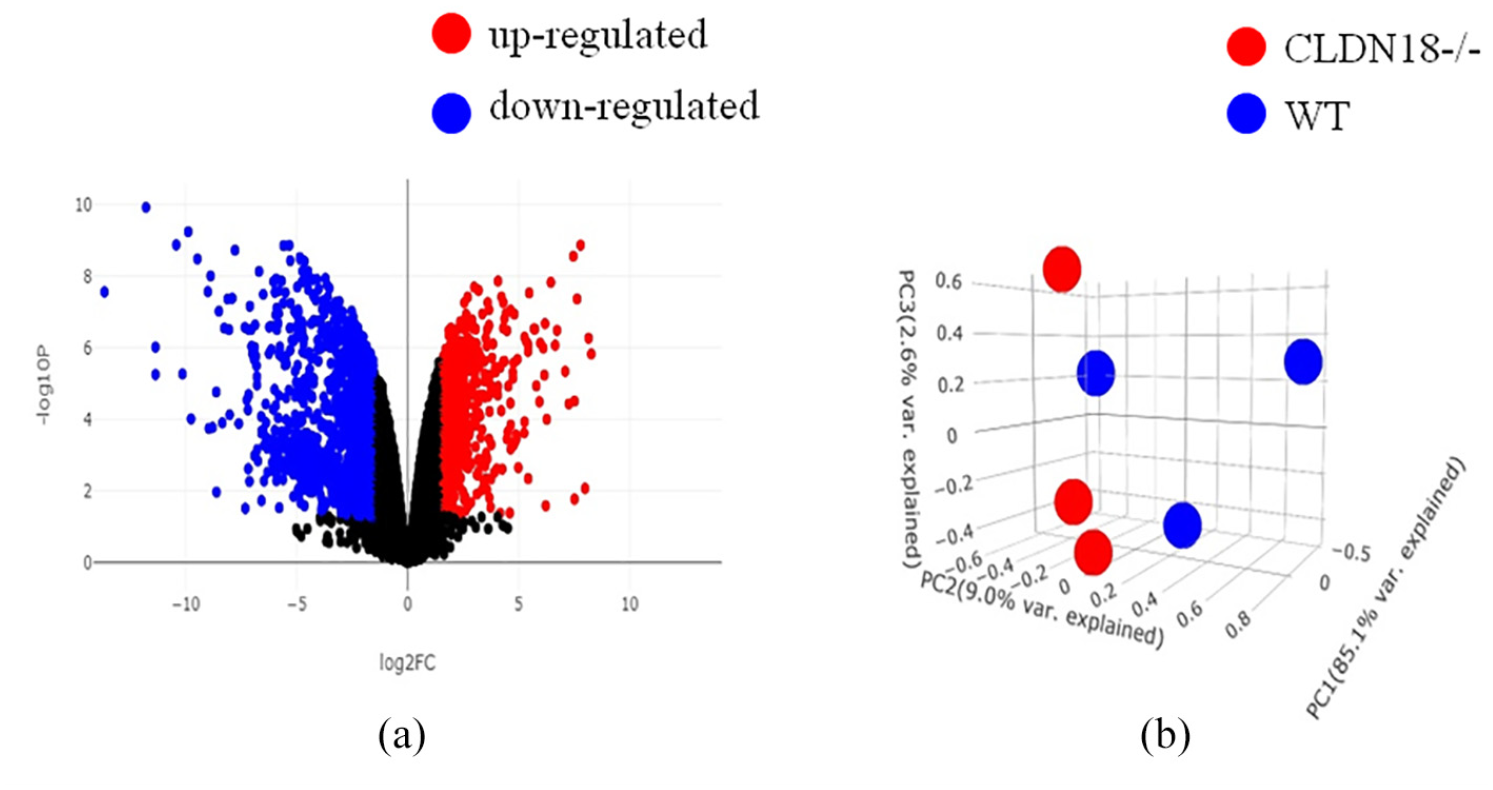
Expression profiles of differentially expressed genes in gastric cancer: (a) volcano plot of all genes. The −log (P) of each gene is plotted against the log2 ratio of CLDN18−/− intensity to wt intensity. Black line indicates the significance level at p = 10−6. Red dots indicate genes that were up-regulated in CLDN18−/−; blue dots indicate down-regulated genes and (b) PCA of the CLDN18−/− and wt. Red dots denote CLDN18−/−; blue dots denote wt. Each dot represents the expression values of the significant genes that were summarized at the first two principal component coordinates.
Next, PCA was applied to examine whether the differentially expressed genes could be used to distinguish CLDN18−/− from WT (Figure 1(b)). The results of PCA indicated that the differentially expressed genes could be used to separate the tissue samples into two distinct groups, namely CLDN18−/− and WT.
Subsequently, a PPI network of 1000 DEGs was constructed using STRING. Furthermore, 10 hub genes out of the DEGs were determined by the Degree method using the following criteria: p ≤ 0.05 and |log fold change (FC)| ≥ 1.5. The 10 hub genes were as follows: PCCB, PCCA, ALDH6A1, ACADM, ECHS1, HIBADH, HADH, ACADSB, IVD, HIBCH (Table 1).
Top 10 hub genes of differentially expressed genes, with high degrees.
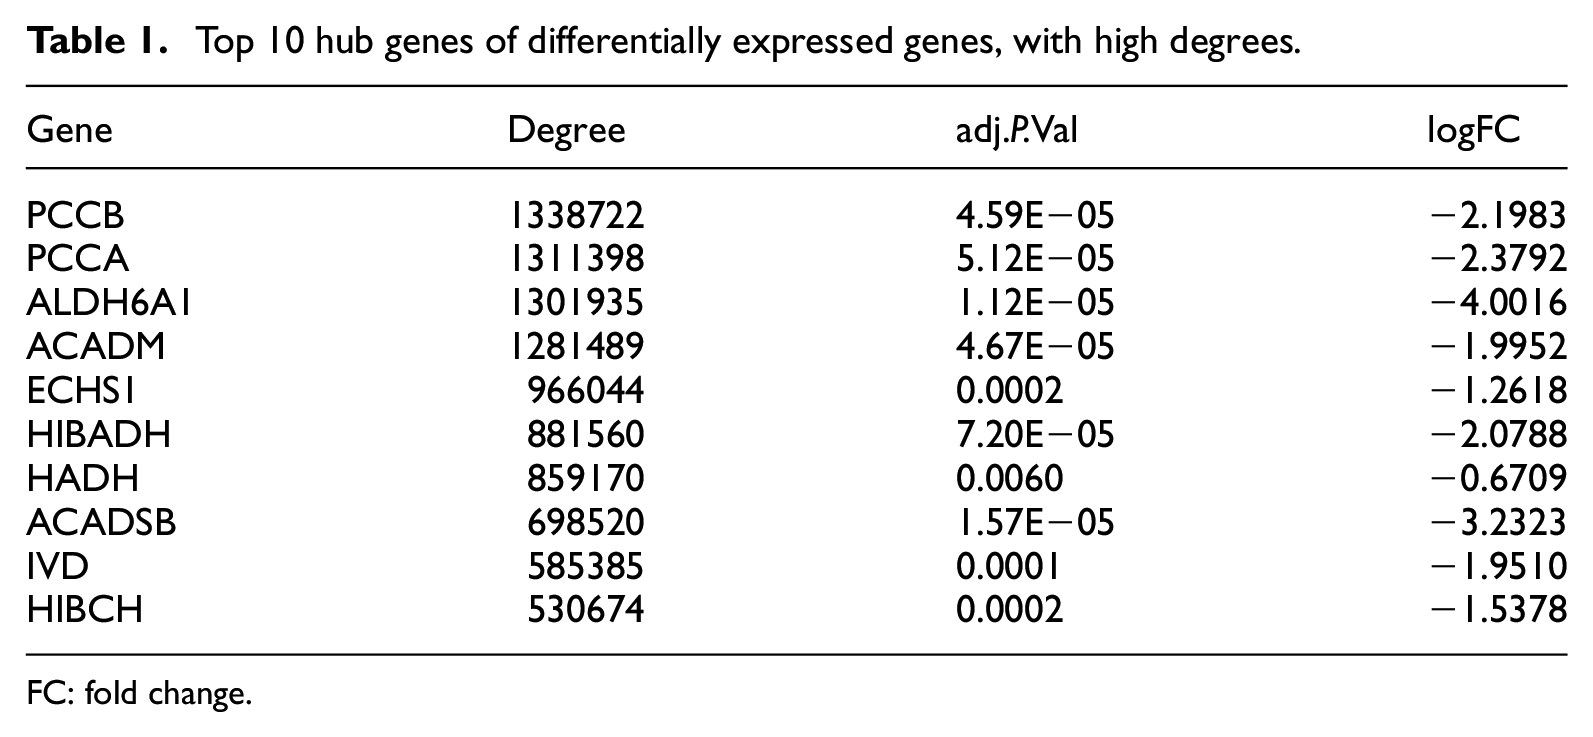
FC: fold change.
GO term enrichment analysis
We uploaded all DEGs to the online software DAVID to identify overrepresented GO categories and KEGG pathways. GO analysis results showed that up-regulated DEGs were significantly enriched in biological processes (BP), including rRNA processing, ribosome biogenesis, and DNA metabolic process. The down-regulated DEGs were enriched in branched-chain amino acid metabolic process, branched-chain amino acid catabolic process, and cellular amino acid catabolic process (Table 2). For molecular function (MF), the up-regulated DEGs were enriched in RNA binding. The down-regulated DEGs were enriched in enoyl-CoA hydratase activity (Table 2). In addition, GO cell component (CC) analysis also displayed that the up-regulated DEGs were significantly enriched in nucleolus, nuclear chromosome part, and preribosome. The down-regulated DEGs were enriched in mitochondrial matrix, mitochondrion, and mitochondrial respiratory chain complex I (Table 2).
Gene ontology analysis of differentially expressed genes.

KEGG pathway analysis
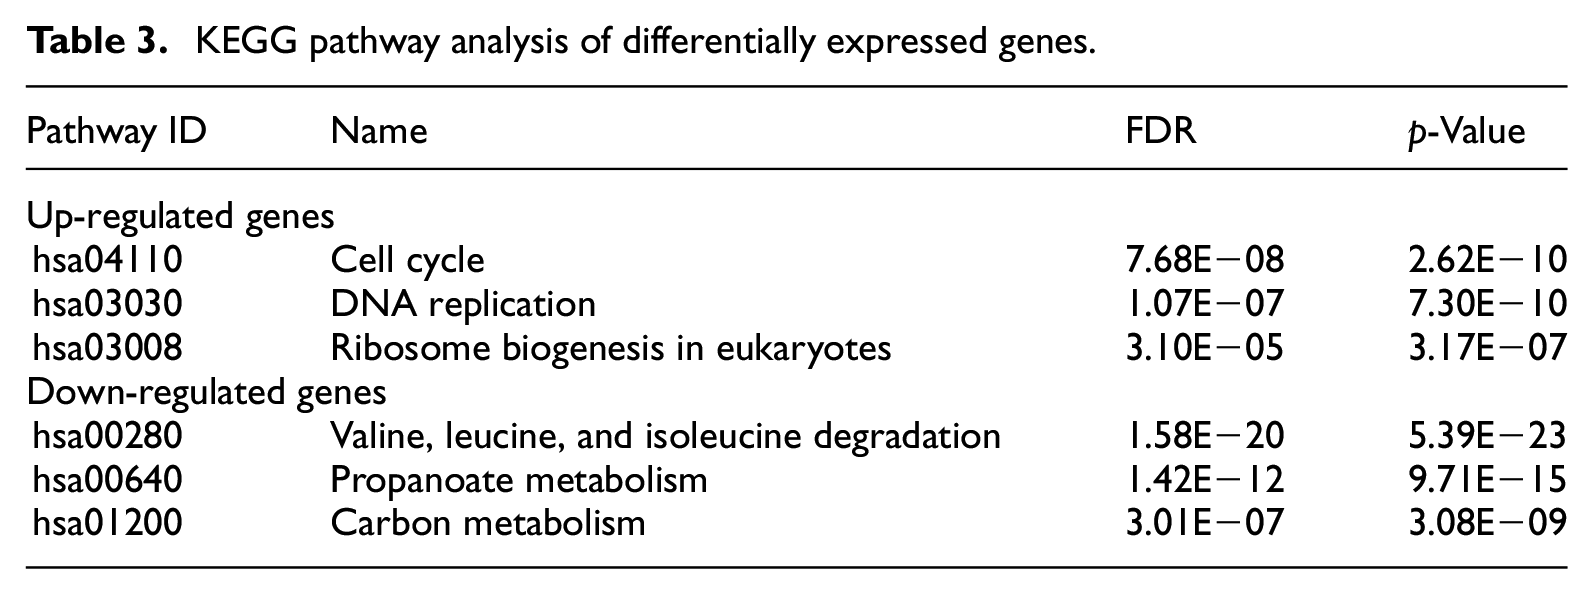
Table 3 contains the most significantly enriched pathways of the up-regulated DEGs and down-regulated DEGs analyzed by KEGG analysis. The up-regulated DEGs were enriched in cell cycle Homo sapiens, DNA replication Homo sapiens, and ribosome biogenesis in eukaryotes Homo sapiens. while the down-regulated DEGs were enriched in valine, leucine and isoleucine degradation Homo sapiens, propanoate metabolism Homo sapiens, and carbon metabolism Homo sapiens (Table 3).
KEGG pathway analysis of differentially expressed genes.
Transcription factor (TF) and miRNA and kinase enrichment analysis
TFs are proteins involved in the transcriptional regulation of gene expression. ChEA databases contain a large number of associations between TFs and their transcriptional targets. ARCHS4 databases indicated TFs whose top co-expressed genes are enriched. TFs whose targets are over-represented in the up-regulated genes is MYC, EKLF, FOXM1, and E2F4, the co-expressed genes is E2F8, TCF19, POLE3, and DEPDC1 (Table 4). While TFs whose targets are over-represented in the down-regulated genes is LXR, TBX20, RXR, and PPARA, the co-expressed genes is CD36, PRB3, RAPGEF3, and MAFA (Table 4).
Transcription factor enrichment analysis.

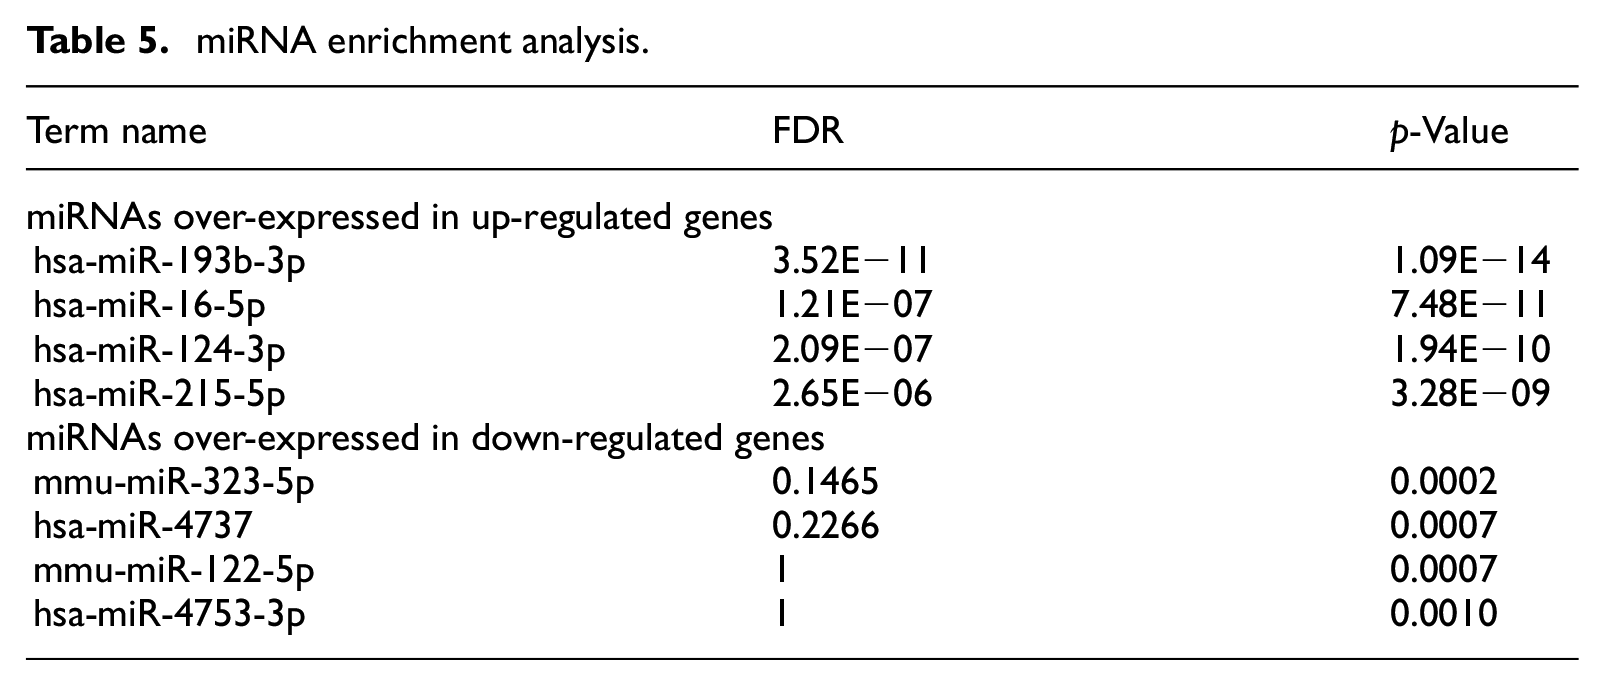
MiRNAs are small non-coding RNA molecules which play a key role in the post-transcriptional regulation of gene expression. TargetScan and MiRTarBase Databases contain a large number of associations between miRNAs and their targets. The miRNAs whose targets are over-represented in the up-regulated genes is hsa-miR-193b-3p, hsa-miR-16-5p, hsa-miR-124-3p, and hsa-miR-215-5p. The miRNAs whose targets are over-represented in the down-regulated genes is mmu-miR-323-5p, hsa-miR-4737, mmu-miR-122-5p, and hsa-miR-4753-3p (Table 5).
miRNA enrichment analysis.
Protein kinases are enzymes that modify other proteins by chemically adding phosphate groups. KEA databases contain a large number of associations between kinases and their substrates. The protein kinases whose substrates are over-represented in the up-regulated genes is CDK2, CDK1, PLK1, and GSK3B, the co-expressed genes is PLK1, SRPK1, BUB1, and BUB1B. The protein kinases whose substrates are over-represented in the down-regulated genes is BCKDK, PRKAA1, PRKAA2, and LRRK2, the co-expressed genes is SIK2 human kinase ARCHS4, PDK2, PRKCE, and CDK18 (Table 6).
Kinase enrichment analysis.

Survival curves, expression levels, and correlation analysis of hub genes
Through the GEPIA website, the above 10 HUB genes were analyzed by using the predicted values of OS and DFS. ECHS1 and HADH were significantly associated with DFS (log-rank p = 0.049 and 0.026, respectively, Figure 2(a) and (b)). PCCA was significantly associated with OS (Log-rank p = 0.0052) (Figure 2(c)). The analysis of these three genes shows that low expression levels lead to better living conditions. Other HUB genes did not show statistical significance. The genes PCCA, ECHS1, and HADH were then subjected to further analysis. Expression levels of these three genes are displayed in Figure 2(d) to (f). PCCA and HADH exhibited low expression levels in GC tissues, ECHS1 presented high expression levels in GC tissues. In addition, Pearson correlation analyses between the genes are presented in Figure 2(g) and (h). Results revealed that HADH was positively correlated with PCCA and ECHS1: PCCA (R = 0.15, p = 0.00025); ECHS1 (R = 0.28, p = 2.4 × 10⁻¹²).

Prognostic survival and Expression and Pearson correlation analyses of PCCA, ECHS1, and HADH genes. Disease free survival of ECHS1 (a) and HADH (b), overall survival of PCCA (c), expression analysis of PCCA (d), ECHS1 (e), and HADH (f), and (g, h) Pearson correlation analyses of PCCA, ECHS1, and HADH genes. ECHS1: enoyl coenzyme A hydratase short chain 1; HADH: 3-hydroxyacyl-CoA dehydrogenase; PCCA: propionyl CoA carboxylase alpha. *p < 0.05.
Discussion
GC is a globally important disease. With over 1 million estimated new cases annually, GC is the fifth most diagnosed malignancy worldwide. Due to its frequently advanced stage at diagnosis, mortality from GC is high, making it the third most common cause of cancer-related deaths. Unfortunately, however, it is difficult to diagnose GC in the early stages. Therefore, people are very interested in looking for these potentially curable prognostic markers, especially their role in metastasis and cancer progression.
Radical adequate surgical (R0) resection is the only curative therapeutic modality for GC although about 50%–70% of patients relapse after R0 resection and more than half of the patients present with advanced and/or metastatic disease at the time of diagnosis. No well-established standard of care is currently defined although fluoropyrimidine-based and platinum-based combinations with or without a third drug represent the most frequently used first-line combinations in Western countries. The possibility of using front-line pembrolizumab as alternative to cytotoxic agents such as cisplatin and 5-fluorouracil in PD-L1 positive, HER2 negative, advanced GC, or gastroesophageal junction (GEJ) cancer, is currently under investigation in the ongoing Phase III trial KEYNOTE-062.
Although the incidence rate of GC is decreasing in most countries, clinicians are expected to see more GC cases in the future due to the aging of the population. The improvement of living conditions related to economic development helps to reduce the prevalence of Helicobacter pylori, which is the main cause of GC. The increase in incidence rate of young people in high income countries indicates that the risk and epidemiology of GC have changed. Therefore, in the next 5 years, or even longer term, it is of great significance to pay attention to the changes in the epidemiology of GC for future cancer control and clinical practice.
In the present study, we extract the data from GSE93774 and identify DEGs between 7-day-old wild-type (WT) and claudin-18 knockout (CLDN18−/−) mice through bioinformatics analysis. 20 Function annotation showed that these DEGs were mainly involved in amino acid metabolic and catabolic process, mitochondrial matrix, ribosome biogenesis, DNA metabolic process, and fatty acid catabolic process. Through the construction of PPI, we found some key genes, which can provide new ideas for the treatment of GC.
The GO term analysis showed that up-regulated DEGs were mainly involved in rRNA processing, ribosome biogenesis, DNA metabolic process, and DNA replication, and down-regulated DEGs were involved in branched-chain amino acid metabolic and catabolic process, cellular amino acid catabolic process, and mitochondrial matrix. This is consistent with the understanding that the defects of cell cycle and cell proliferation regulation are the main reasons for the occurrence and development of tumors and that the ion transport in cancer cells is very different from that in normal cells.
HADH is the key enzyme of fatty acid oxidation.21–25 Shen et al. 26 demonstrated for the first time that the down-regulation of HADH promotes the progression of GC by activating the Akt signal pathway. ECHS1 is an important component of mitochondrial fatty acid β oxidation pathway.27,28 The change of ECHS1 expression is related to the proliferation of cancer cells. ECHS1 may play an important role in the proliferation and migration of GC cells through PKB and GSK3 β-related signal pathways. 29 In addition, some studies have shown that PCCA may be involved in the occurrence and development of disease and cancer.30–36 Metabolic reprogramming is a sign of cancer. However, the genetic changes of metabolism-related genes are largely unknown. Searching through the public database. Jo et al. 37 found that PCCA gene contains single nucleotide repeat sequences, which may be mutation targets of microsatellite unstable (MSI) cancer. This result increases our insight into the involvement of amino acid/nucleotide metabolism in the pathogenesis of cancer, especially for GC.
Conclusion
This study suggests that PCCA, ECHS1, and HADH may be potential prognostic markers of GC. In addition, ECHS1 may play a carcinogenic role in GC, while PCCA and HADH may act as tumor suppressors. These genes may play a role through amino acid metabolism and catabolism, mitochondrial matrix, cell cycle, DNA replication, and ribosomal biogenesis. In this study, some HUB genes were differentially expressed in GC, and have a certain value in predicting the prognosis of GC.
However, our research has some limitations, but which could provide experimental direction for the next research program. Firstly, we need to expand the existing analysis database and verify each other with the existing database to better verify our experimental results. Secondly, we need to verify the function of these genes from the molecular, cellular, and animal levels through experiments, especially in the transfer and tumor progression, so as to guide the clinical direction. Revised portion are marked in red in the paper.
Footnotes
Author contributions
Zhongxiang Du conceived the study and wrote the article, Xiajun Zhang and Weiya Gao searched the literature, Jie Yang edited the article.
Declaration of conflicting interests
The author(s) declared no potential conflicts of interest with respect to the research, authorship, and/or publication of this article.
Funding
The author(s) disclosed receipt of the following financial support for the research, authorship, and/or publication of this article: This work was supported by the Social Development Guide Project of Zhenjiang, China (FZ2019006).
Ethics
This is a review of previously published articles. No human or animals were involved; therefore, no ethical approval was needed.