
Abstract
More and more information on tourist spots is being represented as pictures rather than text. Consequently, tourists who are interested in a specific attraction shown in pictures may have no idea how to perform a text search to get more information about the interesting tourist spots. In the view of this problem and to enhance the competitiveness of the tourism market, this research proposes an innovative tourist spot identification mechanism, which is based on deep learning-based object detection technology, for real-time detection and identification of tourist spots by taking pictures on location or retrieving images from the Internet. This research establishes a tourist spot recognition system, which is a You Only Look Once version 3 model built in Tensorflow AI framework, and is used to identify tourist attractions by taking pictures with a smartphone's camera. To verify the possibility, a set of tourist spots in Hsinchu City, Taiwan is taken as an example. Currently, the tourist spot recognition system of this research can identify 28 tourist spots in Hsinchu. In addition to the attraction recognition feature, tourists can further use this tourist spot recognition system to obtain more information about 77 tourist spots from the Hsinchu City Government Information Open Data Platform, and then make dynamic travel itinerary planning and Google MAP navigation. Compared with other deep learning models using Faster region-convolutional neural networks or Single-Shot Multibox Detector algorithms for the same data set, the recognition time by the models using You Only Look Once version 3, Faster region-convolutional neural networks, and Single-Shot Multibox Detector algorithms are respectively 4.5, 5, and 9 s, and the mean average precision for each when IoU = 0.6 is 88.63%, 85%, and 43.19%, respectively. The performance experimental results of this research show the model using the You Only Look Once version 3 algorithm is more efficient and precise than the models using the Faster region-convolutional neural networks or the Single-Shot Multibox Detector algorithms, where You Only Look Once version 3 and Single-Shot Multibox Detector are one-stage learning architectures with efficient features, and Faster region-convolutional neural networks is a two-stage learning architecture with precise features.
Keywords
Introduction
Since 2001, Visitors to Taiwan have grown year by year, however, the number of passengers plummeted due to the outbreak of severe acute respiratory syndrome in 2003. After 2003, the number of people who traveled to Taiwan increased year by year until the number of people who came to Taiwan exceeded 10 million in 2014. 1 This coincides with an increase in business opportunities in the tourism industry. In addition, the recent popularity of self-service travel and backpackers has increased year by year, and travel APP-related software has become more and more popular with the public. However, due to the outbreak of coronavirus-2019 (COVID-19) in 2020, the number of tourists to Taiwan has dropped significantly shown in Figure 1. Compared with the number of visitors to Taiwan from January to June 2019, the number dropped from 5,986,259 to 1,261,886, a significant decrease of 79% of the number of visitors to Taiwan, and the impact of the decreased tourism output on the tourism industry is estimated lose 57.1 billion New Taiwan dollar (NTD). 2 To increase the number of domestic tourists, this research proposes a Hsinchu-scenic-spot recognition system based on deep learning object detection.

Changes in the number of visitors to Taiwan from January 2019 to June 2020. 2
In contrast to a general text search of keywords related to an attraction, the use of an itinerary planning software to arrange the travel itinerary is a currently a popular method. This research implements a system that provides an Android-based APP for users using photography to identify scenic spots to achieve scenic spot queries, and some convenient features such as scenic spot introduction, itinerary planning, navigation, etc. Tourists can not only use the camera of mobile devices to take pictures of sights in real-time, but can also identify scenic spots from photos of scenic spots collected on the Internet, which solves the dilemma of users who are interested, but do not know where the location in the photo is. In addition, many attractions have a certain history, but if there is no local guide to lead, you may miss out on learning the history and characteristics of the attraction. As a result, tourists may just take a photo and leave when they arrive at an attraction. To improve upon this, the user can use the APP developed by this research to know the historical information of the scenic spot in real-time during their visit. The APP development of this research provides travelers to enjoy their journey with a more relaxed and fulfilling mood.
The contributions of this research are as follows:
This research proposes a Hsinchu-scenic-spot recognition system, named “HsinchuFun,” which allows users to identify scenic spots in real-time by images, and combines with the Android-based APP for scenic spot inquiry, scenic spot introduction, itinerary planning, and navigation functions. This proposed convenient recognition system will improve tourists’ willingness, provide economic benefits of domestic tourism, and revitalize the development of domestic tourism. The You Only Look Once version 3 (YOLOv3)-based “HsinchuFun” recognition system provides users with the 28 Hsinchu-scenic-spot identification and attraction information within 4.5 s. Moreover, When the accuracy of the object detector is IoU = 0.6, the mean average precision (mAP) can reach 88.63%. This research compares the performance of deep learning models of YOLOv3, Faster- region-convolutional neural networks (R-CNN), and Single-Shot Multibox Detector (SSD) algorithms. The results are in the same data set, and the recognition time of the model using YOLOv3, Faster R-CNN and SSD algorithms is 4.5 s, 5 s, and 9 s respectively, and the mAP were 88.63%, 85%, and 43.19%, respectively when IoU = 0.6. The performance test results of this research show that the model using the YOLOv3 algorithm is more efficient and accurate than the model using the Faster R-CNN or SSD algorithms, where YOLOv3 and SSD are one-stage learning architectures with high-efficiency characteristics, and Faster R-CNN is a two-stage learning architecture with precise characteristics. The mobile APP developed by this research provides functions such as finding scenic spots, taking photos, and identifying features, as well as, popular scenic spots recommendation, itinerary planning, scenic spots dice, etc. Users can complete travel activities such as scenic spot identification, query, itinerary planning, and navigation on this mobile APP.
This paper is organized as follows: Section Introduction is the research background and research contributions, Section Related work is the current state of the research technology, and Section Methodology explains the system architecture of this research. In Section Simulation and experiment results, the development results and verification are carried out, and finally, Section Conclusion presents the conclusion of this article.
Related work
Neural network technology in the 2010s has risen by leaps and bounds due to GPU hardware acceleration and depth of research, and object detection and recognition algorithms based on convolutional neural networks (CNN) are also booming. R-CNN prescreens the candidate regions. A classic R-CNN model, such as AlexNet, extracts features and then uses a Support Vector Machine classifier to distinguish objects or backgrounds. Faster R-CNN selects candidate regions directly from the feature map of CNN to simplify the operation of prescreening candidate regions for both R-CNN and Fast R-CNN. Fast R-CNN uses Region of Interest Pooling (RoI Pooling) and performs only one CNN operation to improve R-CNN's shortcomings of slow detection speed due to excessive computation. In 2015, the YOLO (You Only Look Once) object detection algorithm proposed by Joseph Redmon et al. 3 opened a new era of real-time object detection.
There are two types of object detection and recognition: (1) a two-stage object detection algorithm that detects the location of the object and then classifies the object; (2) a one-stage object detection algorithm that detects and recognizes the type and classification of objects at the same time. The common two-stage object recognition algorithms are R-CNN and Faster R-CNN, and the popular one-stage object recognition algorithms are YOLO and SSD. This chapter will introduce related algorithms and related literature in order.
Faster R-CNN
S.Ren Et al. proposed the Faster R-CNN mechanism 4 which consists of two modules as follows. The first module is a deep fully convolutional network that proposes regions and the second module is a Fast R-CNN detector that uses these proposed regions. The entire system is an independent, unified target detection network using the neural network terminology of the recently popular “Attention” mechanism. Moreover, any size of images could be input into the Regional Proposal Network (RPN). The RPN then outputs a set of rectangular target proposals, where each proposal has a target score. This process is modeled with a fully convolutional network. The goal is to share calculations with the Fast R-CNN target detection network, so it is assumed that the two networks share a common set of convolutional layers. Independently trained RPN and Fast R-CNN modify the convolutional layer in different ways, therefore there are three methods used to train networks with shared characteristics: (1) alternating training, (2) approximate joint training, and (3) non-approximate joint training, to allow the sharing of convolutional layers between two networks, rather than learning two independent networks.
T. Bai proposed a Faster R-CNN algorithm for traditional building remote sensing detection, 5 which solves the problem of regional mismatch by RoI Align with texture information built on Dense Residual Network. The results from the experiment show that the mAP for landmark building detection is 82.1%, and the detection effectiveness of buildings is also relatively accurate according to the prediction frame of building coordinates.
K. Duan et al. proposed a novel anchor-free Corner Proposal Network (CPN) 6 with a two-stage process, where the first stage is to extract multiple object suggestions by finding potential corner key-point combinations, and the second stage is to assign a classification label to each suggestion through an independent classification stage. On the Microsoft Common Objects in Context (MS-COCO) data set, the average accuracy of CPN reaches 49.2%. CPN is also suitable for computing efficiency, with average precision (AP) reaching 41.6% and 39.7% at respectively 26.2 and 43.3 fps.
Y. Liu et al. proposed a hierarchical structure based on a deep learning model detection framework, 7 which focuses on the accurate detection of building pictures through remote sensing. To this end, multi-level training samples using Gaussian pyramids are constructed to learn the technical scale and spatial resolution of constructing object features at different positions. The framework can improve the mAP value of the following indicators: the building detection rate is 3.63%, 3.85%, and 3.77%, respectively.
Single Shot Multibox Detector (SSD)
Compared with the two-stage method of first detecting the position of the object and then identifying the object type, the one-stage method has attracted attention due to its simplicity in practice. However, the gap between anchor boxes and convolution features leading to poor performance is a fundamental problem for all one-stage algorithms. In their work, Chen et al. 8 propose a convolutional AlignDet architecture with a RoIConv operator, which aligns features and the corresponding anchors in a principled manner of one-stage to combine the accuracy of the alignment features and the flexibility of the anchor.
The SSD algorithm is a one-stage method, which is based on a feed-forward convolutional network. The SSD algorithm generates a set of bounding boxes (BBox) with a fixed size, scores the target classification instances existing in the above-mentioned BBox, and then uses a Non-Maximum Suppression (NMS) step to produce the final detection result. Based on a standard architecture, an auxiliary detection structure, such as multi-scale feature mapping for the detection or convolutional predictor for detection, 9 is used to detect objects. The difference between training the SSD algorithm and the typical detector is that the real information needs to be assigned to a specific output in a fixed set of detector outputs. Moreover, the back-propagation and the loss function can be applied end-to-end when determining the allocation.
In the scenario of using aerial cameras, satellite remote sensing, or camera-equipped unmanned aerial vehicles to facilitate post-disaster search and rescue missions, Y. Li proposed a damaged building evaluation method using SSD for pre-training and data enhancement 10 to solve the problem of obtaining a large number of effective samples in complex post-disaster scenarios. Taking the aerial images of Hurricane Sandy in 2012 as data, the experiments show that the results trained from scratch using the SSD algorithm can increase the overall accuracy by 10%, and the use of data enhancement strategies can increase mAP and mF1 by 72% and 20%, respectively.
G. Cao et al. proposed a SSD-based method to quickly detect small objects. 11 Rather than adding context information, G. Cao designed the connection module and the element module to be two feature fusion modules. The context information of the multi-level feature fusion is introduced into SSD to improve the accuracy of small objects. On the PASCAL VOC2007 dataset, experiment results show that the mAP of two feature fusion modules is higher than the baseline SSD by 1.6 and 1.7 points respectively, especially on some categories with small objects.
YOLO series
J. Redmon et al. proposed a real-time object detection system named YOLO. 3 The YOLO algorithm is a deep learning algorithm for one-stage object detection. Only one neural network is used for one calculation to directly predict the bounding box and class probability, and it can be regarded as an end-to-end optimization process because the entire detection process only uses a single neural network. The original object detection task was performed using classifiers, but in YOLO, object detection is regarded as a regression task to segment the bounding box from the space and calculate the class probability. The execution speed of such a unified architecture is very fast, and YOLO can perform 45 frames per second (fps) in real-time on image tasks. Another smaller version, Fast YOLO, can not only achieve an execution speed of 155 fps, but the mAP is also twice as fast as other real-time object detection systems. Finally, YOLO can learn object representations with better generalization compared to other detection methods, such as R-CNN, whether in natural images or artistic images. Although compared with other object detection systems, YOLO has a higher positioning error, it is unlikely that False Positive will appear in the background prediction. Because the one-stage fast identification and high efficiency of the YOLO series of algorithms have been applied in face detection, industrial image detection, and other fields in recent years, it is also very suitable for disaster detection environments where every second counts.
Redmon and Farhadi 12 proposed “YOLOv3,” which is based on CNN using dimensional clusters to fix anchor boxes to select BBox for collapsed buildings in remote sensing images after earthquakes. Four coordinates, represented as tx, ty, tw, th, are predicted by each bounding box. Each bounding box predicts the possible categories in the box using multi-label classification. YOLOv3 predicts the objectless score of each bounding box using logistic regression and uses a separate logical classifier instead of softmax. When the data set contains a large number of overlapping tags, such as women and people, it will impose an assumption so that each box contains only one classification if softmax is used. However, under normal circumstances, this approach is inappropriate. In contrast, the multi-label classification method can better simulate data. The binary cross entropy loss is used to predict the classification in the training process, which makes YOLO applicable to open image data sets used in more complex fields. Moreover, YOLOv3 uses a new network to extract features, which combines YOLOv2, Darknet-19, etc., and is composed of continuous 3 × 3 and 1 × 1 convolutional layer with some added shortcut connections. There are a total of 53 convolutional layers, so it is called Darknet-53. Compared with ResNet-101, Darknet-53 is 1.5 times faster. The performance of ResNet-152 is similar to it, but it takes more than twice as much time. Darknet-53 can also achieve the highest measurement floating-point operations per second. This means that the network structure can make better use of the GPU, making its prediction more efficient and faster.
Chun et al. 13 proposed the use of YOLOv3 for facial recognition in complex environments. After adjustments, in the facial detection benchmark WIDER FACE, the average accuracy is better than the aggregate channel feature, and the accuracy of two-stage CNN and Multi-scale Cascade CNN by more than 10%. Jun-Jie Xu and Chen 14 use footwear as an object to accurately identify the location and mark type algorithm. Realized through the network framework of YOLOv3, it is mainly used to train the characteristics of the shoes and verify the blocks not shown in the figure. To prove the validity, two different databases were used, which contained 700 shoe images. In particular, the database uses an image background and a clean background mixed composition. The complex data sets attempt to simulate the real situation so that the model for the identification of the real environment is upgraded.
Huang et al. 15 proposed using YOLOv3 to detect and count the city's traffic volume under different conditions and weather conditions. When data detection and traffic flow statistical analysis are further applied, the traffic management department can make better decisions for optimizing road infrastructure or traffic restrictions to avoid a large number of traffic congestion and traffic accidents and optimize modern smart cities transportation systems. Chadalawada 16 proposed real-time object detection and recognition for construction vehicles, using an image recognition system to identify and track construction vehicles in a timely manner, and introduce automatic driving in the future to solve the difficulty of moving construction vehicles during construction. Yadan Li et al. 17 used the YOLOv3 algorithm to identify structural cracks in aircraft, because aircraft structure inspection has played an important role in the aviation industry for a long time. However, given the complex background, these methods are time-consuming and inaccurate. Therefore, image recognition is used to make up for the time and negligence of the maintenance personnel's inspection, and to improve safety during flight by reducing the accident rate.
In the application of static architectural landscape, Ma 18 proposed a YOLOv3-based target detection method for the initial earthquake disaster reduction and relief methods to quickly estimate the damage to buildings, where lightweight CNN ShuffleNet v2 and the generalized intersection over union loss replace the Darknet-53 CNN and the loss function of the prediction box center point in YOLOv3, respectively. Compared with the general YOLOv3 with Darknet-53 CNN, the detection speed and the accuracy are increased by 5.21 fps and 5.24%, respectively. Therefore, the lightweight CNN ShuffleNet v2-based YOLOv3 model can effectively detect collapsed buildings in high-resolution remote sensing images after an earthquake.
Park and Ko 19 proposed an ELASTIC-YOLOv3 algorithm to detect the candidate fire area in the pre-processing stage, regardless of the size of the fire, in the urban environment. Compared with daytime detection, it is more difficult to detect fires at night in urban areas due to environmental lightings such as car headlights, streetlights, and neon lights. The fire tube is composed of N frames of dynamic flame optical flow and converted into a bag-of-features (BoF) histogram which is used to reflect the dynamic characteristics of the flame at night. To verify candidate fires, BoF is applied to the random forest classifier with high classification performance of table features.
Methodology
System architecture
The System architecture of the Hsinchu-scenic-spot recognition system proposed by this research is shown in Figure 2. Users can connect the XAMPP server with MySQL database, named database server, through an Android-based APP, then XAMPP performs user identity authentication. After the system confirms the user's identity, the user can search for scenic spots, receive introductions to popular scenic spots, as well as itinerary planning and navigation through scenic spot pictures. When the user searches for a scenic spot with a picture, the application (APP) will upload the photo to the database, and XAMPP will transfer the photo to the YOLOv3 object analysis system based on Tensorflow Artificial Intelligence (AI) Framework to analyze and identify the scenic spot in the picture. After the analysis is completed, the object analysis system will send the results to the XAMPP server and store the analysis results in the database, and then return the results to the APP user.

“Hsinchufun” system architecture.
The development tools and platform specifications used in this research and development system are shown in Table 1. This system originally used Intel®Core™i9-9900KF Central Processing Unit (CPU) @ 3.60 GHz as the main training computing core of the object analysis system, but it was found that the system's computing efficiency was not high, and it took 3 days to train 100 iterations. In order to improve the training efficiency of the object analysis system, this system uses the Graphics Processing Unit (GPU)-assisted computing of GeForce® GTX 2060 and uses the parallel computing architecture CUDA (Unified Computing Architecture) and the GPU acceleration library cuDNN to accelerate the speed and efficiency of thematic training. The progress of the object analysis system that originally took 3 days to train can be shortened to 30 min, accelerating its training speed by 144 times. Coupled with the aid of the OpenCV computer vision library, it provides instant image processing, computer vision, and image recognition.
“Hsinchufun” development tools and platforms.

YOLOv3: You Only Look Once version 3; APP: Application; CUDA: Compute Unified Device Architecture; GPU: Graphics Processing Unit.
Training model
The Research method in object recognition model construction is as follows: (1) Photo collection of Hsinchu-scenic-spot images, (2) Feature value labeling, (3) YOLOv3 model construction, (4) Model training, and (5) Parameter adjustment to improve recognition accuracy.
In the first step of collecting photos of scenic spots, our research team personally visited scenic spots in the Hsinchu area to take photos. Initially, we collected 28 scenic spots in Hsinchu with a total of 15,351 images to enrich the introduction and description of scenic spots in the system. In addition to the identification of the 28 scenic spots, the system also dynamically grabs the list of tourist attractions in Hsinchu City from the Hsinchu City Government Information Open Platform 20 for the explanation of 77 scenic spots in Hsinchu.
For the feature value labeling in the second step, this system uses LabelImg 21 developed by Tzutalin to provide the feature extraction function of training photos, that is, the features of scenic spots in label training photos. As shown in Figure 3, after saving frame the features of the scenic spot with blue squares, LabelImg will save this box in YOLO format as shown in Figure 4, which represents the number of the object class, the ratio of the X-axis of the object center to the entire image, the ratio of the Y-axis of the object center to the entire image, the ratio of the width of the object to the width of the entire image, and the ratio of the height of the object to the height of the entire image, respectively. YOLO algorithms use this information to determine the location and size of the features in the photo, in order to provide training data analysis system objects.
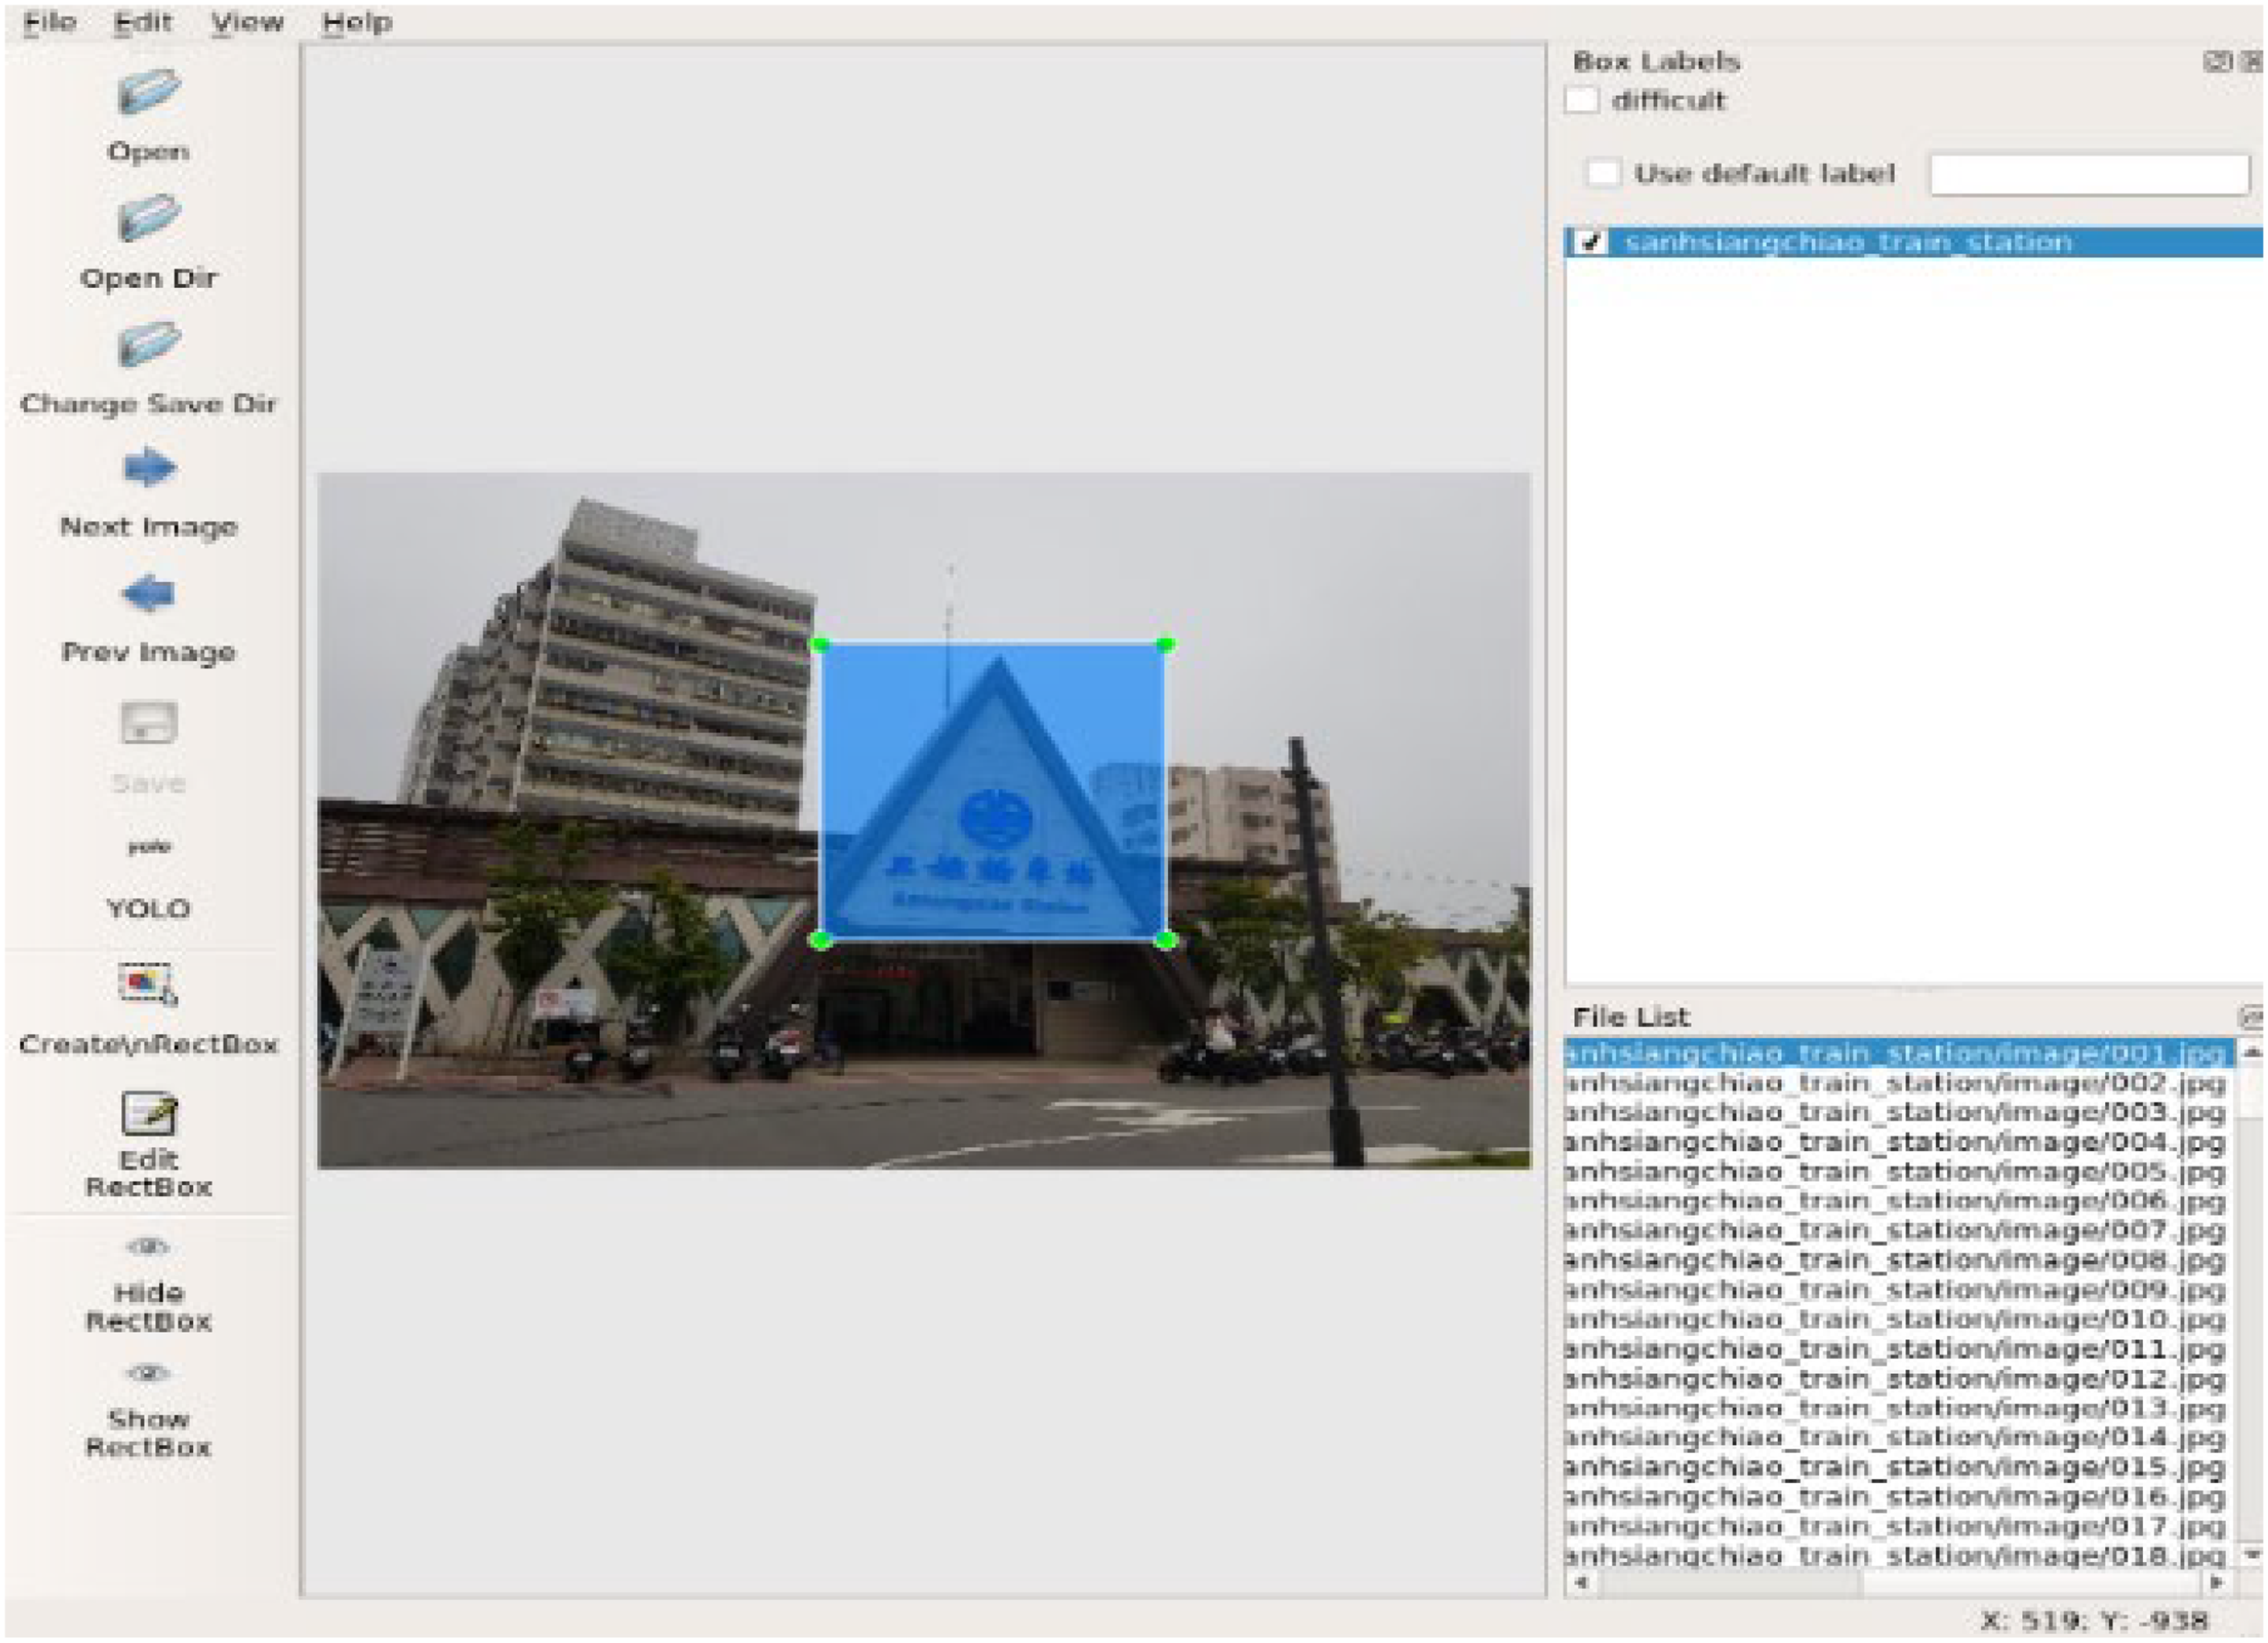
Labelimg feature extraction tool.

Yolo format.
In the third step of the YOLOv3 model building process, the YOLOv3 12 algorithm is currently the most widely used technology for object detection. In object detection, the object is usually recognized first and then the object is classified. This recognition method is usually called two-sage learning since this way is equivalent to two forms of recognition. It not only tests the computing power of the CPU but also takes time. YOLO combines these two identification steps into one process, so it is called one-stage learning. It first divides the image into blocks of the same size and then draws a bounding box to select candidate areas that may have objects, and at the same time detects possible objects in the image block. It then combines the two results. To improve the user experience of this study, the YOLOv3 algorithm is used to build in the recognition model since the recognition rate of the YOLOv3 is faster than other object detection methods.
In the fourth step of model training and the fifth step of parameter tuning to improve the recognition accuracy, this training model initially uses the eighty-twenty rule as the ratio of the training set to the test level. That is, 80% of the data set is used for training, and 20% of the data set is used for testing. Moreover, we detect the numerical evaluation index mAP of the system parameters to adjust the accuracy of the identification of objects through experiments. The mAP is the average value after calculating the AP of each object. The AP is calculated from the results of precision and recall, where precision is the ratio of the AI model used to determine that there are objects, how many is the ratio of the objects that actually have objects, and recall is the ratio of how many objects are correctly judged when the AI model judges that there are objects.
Simulation and experiment results
There are two subsections in this chapter. The first section describes the influence of the threshold of NMS on the accuracy of the object recognition model using YOLOv3 and implements the relevant test results in this study. The second subsection is the performance comparison of deep learning models of the Faster R-CNN, YOLOv3, and SSD algorithms.
Scenic spot identification system
The system architecture of the Hsinchu-scenic-spot recognition system proposed by this research is shown in Figure 2. At the end-user sites, mobile users using the Android-based APP take pictures and send Hsinchu-scenic-spot images to the server sites including a database server and an object recognition server. After detecting and recognizing, the object recognition server sends the recognition result, the name of the Hsinchu-scenic-spot image, to end-user sites through the database server. The response time from the end-user site to the server site and the YOLOv3-based server site sending results to end-users is 4.5 s. Moreover, the response time based on the Faster R-CNN and SSD algorithms is 5 and 9 s, respectively.
When users see photos of scenic spots on social media if they do not know what the scenic spots are, they can use the object analysis system of this research to search for the scenic spots in the picture. However, if the accuracy of the object analysis is not enough, there will be wrong results or the analysis results will be empty. To avoid this situation, this research needs a way to judge the accuracy of the analysis. Our method is to use Intersection over Union (IoU) and mAP as the unified index of the accuracy of the object analysis system, 22 where IoU is the ratio of the intersection between the predicted result of the object recognition model and the correct result to the set in the YOLO algorithm. IoU can also be applied to NMS. 23 When the object analyzes multiple BBox, the system is determined by the set IoU to decide which BBox should be kept and which should be deleted.
In this study, there are 15,351 attractions photographed for 28 scenic spots, that is, object classes. The 15,351 attractions photographed are randomly divided into a training set and testing set according to 80% and 20%, respectively. That is, there are around 12,280 attractions photographed for training, and 3071 attractions photographed for testing. After 3223 iterations in the training process with IoU = 0.5, IoU = 0.6, and IoU = 0.7 in the case of identification of a single object, the possibility of multiple BBox overlapping and not being removed by NMS increases while IoU increases. Therefore, a single object is more likely to be selected by multiple BBox, thereby reducing the accuracy mAP of the system. For this reason, this research also conducted multiple object identification tests to understand whether the system will also be affected by the threshold of NMS when judging multiple objects.
Under the same experimental parameters of the above-mentioned single object, in the context of multi-object identification, the possibility of overlapping BBox and not being eliminated by NMS is lower while IoU increases, and the more likely it is to predict multiple objects. When there are more objects to be identified in a photo, the result is more accurate. In addition, for different IoU settings, Figure 5 shows the relationship between the overall accuracy of the system and the loss value when IoU = 0.5, IoU = 0.6, and IoU = 0.7, respectively.

The overall accuracy and loss value when (a) IoU = 0.5, (b) IoU = 0.6, and (c) IoU = 0.7 for You Only Look Once version 3 (YOLOv3).
When IoU = 0.5, IoU = 0.6, and IoU = 0.7, mAP = 84%, mAP = 88.63%, and mAP = 81.5% respectively shown in Table 2.
The mAP when different IoU in “HsinchuFun.”

mAP: mean average precision.
From this experiment, we can know the relationship between NMS and the loss value, and this study can use this feature to fine-tune the recognition mode of the recognition model. If you need to recognize multiple objects at once, you can increase the threshold to make the recognition module more sensitive to multiple objects. On the contrary, you can also lower the threshold to further improve the recognition rate of the recognition module to a single object. After the above research, this research uses IoU = 0.6 and mAP = 88.63% of the object analysis system threshold to increase the sensitivity of the system to identify multiple objects.
Performance comparison between one-stage and two-stage deep learning object detection
When tourists take photos at a Hsinchu-scenic spot and upload the photos to the “HsinchuFun” system, this research aims at image recognition and recognition accuracy of the following algorithms: Faster R-CNN, Yolov3, and SSD algorithms., where Faster R-CNN is a two-stage learning architecture with precise characteristics, and YOLOv3 and SSD are one-stage learning architectures with high-efficiency characteristics. In object detection, the object is usually recognized first and then the object is classified. This recognition method is usually called two-sage learning since this way is equivalent to twice recognition. Because of the two forms of recognition, two-stage learning has precise characteristics, but it takes a long time. In contrast to two-stage learning, one-stage learning combines these two identification steps into one process. Hence, one-stage learning has higher efficiency characteristics but is less precise than two-stage learning. The tradeoff between precise and efficient performance is an interesting and critical issue.
Faster R-CNN is one of the classic two-stage learning methods. Using 15,351 attractions photographs for 28 object classes as the input data set, the batch size is set as 256 for 15,000 training iterations. The precision-recall curve of Faster-R-CNN is drawn according to the trained data shown in Figures 6–8 when IoU = 0.5, IoU = 0.6, and IoU = 0.7, respectively. The average accuracy rate reaches 86%, 85%, and 86% when IoU = 0.5, IoU = 0.6, and IoU = 0.7, respectively.

The average accuracy rate of 28 scenic-spots under IoU = 0.5 for Faster-region-convolutional neural networks (R-CNN).

The average accuracy rate of 28 scenic-spots under IoU = 0.6 for Faster-region-convolutional neural networks (R-CNN).

The average accuracy rate of 28 scenic-spots under IoU = 0.7 for Faster-region-convolutional neural networks (R-CNN).
The SSD algorithm is one of the classic one-stage learning methods. Using 15,351 attractions photographs for 28 object classes as the input data set, the batch size is set as 64 for 15,000 training iterations, where there are 12,280 attractions photographs for training, and 3071 attractions photographs for testing. The loss curve chart based on the trained data of SSD is shown in Figure 9, where the orange curve, the blue curve, and the red curve represent the results when IoU = 0.5, IoU = 0.6, and IoU = 0.7, respectively. The average accuracy rate reaches 47.35%, 43.19%, and 48.65% when IoU = 0.5, IoU = 0.6, and IoU = 0.7, respectively.
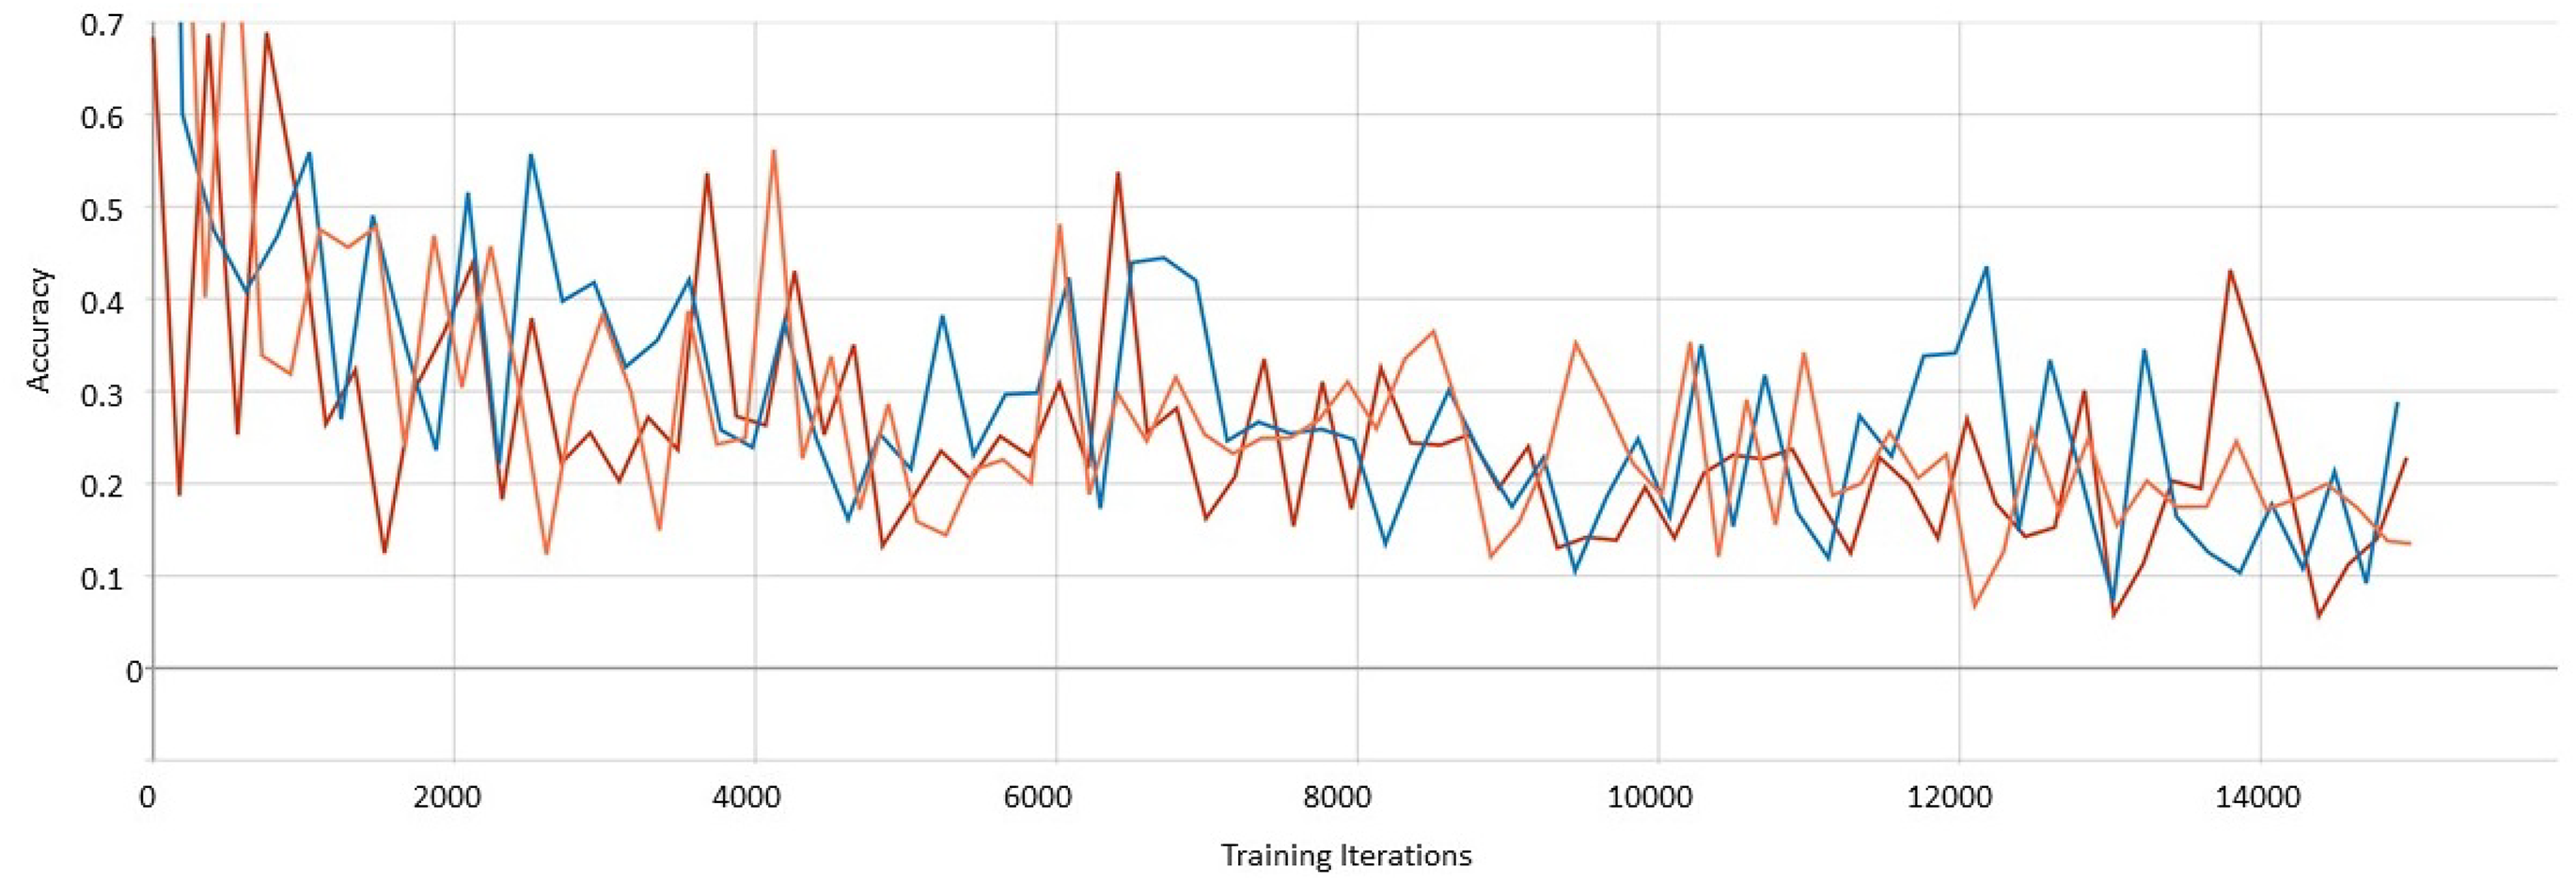
The accuracy curve of Single-Shot Multibox Detector (SSD) when IoU = 0.5, IoU = 0.6, IoU = 0.7.
The results of the Yolov3, Faster R-CNN, and SSD model performance comparisons are summarized in Table 3.
Performance comparison of YOLOV3, faster R-CNN and SSD in “HsinchuFun.”

mAP: mean average precision; IoU: intersection over union; YOLOv3: You Only Look Once version 3; R-CNN: region-convolutional neural networks; SSD: Single-Shot Multibox Detector.
Moreover, we compare the training models of Faster R-CNN and Yolov3 when IoU = 0.6 and learning rate = 0.01. In this study, 15,351 scenic-spot photos as the dataset based on the Yolov3 algorithm, and a total of 3223 iterations for the training process were performed when the batch was set to 64, which is equivalent to 206,272 images. In the Faster R-CNN algorithm, 15,351 pictures were used, and 15,000 iterations for the training process were performed when the batch was set to 256, which is equivalent to 3,840,000 pictures. The Yolov3 under 206,272 images training recognition rate reached 88.63%, however, Faster R-CNN trained on 3,840,000 pictures barely reached 86% accuracy rate.
We compare the training models of the SSD and the Yolov3 algorithm when IoU = 0.6 and learning rate = 0.01. In this study, 15,351 images were used as the training data based on the Yolov3 algorithm, and a total of 3223 iterations for the training process were performed when the batch was set to 64, which is equivalent to 206,272 images. In the SSD algorithm, 15,351 images are used, and 15,000 iterations for the training process were performed with a batch of 64, which is equal to 960,000 images. Yolov3 had a recognition rate of 88.63% under the training of 206,272 images, while the SSD algorithm trained on 960,000 images was barely able to reach 43.19% accuracy when IoU = 0.6.
According to the performance results regarding the response time and mAP, this research shows the model using the YOLOv3 algorithm is more efficient and precise than that using the Faster R-CNN and SSD algorithms.
Conclusion
Since the End of 2019, the global tourism market has been hit hard by the impact of the COVID-19 epidemic. To improve the tourism market, Mafiroh 24 uses Instagram social media data such as photo title, Hashtag, comment, geotag, etc., to analyze the relevant data of Geni Langit Tourism Park attractions to understand and increase the interest of visitors. Thaib and Bima, 25 create a location-based service (LBS) mobile application for Morotai Island Regency to provide visitors with a route to their destination easily and quickly.
Different from only using LBS or text searching to find more tourist spots, this research proposes a Hsinchu-scenic-spot recognition system based on deep learning object recognition technology. By building a model based on the YOLOv3 algorithm in TensorFlow AI Framework, the Hsinchu-scenic-spot recognition system, named “HsinchuFun,” provides users with the ability to use the camera on the Android APP terminal device to take pictures of scenic spots to identify the scenic spots in Hsinchu, Taiwan. Combined with the functions of 77 Hsinchu-scenic-spot introductions, dynamic itinerary planning, and Google MAP navigation on the Hsinchu City Government Information Open Platform, the object analysis system of this study can identify 28 Hsinchu-scenic spots, and the accuracy of the object detector as IoU = 0.6, the mAP can reach 88.63%. The results of this research allow users to complete the identification of Hsinchu attractions, travel itinerary editing, and tour guidance through a single APP, to promote the services of local tourism in Hsinchu, Taiwan. This research also continues to increase the scenic spot training set.
In the future, we can collect scenic spot data from various places in Taiwan to provide identification of all of Taiwan's scenic spots. We can also cooperate with local businesses to enhance the convenience of Taiwan's tourism industry services. In addition, the system can also be upgraded to an international version, which provides international travelers with the ability to obtain identification information of scenic spots by taking pictures and to conduct local tours in Taiwan, which can enhance the visibility of Taiwanese sightseeing.
Footnotes
Acknowledgment
This research was supported in part by the Ministry of Science and Technology of R.O.C under contract MOST 109-2222-E-216-001.