
Abstract
Fully convolutional networks were developed for predicting optimal dose distributions for patients with left-sided breast cancer and compared the prediction accuracy between two-dimensional and three-dimensional networks. Sixty cases treated with volumetric modulated arc radiotherapy were analyzed. Among them, 50 cases were randomly chosen to conform the training set, and the remaining 10 were to construct the test set. Two U-Net fully convolutional networks predicted the dose distributions, with two-dimensional and three-dimensional convolution kernels, respectively. Computed tomography images, delineated regions of interest, or their combination were considered as input data. The accuracy of predicted results was evaluated against the clinical dose. Most types of input data retrieved a similar dose to the ground truth for organs at risk (p > 0.05). Overall, the two-dimensional model had higher performance than the three-dimensional model (p < 0.05). Moreover, the two-dimensional region of interest input provided the best prediction results regarding the planning target volume mean percentage difference (2.40 ± 0.18%), heart mean percentage difference (4.28 ± 2.02%), and the gamma index at 80% of the prescription dose are with tolerances of 3 mm and 3% (0.85 ± 0.03), whereas the two-dimensional combined input provided the best prediction regarding ipsilateral lung mean percentage difference (4.16 ± 1.48%), lung mean percentage difference (2.41 ± 0.95%), spinal cord mean percentage difference (0.67 ± 0.40%), and 80% Dice similarity coefficient (0.94 ± 0.01). Statistically, the two-dimensional combined inputs achieved higher prediction accuracy regarding 80% Dice similarity coefficient than the two-dimensional region of interest input (0.94 ± 0.01 vs 0.92 ± 0.01, p < 0.05). The two-dimensional data model retrieves higher performance than its three-dimensional counterpart for dose prediction, especially when using region of interest and combined inputs.
Introduction
Intensity-modulated radiotherapy and volumetric modulated arc therapy (VMAT) are widely used to treat malignant tumors.1–3 The treatment plan quality, which is a major factor for the curative effect of radiotherapy, is related to the experience and skills of the practitioner and the individual anatomy. 4 As planning based on trial-and-error necessitating a long planning time, the development of techniques such as online adaptive radiotherapy is restricted. 5
Dose prediction before planning is useful for treatment plan quality assurance and subsequent automatic planning.5–16 Moreover, accurately predicted doses can reduce the number of interactions between the practitioner and computer and thus the planning time, also improving the plan quality and consistency. Dose prediction has evolved from single-value6–10,14 and dose-volume histogram prediction5,11 to three-dimensional (3D) dose distribution prediction.12,13,15–17 With the increased knowledge of radiobiology, the radiation effects on organs have been unveiled, especially with 3D dose distribution, 18 thus suggesting the higher capabilities of 3D dose prediction over other methods.
A fully convolutional network (FCN) is an end-to-end method that can automatically extract hierarchical features from original images to generate corresponding masks. 19 Its successful application to medical image segmentation20–23 has led to its use for dose distribution prediction in head and neck cancer using either two-dimensional (2D) or 3D models.15,16 Previous studies have focused on the use of deep learning and the network structure with data from contoured structures which separated from Computed tomography (CT) images as inputs. However, comparisons of different types of input data have not been conducted, despite the dependence of deep learning performance on both the network architecture and input data.
In this paper, we compare the use of 2D and 3D FCN models for predicting dose distribution in left-sided breast cancer. We use either the delineate regions of interest (ROIs), CT images, or their combination with multiple channels to consider the effect of density in dose calculation. The purpose of this study was to determine a superior input data type for the dose prediction FCN model.
Materials and methods
Patient data
Data from 60 patients with left-sided breast cancer (stage T1M0N0) previously treated using VMAT at the Zhejiang Cancer Hospital (Zhejiang, China) in 2016–2019 were randomly considered for this study. The patients’ volumetric CT data were acquired in freebreath using the Brilliance CT Big Bore system (Philips Healthcare, Best, Netherlands) on the helical scan mode. Each reconstructed CT image had a matrix size of 512 × 512 and a thickness of 5 mm. Clinical treatment plans were generated using the RayStation treatment planning system (RaySearch Laboratories, Stockholm, Sweden) with 6 MV X-rays on a Trilogy linear accelerator (Varian Medical Systems, Palo Alto, CA, USA). The dose calculation algorithm was RayStation's collapsed cone convolution algorithm, and the grid size was 3 mm × 3 mm × 3 mm. Clinical target volumes (CTVs) were delineated by clinical oncologists based on the guidelines developed by the European Society for Radiotherapy and Oncology. 24 The CTVs encompasses visible breast tissue and tumor bed. The irradiation area did not include internal breast areas and cervical lymph nodes. The planning target volumes (PTVs) were constructed by adding a 5 mm margin to the CTVs for all photon plans. All PTVs were clipped 5 mm from the skin surface. In addition, the heart, ipsilateral lung, whole lung, and spinal cord were contoured. All plans considered a prescription of 50 Gy in 25 fractions, and the prescription dose covered at 95% of the PTV. The mandatory target volume constraints for the PTVs and organ-at-risk (OAR) dose objectives followed the protocol developed at our institution. The PTV percentage volume above 110% of the prescription dose must not exceed 10%. The dosimetric constraints were V5 < 55%, V20 < 30%, and V30 < 20% of the left lung volumes, respectively, and 8 Gy to mean heart dose. The VMAT plans were generated using the RayStation treatment planning system with 4° control point spacing. Double partial arc ranging from 290–310° to 115–165° were chosen depending on the anatomy of each patient. The basic characteristics of these contours and plans are listed in Table 1. When meeting all the constraints, the plans were optimized repeatedly to achieve optimal sparing of normal tissues that ensures the minimal OAR doses for each individual plan, thus being considered as expert plans. Two experienced dosimetrists and one senior oncologist at Zhejiang Cancer Hospital reviewed the plans and confirm that all the plans had achieved the best OAR sparing.
Basic characteristics of contours and plans in this study.
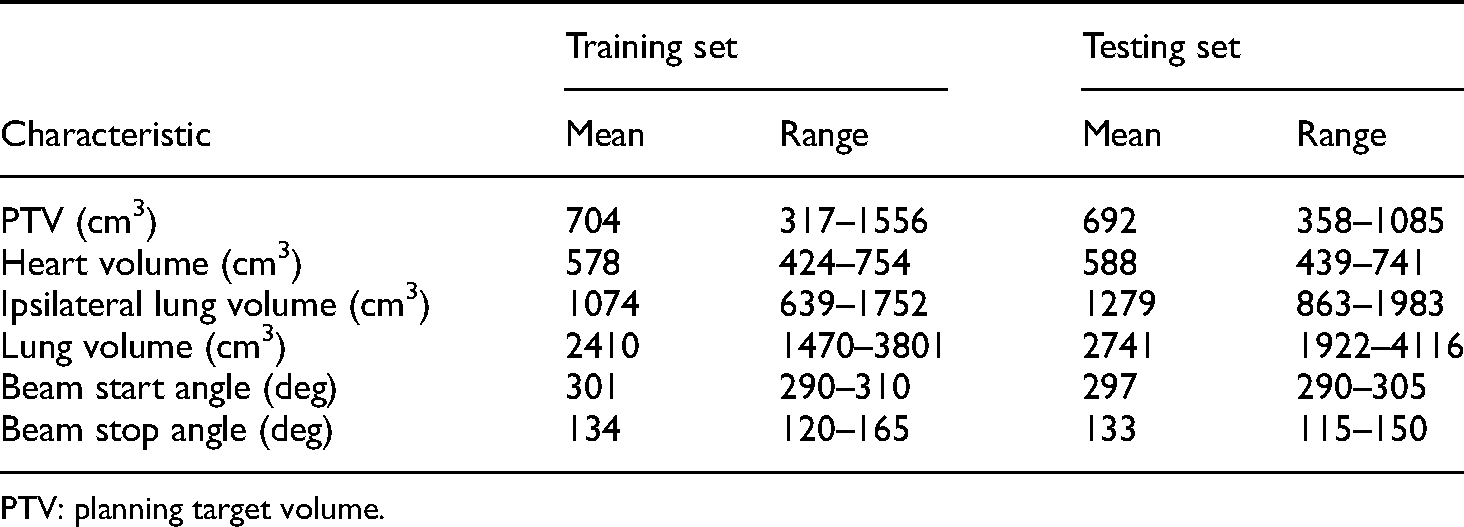
PTV: planning target volume.
Data preprocessing
The adopted FCN were trained using input CT grayscale images, ROI delineations, and the corresponding dose images. The CT images, ROIs, and dose files obtained from the treatment planning system were converted from the DICOM (Digital Imaging and Communications in Medicine) standard to arrays in Python. For the original CT images, the Hounsfield unit values ranging from −1024 to 3071 HU were normalized from 0 to 1. The ROI structures were also converted into array data. Each voxel was assigned to a specific value if the voxel belonged to the ROIs. The ROIs of PTV, ipsilateral lung, heart, whole lung, spinal cord, and body were represented by 1.000, 0.833, 0.667, 0.500, 0.333, and 0.167, respectively, whereas other voxels were represented by 0. The voxels belonging to multiple structures were assigned the maximum value. For all the 60 cases, the maximum planning doses remained below 60 Gy, and hence the dose array was divided by 60 Gy for normalization. Each of the CT, ROI, and dose arrays were interpolated into 64 × 256 × 256 matrices by the cubic method.
We evaluated 2D and 3D prediction models in this study. In the 2D models, predictions were completed slice-by-slice. In the 3D models, each case was represented by one 3D array. There were 50 randomly chosen arrays in the training set and the remaining 10 arrays in the testing set. For each model, the input data were trained in three cases: (a) CT image arrays as a single-channel input; (b) ROI arrays as a single-channel input; and (c) CT image and ROI arrays as a multichannel input. When either the CT images arrays or ROI arrays were used as input data, the channel of the input array was set to 1, and when the two arrays were used as input data, two channels were used to represent the data. Details of the training data are listed in Table 2.
Specifications of training data models.
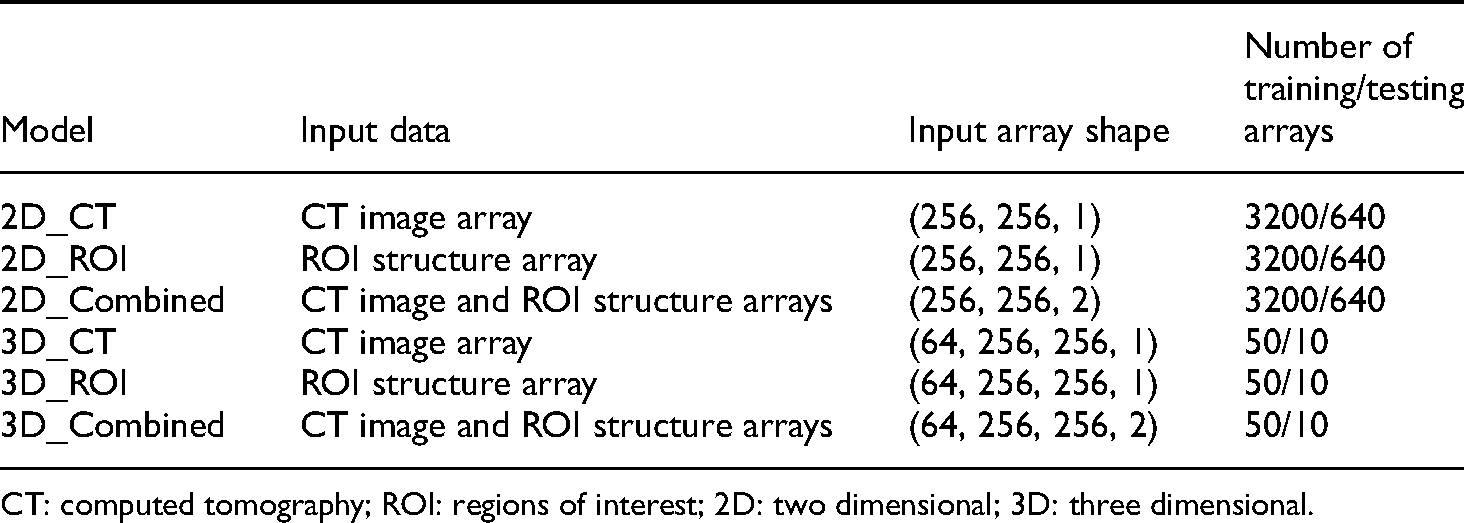
CT: computed tomography; ROI: regions of interest; 2D: two dimensional; 3D: three dimensional.
Prediction model using U-Net
We used the U-Net FCN to predict dose distributions, as it has been successfully applied in medical image segmentation. U-Net has an upsampling stage with multiple feature channels to propagate context information to higher-resolution layers. 20 The implemented U-Net model was based on the network architecture reported by Ronneberger et al. 20 The end-to-end trainable FCN was able to automatically predict dose distributions using the framework shown in Figure 1.

Framework of dose distribution prediction using U-Net.
The 2D U-Net comprised 10 layers. The first four layers were composed of two 3 × 3 convolutions, each followed by a rectified linear unit (ReLu), and 2 × 2 max pooling with a stride of 1 per dimension to reduce the feature size. To capture information from a larger effective receptive field, we used a slightly dilated 3 × 3 convolutional kernel with valid padding. The fifth layer was composed of two 3 × 3 convolutions. Then, four upsampling layers composed of a concatenate and two 3 × 3 convolutions, each followed by a ReLu, were included. Finally, the tenth layer with one convolution retrieved the predicted dose array. The predicted dose arrays were then interpolated to the original resolution using the cubic interpolation method. The activation function of the convolution in the first nine layers was ReLu. Unlike the original architecture, we replaced sigmoid activation in the last layer by a linear activation function. The prediction loss function was defined by the mean squared error (MSE). Hence, the FCN handled regression rather than classification. The initial learning rate was 10–3 and adjusted by a factor of 0.1 every five epochs if the loss function remained constant. The limit of learning rate was 10–6.
For the 3D U-Net, operations such as 2D convolution, max pooling, and upsampling were replaced by their 3D counterparts. In addition, the batch size was 16 for the 2D model and 1 for the 3D model due to GPU memory capacity. For all the models, Adam optimization was adopted, and the same hyperparameters and architectures were employed for a fair comparison between input types and models.
Prediction and evaluation
A random split of 3200/640 images was used for training and testing the network. The test set was different from the training and validation sets. Ten-fold cross-validation was applied to the training set to assess the performance and stability of each model. For each fold, the training set was divided into 2880 training and 320 validation slices in the 2D model, whereas in the 3D model, the division was 45 training and five validation cases. The model weights that minimize the validation loss were used for external validation. After every fold was trained and the loss function converged, the model weights were used to evaluate the test set.
For dose prediction quality, the mean percentage difference (MPD) was determined for the PTV, heart, whole lung, ipsilateral lung, and spinal cord. This difference is defined for a ROI as follows:
Furthermore, the Dice similarity coefficient (DSC) was computed for 80% and 100% of the prescription dose area. At a given dose, the DSC is defined as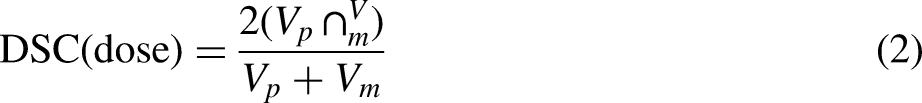
The gamma index was also used to measure dose distribution similarity.25,26 The index between a predicted dose-to-voxel 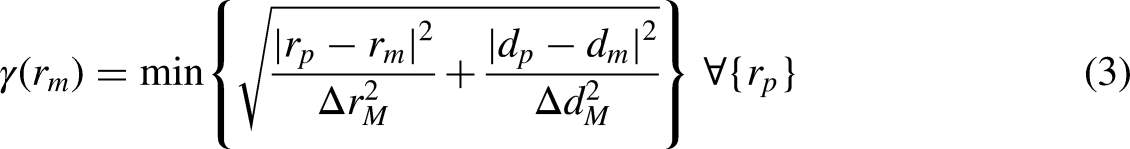
Statistical analyses
Statistical analyses of prediction results were performed using the Wilcoxon rank test using SPSS v21 (IBM, NY, USA). A p-value < 0.05 was considered significant.
Results
Figure 2 shows the loss function evolution for the different types of inputs. The ROI and combined inputs have a similar training and validation loss over epochs, while the loss of the CT input is higher in both the 2D and 3D models. In the 2D model, the combined inputs help to achieve a lower validation loss than the ROI inputs. In contrast, in the 3D model, the ROI inputs lead to the lowest validation loss. Overall, the 2D model converges faster and with less overfitting than the 3D model. Still, the 3D model achieves a lower validation loss than the 2D model under ROI inputs, but the 2D outperforms the 3D model under CT and combined inputs.

Training and validation loss functions for input models.
Table 3 lists the ROI doses including ground truth and predictions. All the models generated PTV D95 below the clinical plan. The 2D and 3D models with CT inputs and 3D models with combined inputs retrieved significantly less PTV Dmean than the ground truth. All the models suitably predicted the OAR dose, including the Dmean values for ipsilateral lung, heart, and lung, as well as Dmax for the PTV and spinal cord, as no significant difference was found from the ground truth.
Ground truth and predicted ROI input doses.
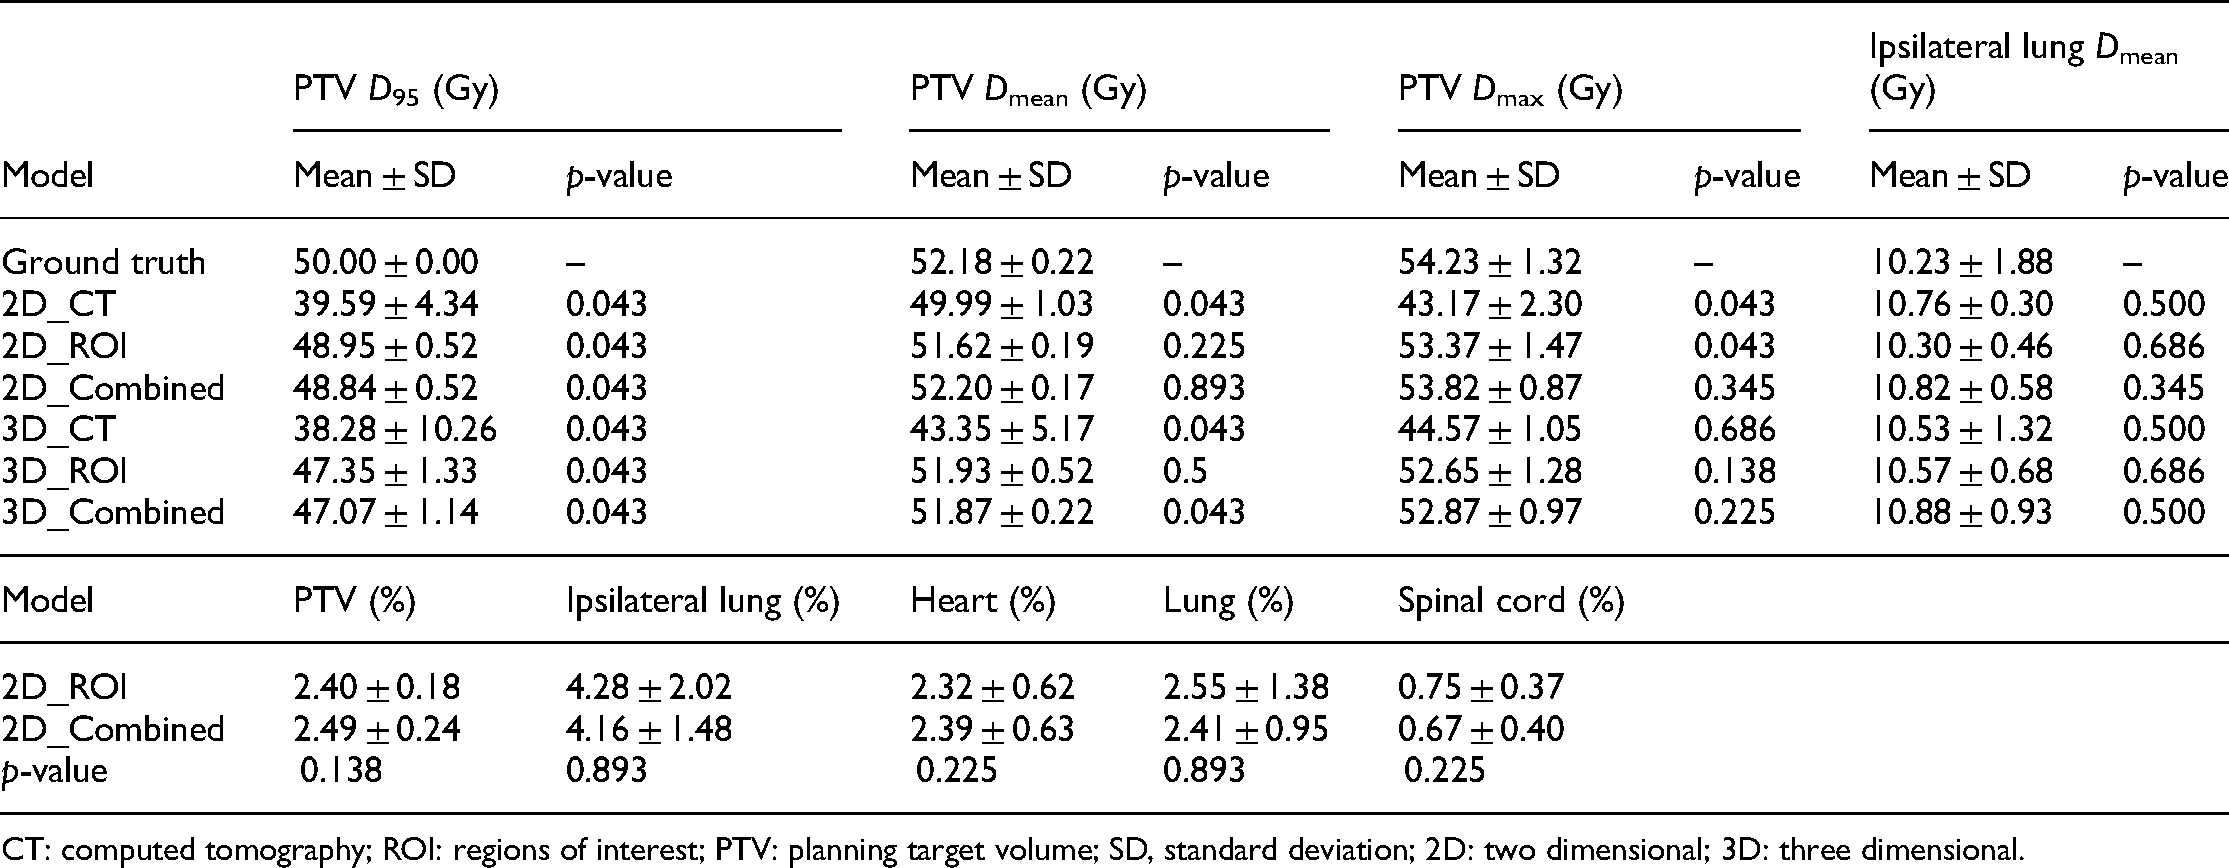
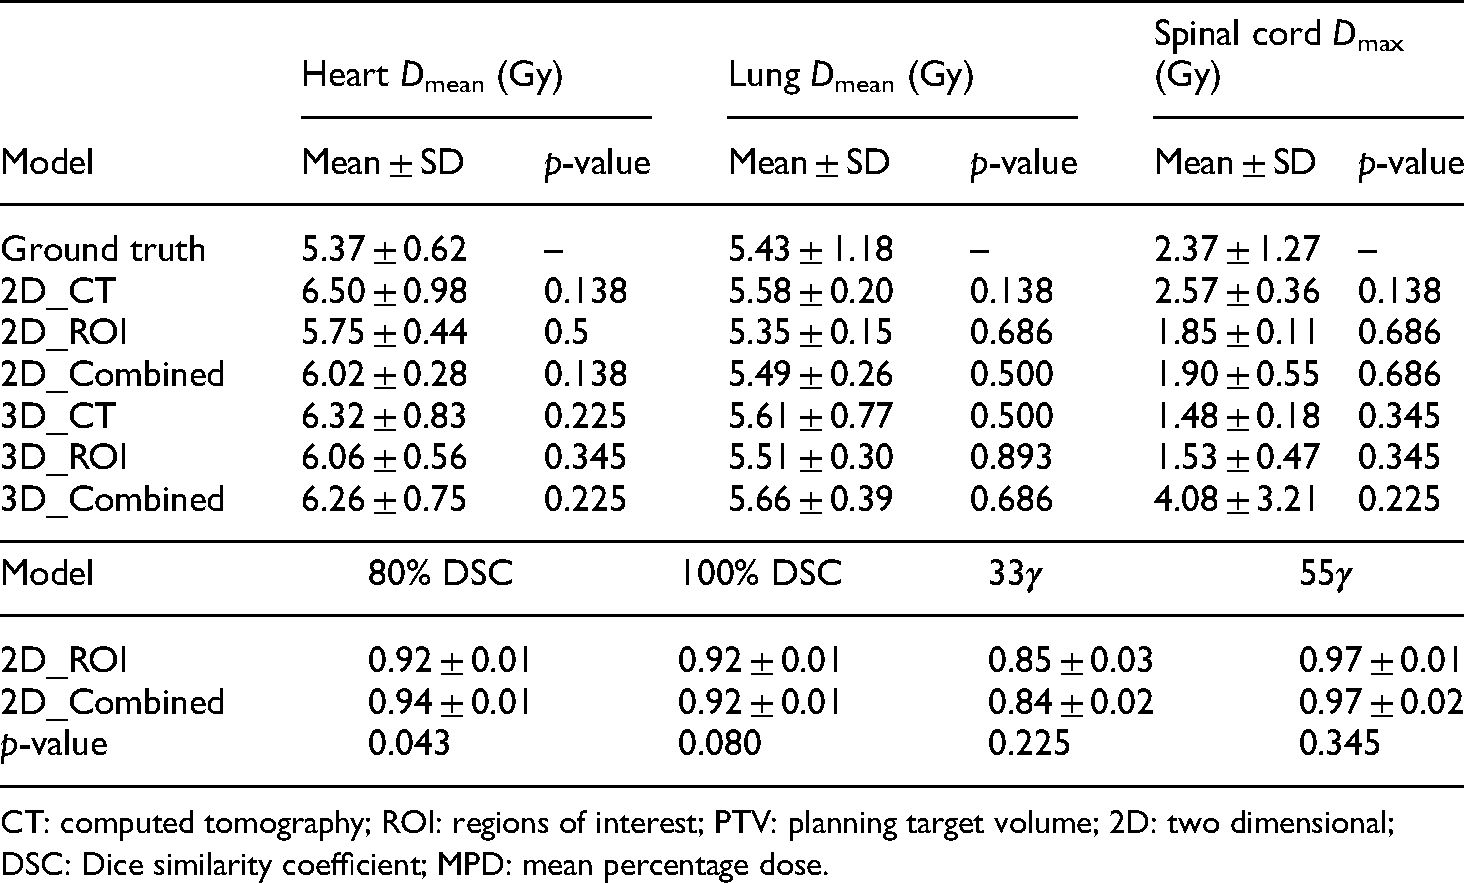
CT: computed tomography; ROI: regions of interest; PTV: planning target volume; SD, standard deviation; 2D: two dimensional; 3D: three dimensional.
Figure 3 shows the prediction errors on all the OARs and PTV from the test set. Using 3D CT inputs provides the worst prediction results, especially in PTV and the surrounding high-dose area. In addition, the 2D models have an overall lower prediction error than the 3D models.

Prediction error from the six input model in this study.
Using the 2D model either with ROI or combined inputs leads to better prediction accuracy than the other model and inputs. Table 4 lists the prediction accuracy of the 2D_ROI and 2D_Combine models. The 2D ROI inputs retrieved the best prediction regarding PTV and heart MPDs and 33γ, and the 2D combined inputs retrieved the best prediction regarding ipsilateral lung, lung, and spinal cord MPDs as well as 80% DSC. Moreover, the two models provide the same results for 100% DSC and 55γ. Statistically, the 2D combined inputs are more accurate for prediction regarding 80% DSC than the 2D ROI inputs.
Measures and statistic analysis from the 2D_ROI and 2D_Combined models in this study. The measures in the table are MPD for each ROI.
CT: computed tomography; ROI: regions of interest; PTV: planning target volume; 2D: two dimensional; DSC: Dice similarity coefficient; MPD: mean percentage dose.
An open-source implementation of U-Net based on the Keras deep learning library was used in this study. 27 Training on 50 cases can take 2–3 h for 100 iterations on an NVIDIA GeForce GTX 1080 GPU with 11 GB memory. However, the execution time during testing is much faster. On the 10 cases from the test set, the processing time for each volume was 6–22 s per stage depending on the size of the candidate regions.
Discussion
We evaluated six types of inputs for left-sided breast cancer. Although CT images without contouring can retrieve patient-specific dose distributions for radiotherapy, using ROI delineations with a unique label for PTV to serve as input improves the prediction accuracy. Moreover, combining CT images and delineated ROIs can further improve accuracy.
For CT image, ROI, and combined inputs, we tested 2D and 3D input models. It can be expected that prediction using 2D models can cause more errors, particularly in slices at the superior and inferior PTV edges, compared to 3D models.15,16 However, we found that the proposed FCN with 2D inputs retrieved an overall higher performance (p < 0.05). Figure 4 shows an example of the error between predicted dose and ground truth in the last slice of superior and inferior PTV edges. All the models predicted higher doses outside the PTV and lower doses inside it, especially along the PTV boundary. Hence, the FCN models should be improved to predict high-dose gradients in the boundary. The poorer 3D model performance in this study may be caused by the limited batch size. For 2D models, we tested different batch sizes (2, 4, 8, 16, 32, and 64), with 16 providing the best performance. However, the batch size was set to 1 in the 3D models due to GPU memory limitations, establishing a compromise between model accuracy and computing power. Hence, more memory allowing larger batch sizes may improve the performance of 3D over 2D models. Nevertheless, using the reported parameters, the 2D models outperformed their 3D counterparts, even in the superior and inferior PTV edges. We believe that the reason for this phenomenon is that when the plans were designed with a coplanar field, the geometry of 2D ROI has the greatest correlation with the dose distribution. The 3D input may not provide more valuable information, but added noise that interfered the prediction model. Figure 5 shows examples of dose color wash and dose–volume histogram for a patient from the test set. Visually, most 3D dose prediction models generate similar doses to the ground truth, with 2D and 3D CT input models having the lower dose coverage in PTV. All the models predicted comparable doses to OARs. The heart exhibited higher doses in all the models compared to the ground truth, which may represent scarce representative data in the training set or unsuitability of the models using the current FCN architecture.

Example of error between predicted dose and ground truth in the last slices of superior (top) and inferior (bottom) planning target volume (PTV) edges. Yellow represents predicted dose higher than the ground truth, whereas green represents predicted dose lower than the ground truth.
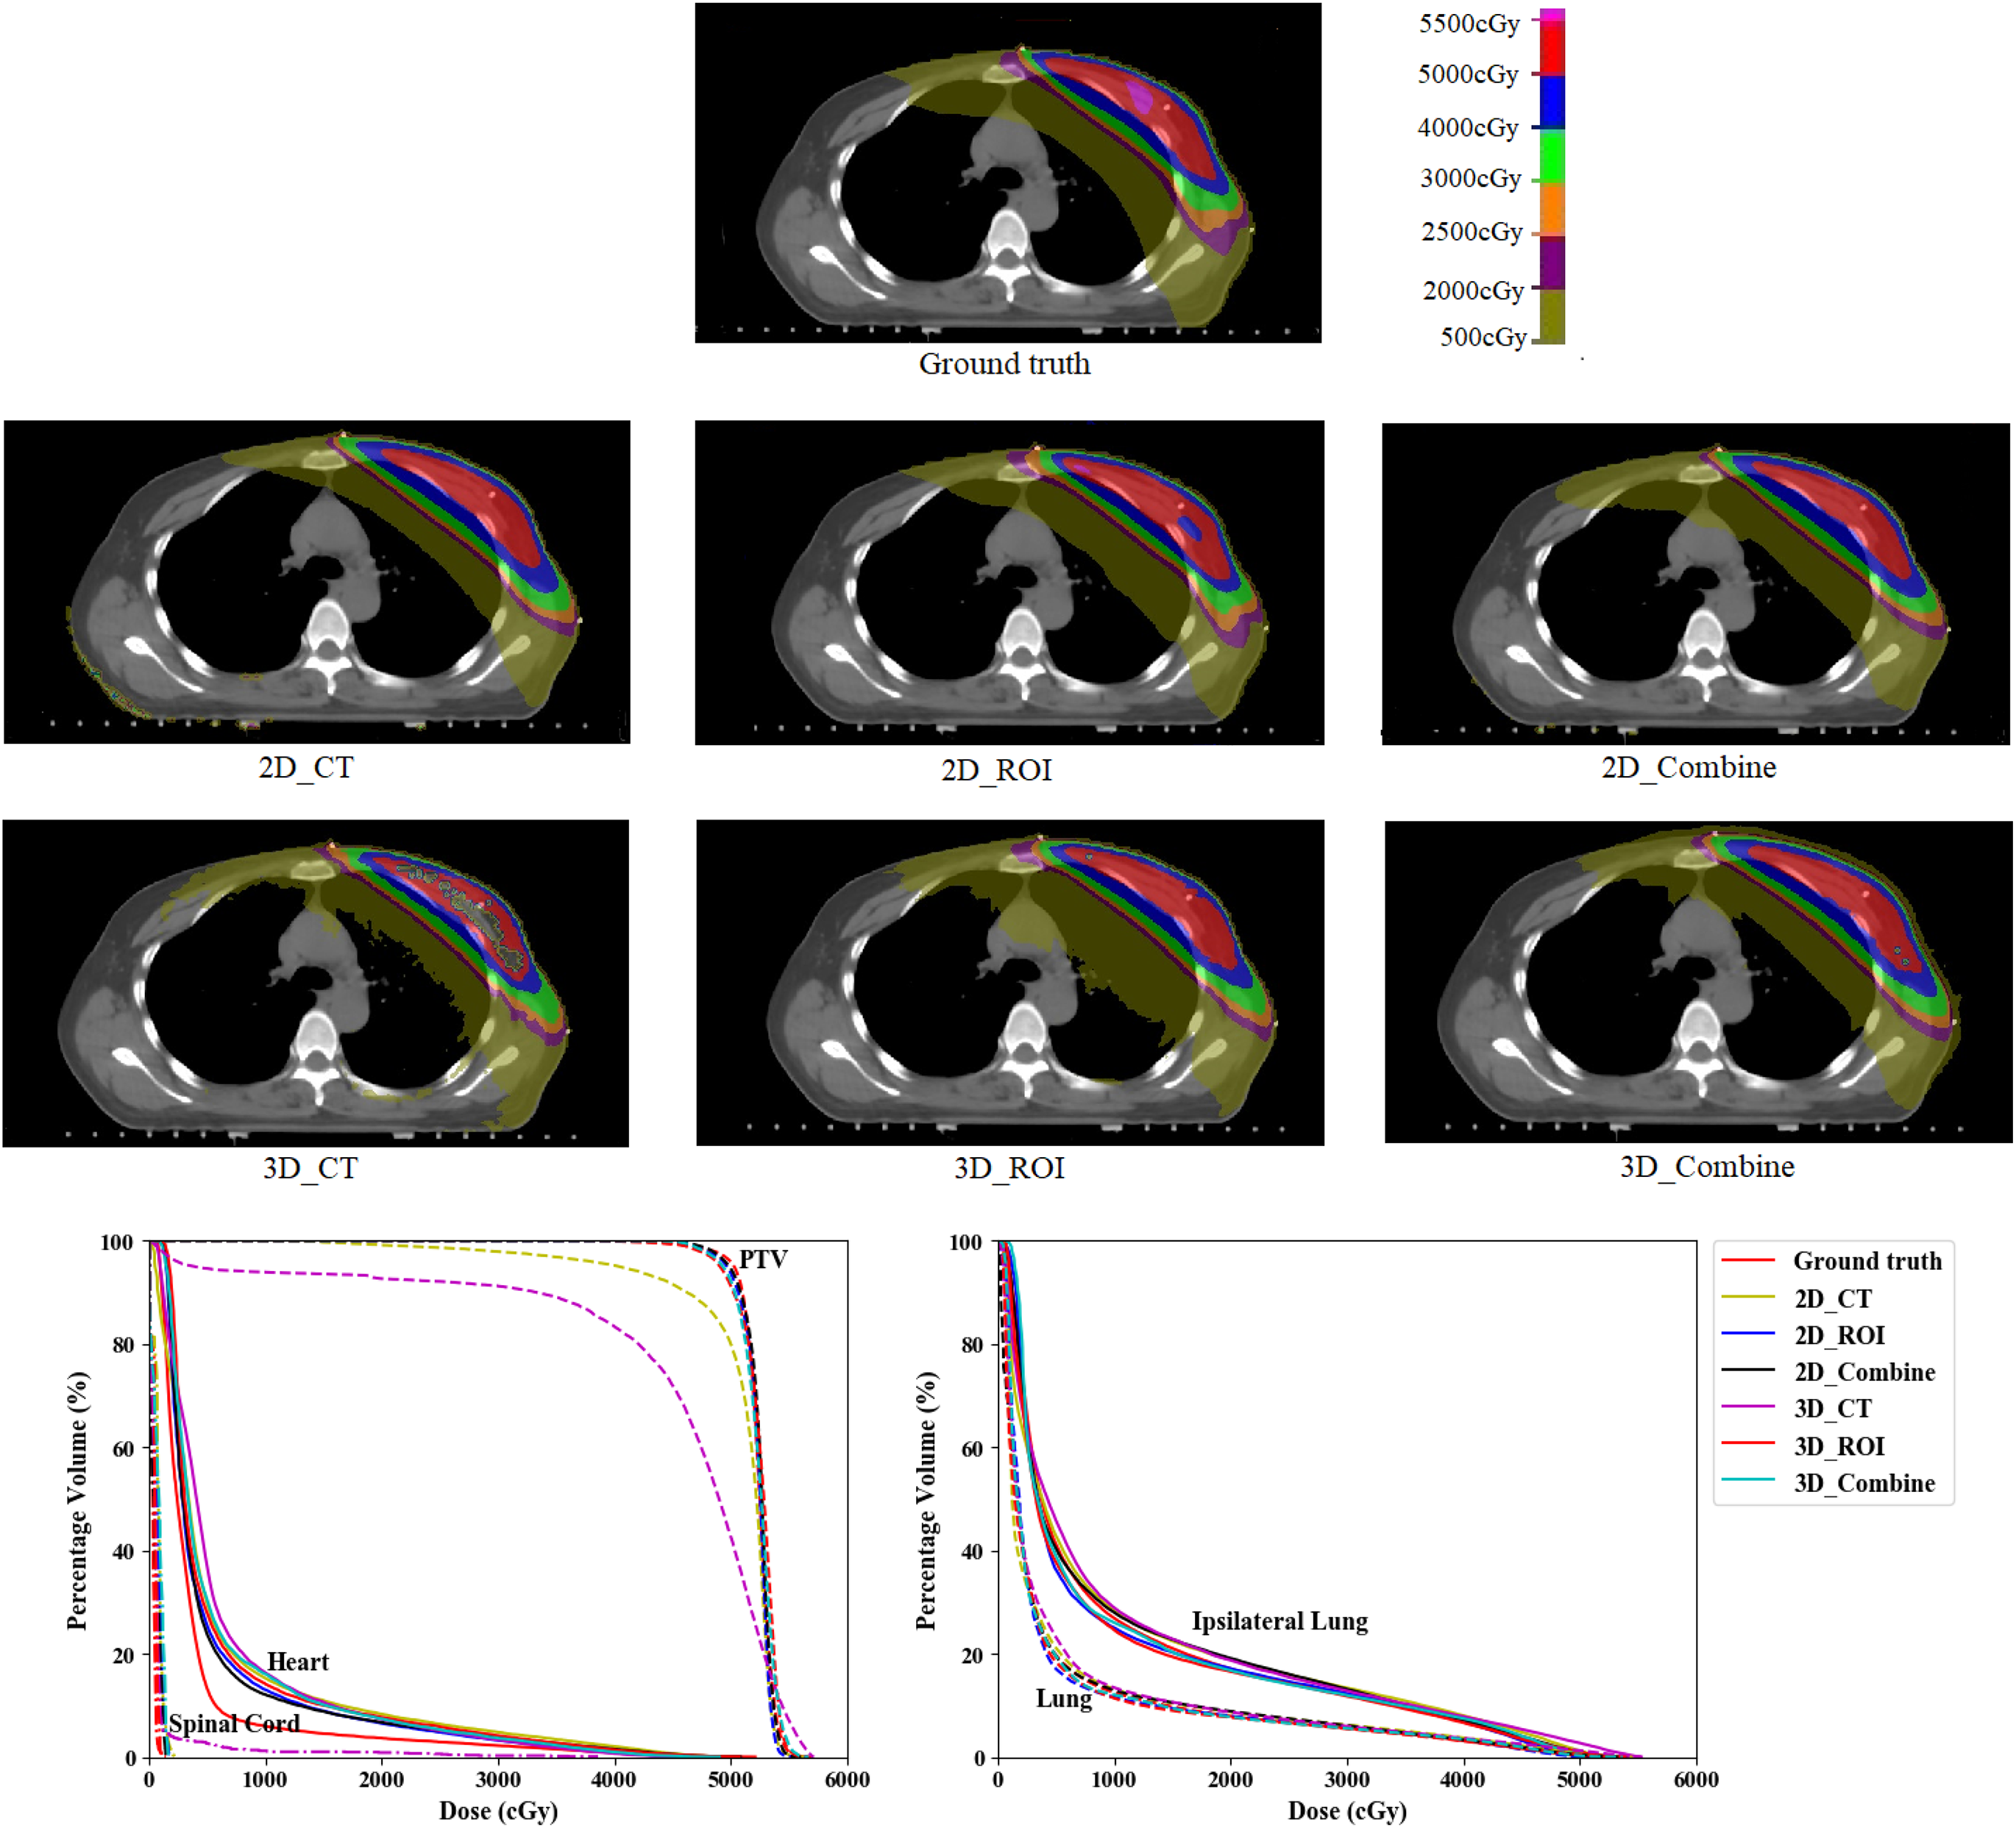
Example of predicted dose distribution generated with the different input types.
In this study, we predicted accurate volumetric doses for breast cancer patients using an FCN. McIntosh and Purdie used contextual atlas regression forests to predict the dose distribution for whole breast tangent intensity-modulated radiotherapy plans. 13 Their study reported the γ index at 80% of the prescription dose with a tolerance of 5% and 5 mm of 0.79 ± 0.08, and the DSC by thresholding the distribution at 80% of the prescription dose was 0.86 ± 0.05. Bai et al. 28 predicted dose distribution for left breast cancer using deformable image registration. Their study reported γ index at 80% of the prescription dose with a tolerance of 5% and 5 mm of 0.84 ± 0.10, and the DSC by thresholding the distribution at 80% of the prescription dose was 0.87 ± 0.05. Although the different patient datasets and treatment protocols prevent direct comparison with our study, we demonstrated the feasibility of accurately predicting dose distributions for breast cancer treatment. Unlike studies on head-and-neck and prostate cancer with identical beam arrangements,12,15–17 the beam angles for breast cancer are patient-specific, and we verified that the FCN approach is robust to slight changes in beam angles.
Various limitations of this study remain to be addressed. First, we considered data from only 60 patients, which may be insufficient for deep learning. The FCN model can become more robust and accurate with larger training sets. Second, we only used left-sided breast cancer data. Still, radiotherapy is used in many sites for cancer treatment, and the extension of our results to other sites, such as head, neck, and prostate, remains to be investigated. Third, we focused on the influence of input data for dose prediction rather than on the network structure, thus using the same hyperparameters for every input type. Adjusting the hyperparameters according to the input type may improve accuracy.
In future work, we will include more patient data to confirm the generality of our findings. We also plan to expand the study to several clinical conditions, including different treatment sites and tumor sizes. Moreover, the influence of the prediction results from different inputs should be investigated for different FCN architectures.
Conclusions
We propose FCN-based prediction of radiation dose for breast cancer and find that 2D models generally outperform 3D models under our experimental conditions. Although the radiotherapy dose distributions can be predicted directly from CT images without delineated ROIs, using ROIs or combinations of the inputs in 2D models retrieves the highest prediction accuracy of doses for left-sided breast cancer patients. In fact, CT images are complemented with ROI information for improved prediction performance.
Footnotes
Acknowledgments
The authors sincerely thank all study participants.
Declaration of conflicting interests
The authors declared no potential conflicts of interest with respect to the research, authorship, and/or publication of this article.
Funding
The authors disclosed receipt of the following financial support for the research, authorship, and/or publication of this article: This work was supported in part by the National Natural Science Foundation of China (12005190), the Zhejiang Province Key Research and Development Program (2019C03003), the Zhejiang Medical and Health Discipline Platform Project (2018ZD014), and the Zhejiang Basic Public Welfare Research Program (LSY19H180002).
Ethics approval
This study was carried out in accordance with the declaration of Helsinki and was approved by the Ethics Committee of Zhejiang cancer hospital with the following number: IRB-2020-2.