
Abstract
Mountain geophysical prospecting operations play an important role in the entire petroleum exploration field. Geophysical drill-bit is the main tool for mountain geophysical prospecting operations. Its hydraulic structure directly affects the downhole flow field and then affects the chip removal efficiency and drilling efficiency of the bit. At present, most of the scholars’ research is focused on Poly Diamond Crystalline bit, roller bit, etc., and the research on geophysical drill-bit is less, and most of them study the downhole flow field based on the change of single hydraulic structure. The primary objective of this research is to study the variation law of the downhole flow field under the interaction of multiple hydraulic structure factors. The drilling time and cuttings size of two geophysical drill-bits with different hydraulic structures are compared, and the key hydraulic structure factors are selected for analysis. Using numerical simulation software, take different levels of key hydraulic structure parameters and carry out orthogonal experiments. Under the interaction of various factors, study the flow field distribution in the flow channel, the downhole, and the annulus area of the shaft lining. The hydraulic structure of the geophysical drill-bit is closely related to the drilling speed and chip removal efficiency. When multiple hydraulic factors are changed, the diameter of the flow channel is the best when it is 10–12.5 mm, the inclination of the flow channel should be set as close as possible to the center of the downhole, and the length of the chip groove increases, the movement of cuttings is more stable. Variation law of downhole flow field under the interaction of multiple hydraulic factors is studied. This study provides a basis for the hydraulic structure design and optimization of the geophysical drill-bit.
Keywords
Introduction
At present, the global economy is in a stage of rapid development. Petroleum as the source of power, most areas are inseparable from the support of petroleum. However, petroleum exploration is not precise and comprehensive enough, especially in mountainous and hilly areas, which has led to an increase in exploration costs and demand for petroleum. Therefore, for mountain and hilly areas, mountain geophysical prospecting technology should be vigorously developed to improve the efficiency of petroleum geological exploration. The geophysical drill-bit is an important tool in mountain geophysical prospecting operations, and its function is to break the downhole rock. Increasing the rock-breaking efficiency of geophysical drill-bits can improve the petroleum exploration efficiency in mountainous and hilly areas in a certain sense.1−5
Over time, people have realized that the hydraulic structure of the drill-bit has a profound impact on the performance of the drill-bit during drilling. A good hydraulic structure can optimize the downhole flow field and improve the chip removal efficiency and drilling efficiency of the drill-bit. The poor hydraulic structure will lead to untimely cleaning of the bottom of the well, resulting in accumulation of cuttings and secondary fragmentation, reducing the service life of the drill-bit, and increasing the cost of geophysical prospecting. Therefore, studying the variation law of the downhole flow field under the interaction of multiple hydraulic factors is of great significance for guiding the hydraulic structure design of geophysical drill-bits.
Previously, domestic and foreign scholars have carried out a series of studies on the downhole flow field of various drill-bits. There are three main research methods: theoretical research, experimental research, and numerical simulation. Due to the complexity of the flow field, it is often difficult to achieve the desired results. The experimental method is limited by the experimental conditions and equipment, and cannot give a complete description of the downhole flow field, many data cannot be obtained through the experiment, which consumes a lot of manpower and material resources. Numerical simulation can be used to simulate the complex flow field of bit, and it is more economical and faster than experimental research.
In 2015, Wu et al. 6 carried out a numerical simulation on the flow field of different types of PDC bit nozzle angle combinations. The results show that the nozzle inclination angle has an obvious influence on the downhole flow field of PDC bit. Different nozzle angle combinations have different characteristics of the downhole flow field, and the effect of hydraulic rock cleaning is different. In 2016, Gan et al. 7 used FLUENT software to further analyze and study the horizontal inclination angle of the bottom jet hole and diffuser of reverse circulation bit. The results show that the optimized bit has higher drilling efficiency. In 2017, Tian et al. 8 used numerical simulation software to study the influence of nozzle diameter matching on the flow field characteristics of PDC bit. The results show that the downhole flow field of PDC bit is the best when the diameter of the central nozzle is 12.7 mm and the diameter of the peripheral nozzle is 8.74–11.13 mm. In 2018, Kuang et al. 9 studied the influence of flow channel shape on the rock carrying and cooling efficiency of PDC bits. The results show that the shape of the flow channel directly affects the rock carrying and cooling efficiency of the bit. In 2020, Cao et al. 10 optimized the hydraulic structure of the rotary PDC bit. The results show that the use of a nozzle with curvature can enhance the downhole cleaning effect in the cutter head area of the rotary PDC bit. In 2020, Chen et al. 11 used numerical simulation to study the depressurization capacity of the depressure-dominated Jet Mill Bit, the results show that with all other parameter values being constant, a lower dimensionless nozzle-to-throat-area ratio may result in higher depressurization capacity and better bottom hole cleaning. In 2020, Liu et al. 12 used ANSYS FLUENT to study the effects of the inclination angle of forwarding nozzles and standoff distance, the results show that the depth of jetted hole decreased, while the hole diameter increased with the inclination of the forward nozzle.
The numerical simulation method has been used by many scholars to study the downhole flow field of various bits. Through a series of investigations, it is found that most of the researches are based on the change of single hydraulic structure, and their effects on the downhole flow field, rock breaking efficiency, and chip removal efficiency are studied. However, the downhole flow field under the interaction of multiple hydraulic structures is rarely studied. Therefore, in the author’s previous work, 13 the best combination of hydraulic structure parameters is obtained by an orthogonal experiment. On this basis, the current work further studies the orthogonal experiment, under the background of the interaction of multi hydraulic structure parameters, to reveal the variation law of the downhole flow field.
Field test
Geophysical drill-bits and equipment
At present, two types of geophysical drill-bits are widely used in geophysical prospecting operations in the Sichuan and Chongqing region of China. As shown in Figure 1. The bit at the top of Figure 1 is named Type I geophysical drill-bit, and the bit at the bottom is named Type II geophysical drill-bit. Two types of drill-bits were used for geophysical prospecting in a sandstone-dominated formation near Baipozhai, Liangping County, Chongqing City. The material of the geophysical drill bits body is 22SiMnNi2CrMoA, the teeth of geophysical drill bits are made of hard alloy.
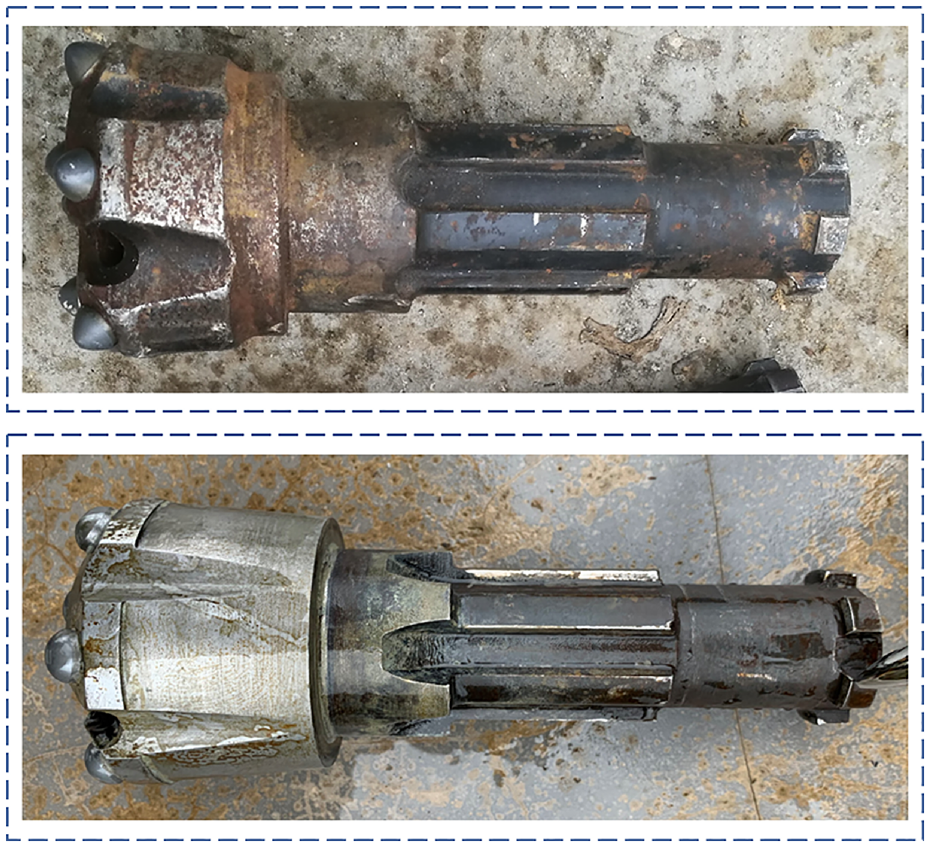
Two types of geophysical drill-bits.
The specific status of the geophysical equipment is shown in Figure 2. The left in Figure 2(a) is a special gasoline engine for a hydraulic lifting device, and the right is a special gasoline engine for air compressors. The left in Figure 2(b) is an air compressor, and the right is a hydraulic lifting device. The drilling type is vertical. The site operation diagram is shown in Figure 2(c).

The specific status of the geophysical equipment and the site operation. (a) special gasoline engine for hydraulic lifting device and special gasoline engine for air compressors, (b) air compressor and hydraulic lifting device, and (c) field drilling operation.
In this geophysical prospecting operation, 10 drill pipes (each drill pipe is 1.5 m long, as shown in Figure 3) were drilled with type I drill-bit. To ensure the similarity of the rock formations, at 2 m apart, 10 drill pipes were drilled with type II drill-bit.

The drill pipes.
Drilling time
During the drilling process, record the time required for each drill pipe to drill (start timing when the drill pipe is connected to the drill rig, and stop timing when the entire drill pipe is below the surface), the drilling time of two drill-bits is shown in Figure 4.

The drilling time of two drill-bits. The left is type I geophysical drill-bit, and the right is type II geophysical drill-bit.
As can be seen from the above figure, when using type I geophysical drill-bit, the average drilling time of each drill pipe is 9.49 min. When using type II geophysical drill-bit, the average drilling time of each drill pipe is 8.25 min. Type II is about 13% faster than type I.
Drilling cuttings size
Due to the limited downhole space, the drill-bit will repeatedly grind the broken cuttings during the rock-breaking process, so there is a large amount of relative movement between the cuttings and the drill-bit body. Discharging the cuttings in time can effectively improve the drilling efficiency and service life of the drill-bit. The larger the size of the cuttings, the better the cuttings can be discharged without too much grinding.
Collect 2KG of cuttings at the wellhead of type I drill-bit and type II drill-bit respectively. The sieving method is used to analyze the particle size of the two cuttings. After screening, the particle size distribution of the two cuttings is shown in Figure 5.
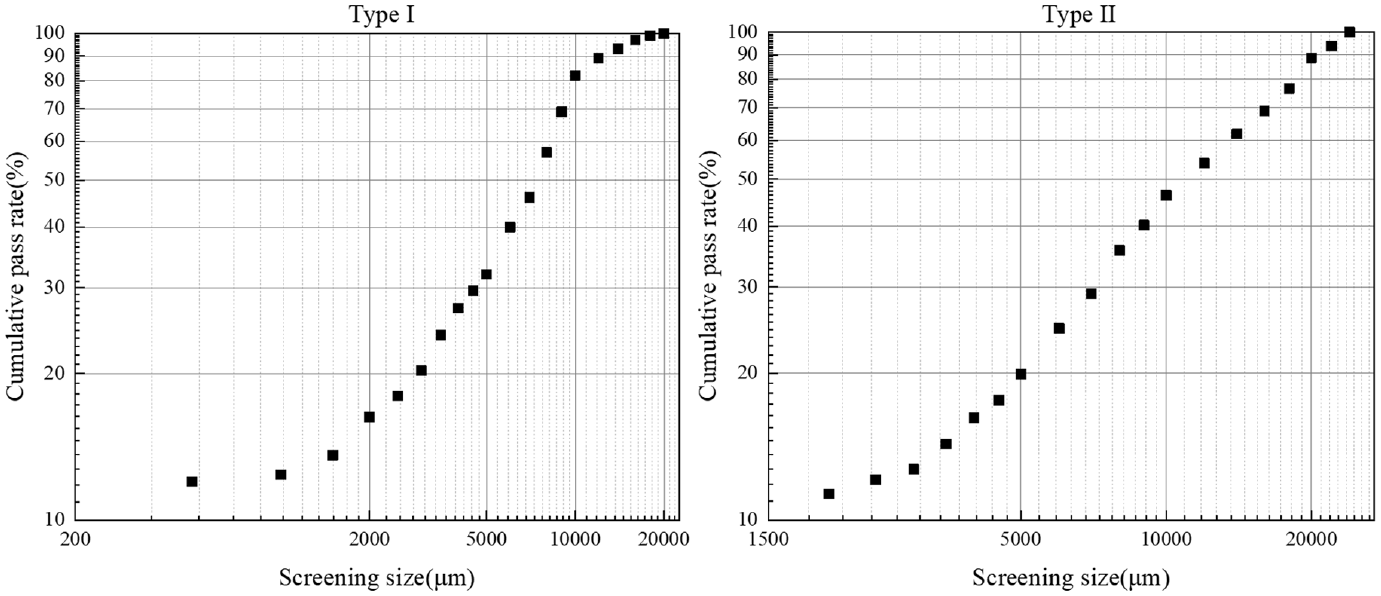
The particle size distribution of the two cuttings. The left is type I geophysical drill-bit, and the right is type II geophysical drill-bit.
The results show that the maximum particle size of cuttings drilled by type I drill-bit is close to 20,000 μm, while the maximum particle size of cuttings drilled by type II drill-bit is close to 26,000 μm. The largest cuttings drilled by type II drill-bit is about 30% larger than type I. The main distribution range of the size of the cuttings drilled by type I drill-bit is 3000–12,000 μm, the main distribution range of the size of the cuttings drilled by type II drill-bit is 6000–20,000 μm. Therefore, the size of the cuttings drilled by the type II drill-bit is larger. Two geophysical drill-bits with different hydraulic structures are shown in Figure 6.
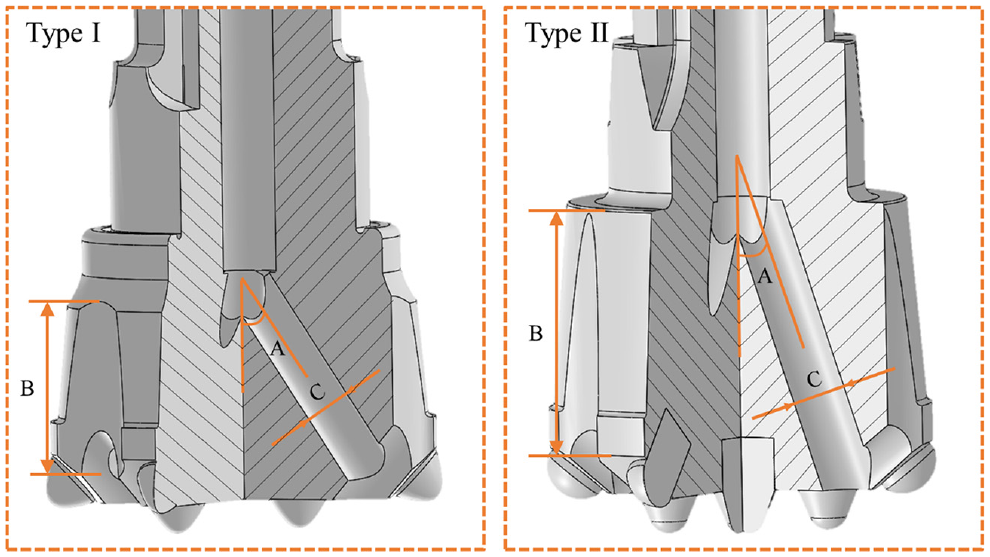
The comparison diagram of the key hydraulic structure of two drill-bits. The left is type I geophysical drill-bit, and the right is type II geophysical drill-bit.
Hydraulic structure comparison
Hydraulic structure parameters are the key factors affecting drilling efficiency and chip removal efficiency of geophysical drill-bit. The hydraulic structure parameters of type I drill-bit and type II drill-bit are quite different. Through literature research, chip groove length, flow channel inclination, and diameter are the key factors affecting the downhole flow field. The comparison diagram of the key hydraulic structure of the two kinds of bits is shown in the figure below. A represents flow channel inclination, B represents chip groove length, C represents flow channel diameter.
The specific parameters are shown in the Table 1 below:
The specific hydraulic structure of two types of drill-bits.

From the comparison of drilling time and drilling cuttings size, it can be concluded that:
The drilling time of type II drill-bit is significantly less than that of type I drill-bit;
The size of cuttings drilled by type II drill-bit is larger than the type I drill-bit.
It shows that the hydraulic structure design of the type II drill-bit is more reasonable, which can discharge the cuttings faster and improve the drilling efficiency. However, the hydraulic structure parameters of type II drill-bit are quite different from those of type I drill-bit, such as flow channel inclination, diameter, and so on. Therefore, it is extremely important to study the variation law of the drill-bit downhole flow field under the interaction of multiple hydraulic structure parameters.
Orthogonal experiment
Factor selection
The three key hydraulic structural parameters of the geophysical drill-bit are flow channel inclination, flow channel diameter, and chip groove length. A represents flow channel inclination, B represents chip groove length, C represents flow channel diameter.
Level determination
According to the hydraulic structure design parameters of type I and type II bits, three levels of A, B, and C are taken respectively. Table 2 is the factor level table.
Three hydraulic structure parameters and corresponding levels.

Experiment designment
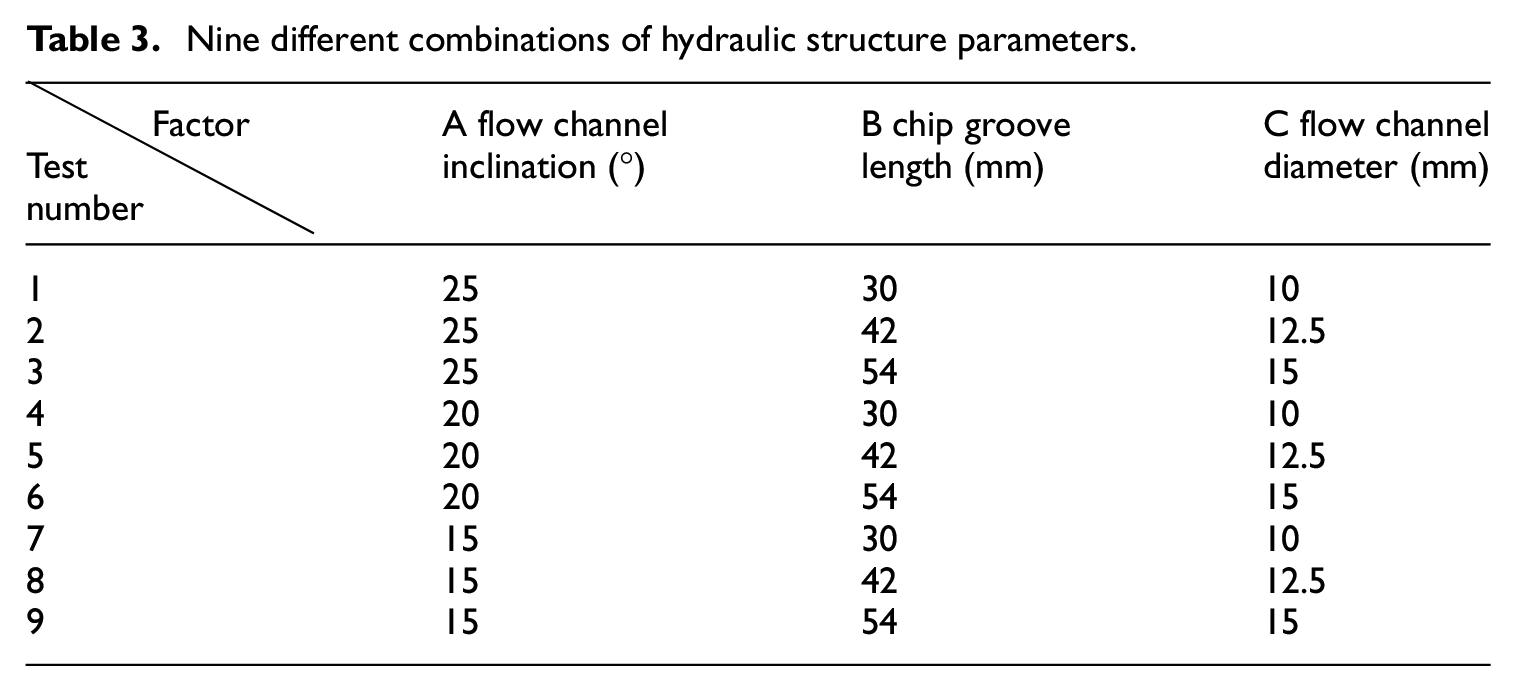
Choose the L9(34) orthogonal table. The test arrangements are shown in Table 3.
Nine different combinations of hydraulic structure parameters.
Carrying out physical modeling and numerical simulation for the selected nine sets of data.
Numerical simulation research
Theoretical model
Mass equation:

Momentum equation:

Energy equation:

State equation:


Turbulence model:


The above equations constitute the closed equations for solving the distribution of the flow field in the downhole of geophysical drill-bit. The definite solution of the equations is formed according to the actual working conditions, the corresponding boundary conditions, and initial conditions. Because the equations are nonlinear, the numerical method is used to solve it discretely in engineering. In this paper. Fluent is adopted to solve the nonlinear equations, and the finite volume method is adopted to discrete the solution domain. Before solving, the corresponding physical model of the bit’s downhole flow field should be established.14−16
3D model
Perform three-dimensional modeling on the nine groups of data, and extract the fluid computing domain through Boolean operations. Here take experimental group A1B1C1 as an example. Figure 7 shows the three-dimensional model and fluid computing domain of the experimental group A1B1C1.

The left is the three-dimensional model of the experimental group A1B1C1, the right is the fluid computing domain of the experimental group A1B1C1.
Boundary conditions
According to the field conditions of geophysical exploration, the boundary conditions of the model are as follows:
(1) Computational domain setting: In the steady-state calculation, due to the rotation effect of the geophysical drill-bit, the rotating inertia force is taken into account, and the rotating speed of the fluid calculation field is set as 120 rpm;
(2) Entrance boundary condition: Since the compressibility of air needs to be considered, select the pressure inlet boundary and set the relative inlet pressure as 0.5 MPa (set the ambient pressure to one atmosphere), Inlet turbulence parameters are set as inlet turbulent kinetic energy k and turbulent dissipation rate


In the formula, turbulence intensity
(3) Outlet boundary conditions: Set the pressure outlet boundary, the outlet pressure is 0 MPa (set the ambient pressure to one atmosphere), at the same time, specify outlet turbulent kinetic energy k and turbulence dissipation rate
(4) Wall boundary conditions: Fixed wall, the no-slip condition is adopted for the wall face. The relative velocity of the geophysical bit (InWall) is 0 rpm, that is, the velocity of the bit is 120 rpm. The absolute shaft surface (OutWall) velocity is 0 rpm, that is, shaft lining is static.
Set the number of calculation steps to 10,000, and import the calculation results of nine groups of data into CFD-POST for post-processing, and then carry out the comparative analysis.
Comparative analysis of downhole flow field
During the drilling process of the geophysical drill-bit, high-pressure gas enters the internal flow channel of the drill bit through the drill pipe, and then ejects from the flow channel to impact the downhole, removes the bottom rock debris, and carries it to the annulus area between the bit and the wall, and finally reaches wellhead. The whole process constitutes the downhole flow field of the geophysical drill-bit. By comparing and analyzing the flow field of nine sets of data in the flow channel, downhole and the annulus area of the shaft lining, the downhole flow field of the geophysical drill-bit can be better optimized, and the appropriate hydraulic structure parameters can be found, to provide a basis for the design of the hydraulic structure of the geophysical drill-bit in the future.
Comparison in the flow channel
Before the high-pressure gas reaches the bottom of the well, it must be compressed and turned through the flow channel. By analyzing the flow field distribution in the flow channel, we can understand the deceleration, backflow, and even vortex of the gas, to optimize the inclination, and diameter of the flow channel.
The velocity vector diagram in the flow channel
Intercept the velocity vector diagram of the flow channel inside the geophysical drill-bit, and arrange the nine sets of experimental data into three groups according to the flow channel diameters C1, C2, and C3. The C1 group is A1B1C1, A2B3C1, A3B2C1, as shown in Figure 8.

The velocity vector diagram of the flow channel. From left to right are A1B1C1, A2B3C1, A3B2C1.
It can be seen from the figure that when the diameter of the flow channel is C1, there is almost no backflow and vortices in the flow channel. At the exit of the flow channel, the above three groups maintained high flow rates.
The C2 group is A1B2C2, A2B1C2, A3B3C2, their velocity vectors are shown in Figure 9.
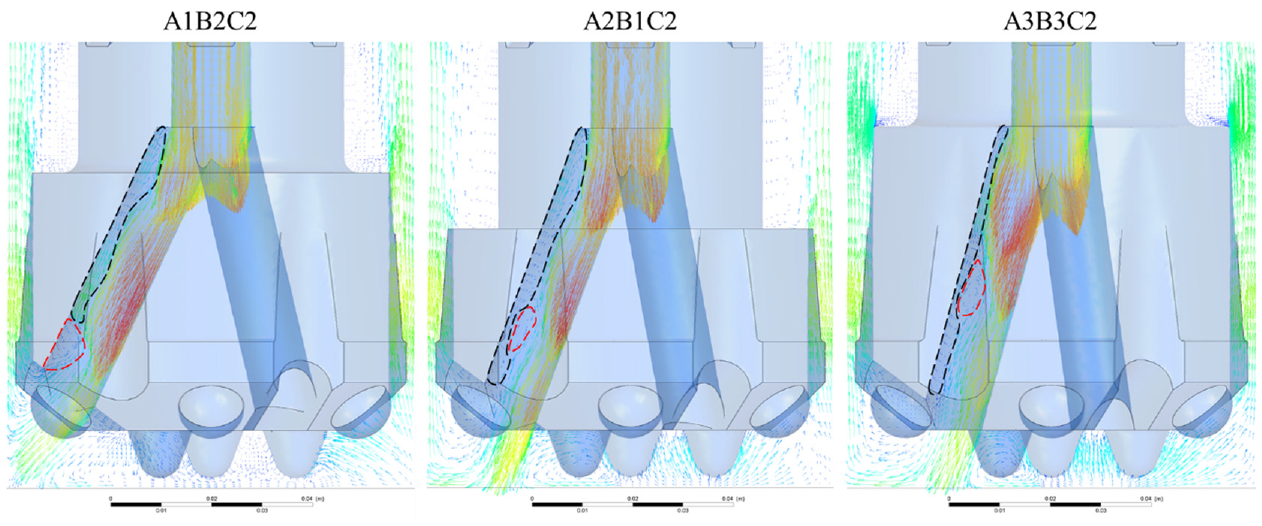
The velocity vector diagram of the flow channel. From left to right are A1B2C2, A2B1C2, A3B3C2.
In the figure, the black dashed line is the backflow layer, and the red dashed line is the vortex region. All three sets of experimental data have a backflow layer and vortex region in the flow channel. The backflow layer occupies the space in the flow channel, and the velocity direction is from bottom to top, which greatly weakens the gas flow velocity. The existence of the vortex region causes the gas to circulate repeatedly in the flow channel, and cannot directly reach the bottom of the well, which affects the gas flow rate.
The C3 group is A1B3C3, A2B2C3, A3B1C3, their velocity vectors are shown in Figure 10.
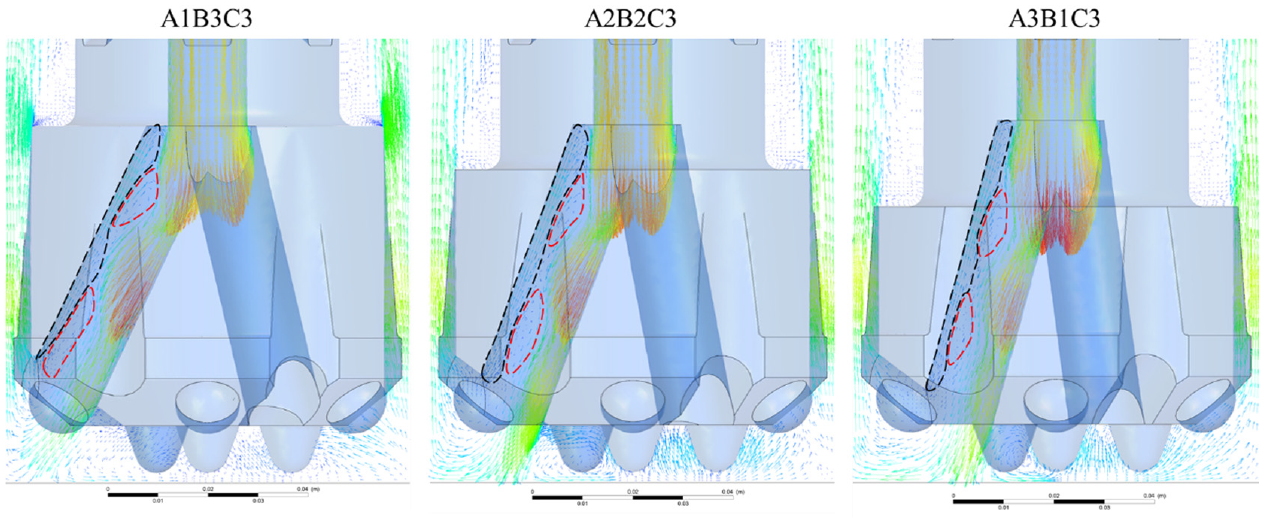
The velocity vector diagram of the flow channel. From left to right are A1B3C3, A2B2C3, A3B1C3.
As in Figure 4, the black dashed line is the backflow layer, and the red dashed line is the vortex region. All three sets of experimental data have a flow channel diameter of 15 mm. Due to the increase of the diameter of the flow channel, the coverage area of the backflow layer is larger than that of the C2 group. At the same time, there are two vortex regions in the flow channel of the three sets of experimental data, which greatly affects the flow velocity of the gas and causes turbulence.
From the above analysis, it can be concluded that the larger the diameter of the flow channel, the more likely the backflow layer and the vortex region appear in the flow channel, and the more easily the airflow is decelerated and disordered.
The velocity graph in the flow channel
In each bit flow channel, every 1mm from top to bottom, measure the gas flow velocity, draw a velocity graph, and take the average value. According to the inclination of the flow channel, it is divided into three groups: A1, A2, and A3. The A1 group is A1B1C1, A1B2C2, A1B3C3. The A2 group is A2B3C1, A2B1C2, A2B2C3. The A3 group is A3B2C1, A3B3C2, A3B1C3. As shown in Figures 11−13.
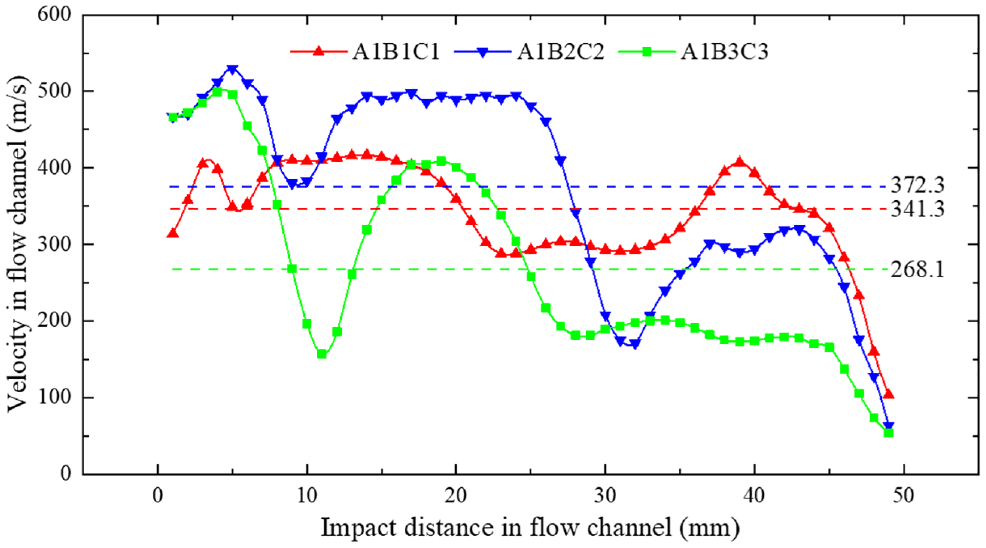
Comparison curve of flow velocity in the flow channel. Red is A1B1C1, blue is A1B2C2, and green is A1B3C3.

Comparison curve of flow velocity in the flow channel. Red is A2B3C1, blue is A2B1C2, and green is A2B2C3.

Comparison curve of flow velocity in the flow channel. Red is A3B2C1, blue is A3B3C2, and green is A3B1C3.
It can be seen from the above three figures that when the diameter of the flow channel is C1, which is the red curve in the figure above, due to the small diameter of the flow channel, when the gas enters the lower channel of the bit from the upper part of the bit, it is greatly hindered. Therefore, the initial velocity is low at 0–5 mm on the horizontal axis. When the diameter of the flow channel is C3, which is the green curve in the figure above, due to the larger diameter of the flow channel, backflow and vortices are likely to occur in the flow channel, resulting in a lower average flow velocity in the flow channel. When the diameter of the flow channel is C1, C2, the average flow velocity in the flow channel is high.
Therefore, the diameter of the flow channel should not be too large. Excessive flow channel diameter will lead to the occurrence of backflow and vortex, which will greatly affect the speed of gas reaching the bottom of the well and weaken the chip removal ability. If the diameter of the flow channel is too small, the gas will decelerate seriously during the initial stage of entering the flow channel.
Comparison in the downhole
The direction and velocity of downhole overbank flow are important parameters to characterize the ability of downhole chip removal ability. The flow direction of the ideal downhole flow field should be from the downhole center to the surrounding wall of the shaft lining. Minimize the occurrence of vortices to prevent the accumulation of chips. At the same time, increase the velocity of downhole overbank flow. Therefore, according to these points, the direction and velocity of the downhole overbank flow of the nine sets of experimental data are compared and analyzed.
The velocity vector diagram in the downhole
Intercept the downhole velocity vector diagram of the geophysical drill-bit, and divide the nine sets of experimental data into three groups A1, A2, and A3 based on the inclination of the flow channel. The A1group is A1B1C1, A1B2C2, A1B3C3. Their velocity vector diagram is shown in Figure 14.
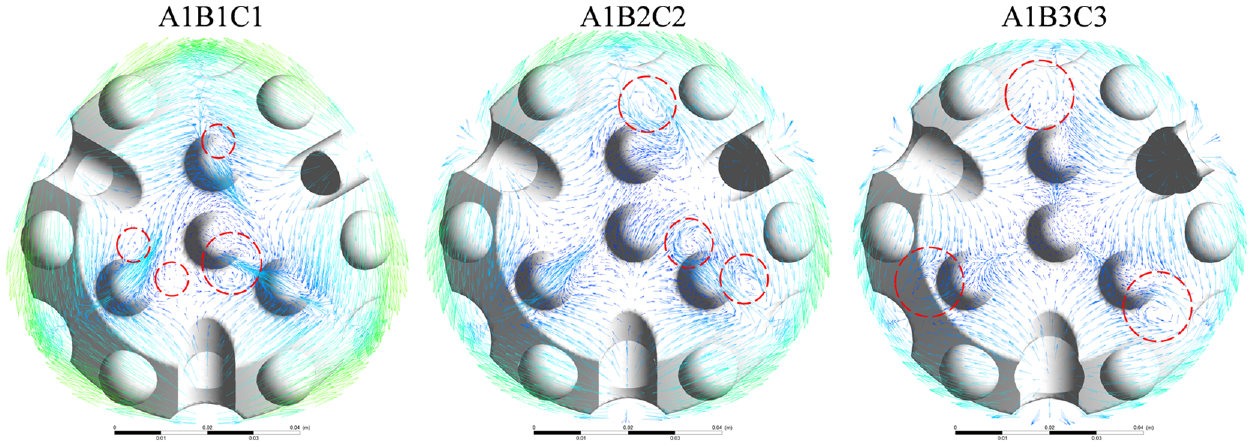
The downhole velocity vector diagram. From left to right are A1B1C1, A1B2C2, A1B3C3.
From the figure above, it can be seen that the red dotted line circle is a vortex, and the downhole flow field of the three groups of data all has different degrees of the vortex. The vortex will cause the rock chips to circulate repeatedly around the bottom of the well and be repeatedly ground by the teeth, reducing drilling efficiency and chips removal efficiency. Due to the large inclination of the flow channel, the velocity vector direction of the gas after it reaches the bottom of the well is not from the center of the downhole to the surrounding wall of the shaft lining but circulates along the wall of the well, and the chips at the bottom of the well cannot be well disposed to the surrounding, resulting in a great reduction in the chips removal efficiency.
The A2 group is A2B3C1, A2B1C2, A2B2C3. The A3 group is A3B2C1, A3B3C2, A3B1C3. Their downhole velocity vector diagrams are shown in Figures 15 and 16 respectively.
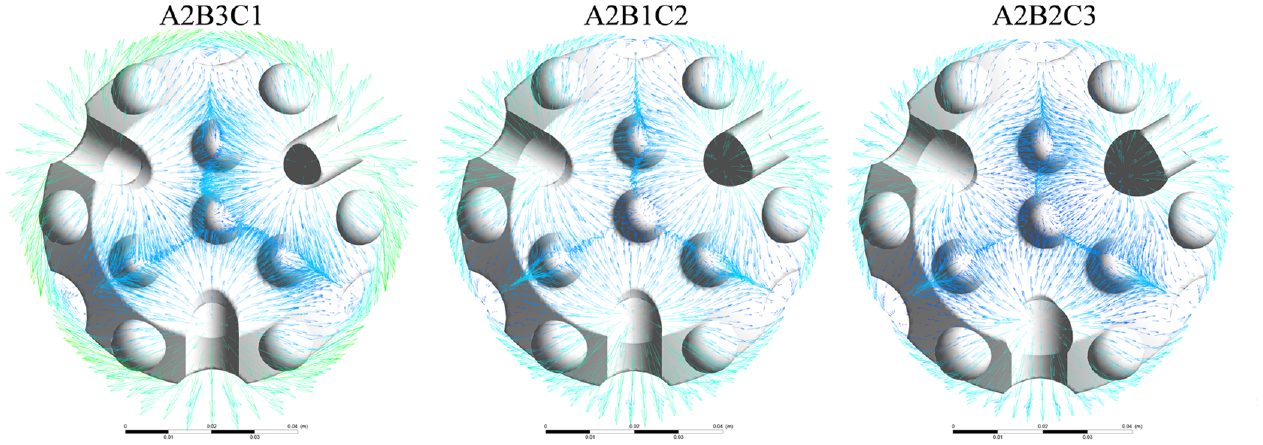
The downhole velocity vector diagram. From left to right are A2B3C1, A2B1C2, A2B2C3.

The downhole velocity vector diagram. From left to right are A3B2C1, A3B3C2, A3B1C3.
Observing the two figures above, it can be seen that when the inclination of the flow channel is A2, A3, the flow field is distributed regularly, and no vortex appears at the downhole. At the same time, the velocity direction is mainly from the outlet of the flow channel to the shaft lining. Only a small area in the center of the downhole formed a stagnation zone due to the collision of three streams of gas. The stagnation zone of group A3 is smaller than that of group A2.
Therefore, from the above analysis, it can be obtained that an excessively large inclination of the flow channel easily leads to the occurrence of vortices and affects the stability of the downhole flow field. At the same time, because the velocity direction does not point to the shaft lining, it will cause the rock chips to circulate repeatedly at the downhole, reducing the chip removal efficiency and drilling efficiency.
The velocity in the downhole
After the gas is ejected from the three flow channels to the downhole, they will collide with each other and form a low-velocity watershed. Low-velocity watersheds slow down the movement of chips. Therefore, the downhole flow velocity diagram of nine groups of data was intercepted, and the area with a velocity <40 m/s was marked, and the size of the low-velocity watershed was observed to understand the advantages and disadvantages of the downhole flow field of each group of data. Still based on the inclination of the flow channel, the nine groups of data are divided into three groups: A1, A2, and A3. First look at the A1 group, as shown in Figure 17.

The area of downhole low-velocity watershed. From left to right are A1B1C1, A1B2C2, A1B3C3.
The total area of the low-velocity watershed of A1B1C1 accounts for 23% of the downhole area. The total area of the low-velocity watershed of A1B2C2 accounts for 37% of the downhole area. The total area of the low-velocity watershed of A1B3C3 accounts for 38% of the downhole area. All three sets of data formed low-velocity watersheds in the central area of the downhole, causing chips to accumulate here and the teeth of the drill-bit to be repeatedly ground. It not only reduces the bit life but also increases the drilling time and cost.
Groups A2 and A3 are shown in Figures 18 and 19, respectively.

The area of downhole low-velocity watershed. From left to right are A3B2C1, A3B3C2, A3B1C3.

The area of downhole low-velocity watershed. From left to right are A1B1C1, A1B2C2, A1B3C3.
When the inclination of the flow channel is A2, the proportions of low-velocity watersheds are 4%, 6%, and 8%. When the inclination of the flow channel is A3, the proportions of low-velocity watersheds are 3%, 1.5%, and 2%, respectively. Compared with Figure 12, the area of the low-velocity watershed in groups A2 and A3 is much smaller. This means that the smaller the inclination of the flow channel, the lower the low-velocity watershed at the bottom of the well, and the less likely it is to accumulate rock chips at the downhole.
Make a circle with the center of the wellbore as the center and 16 mm as the radius. The average velocity in the circle and the average velocity at the bottom of the well were measured and plotted, as shown in Figure 20.
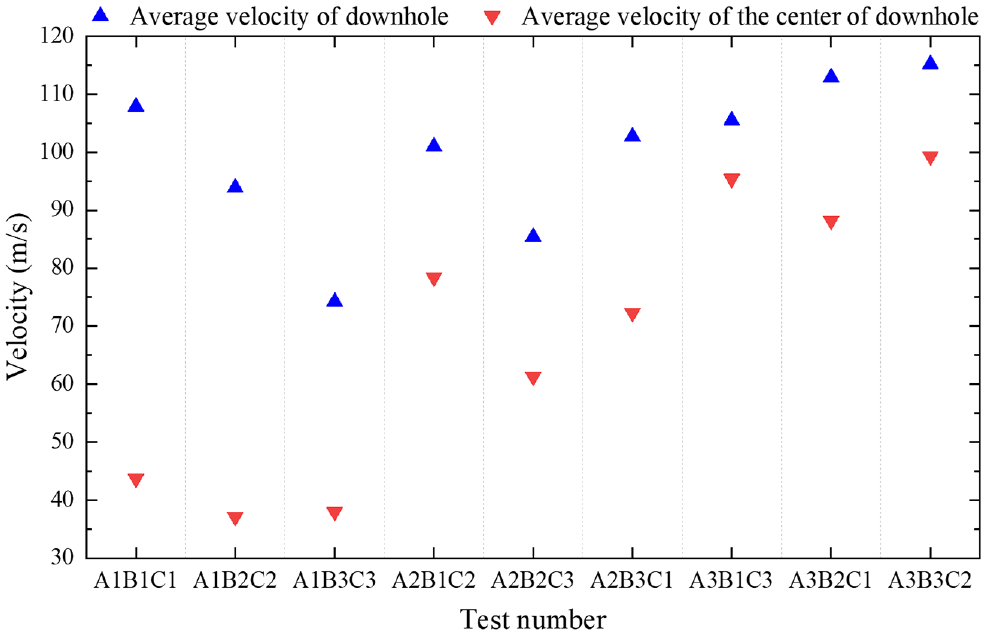
The average velocity of downhole and the average velocity of the center of downhole.
It can be seen from the figure that when the inclination of the flow channel is A1, the average flow velocity in the center of the downhole is very low, which means that the chips in the downhole center are in a low-velocity stagnation area and it is difficult to be quickly discharged. When the inclination of the flow channel is A3, the average flow velocity of the center of the downhole is above 80 m/s, and the overall average flow velocity is also above 100 m/s. The chip removal velocity is fast and the efficiency is high.
Comparison in the annulus area of the shaft lining
The streamline diagram indirectly reflects the trajectory of the chips during the actual drilling process. After the gas exits the chip groove through the downhole, it reaches the annulus of the shaft lining. By comparing the streamline diagram of the annulus area of the shaft lining and observing the degree of disorder of the lines, the stability of chips migration can be understood.
Intercept the streamline diagram of the geophysical drill-bit, and divide the nine sets of experimental data into three groups B1, B2, and B3 based on the length of the chip groove. The B1 group is A1B1C1, A2B1C2, A3B1C3. The streamline diagram of group B1 is shown in Figure 21.
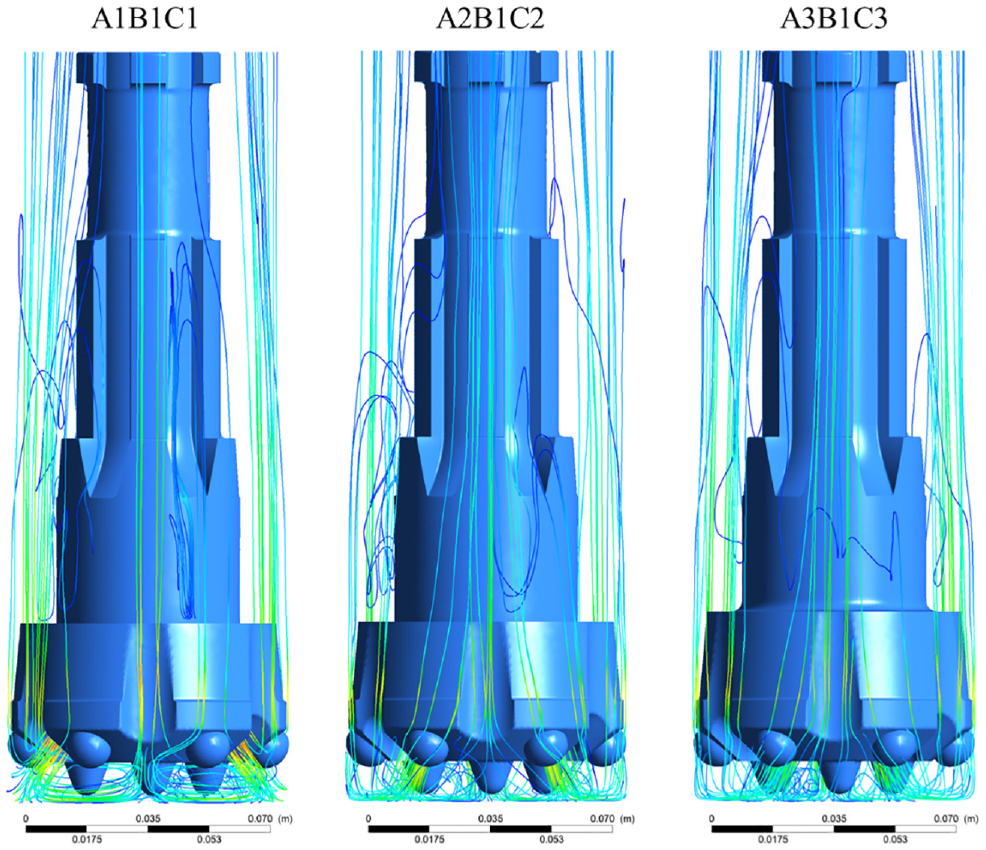
The streamline diagram in the annulus area of the shaft lining. From left to right are A1B1C1, A2B1C2, A3B1C3.
Observing these three streamlines, we can find that when the length of the chip groove is B1, due to the short length of the chip groove, after the gas exits through the chip groove, the guide of the chip groove is lacking, which leads to the streamline in the annulus area of the shaft lining is very chaotic. This situation corresponds to the actual drilling process, which will cause difficulties in chip removal and the risk of sticking.
Group A2 includes A1B2C2, A2B2C3, A3B2C1. Group A3 includes A1B3C3, A2B3C1, A3B3C2. Their streamlines are shown in Figures 22 and 23, respectively.

The streamline diagram in the annulus area of the shaft lining. From left to right are A1B2C2, A2B2C3, A3B2C1.
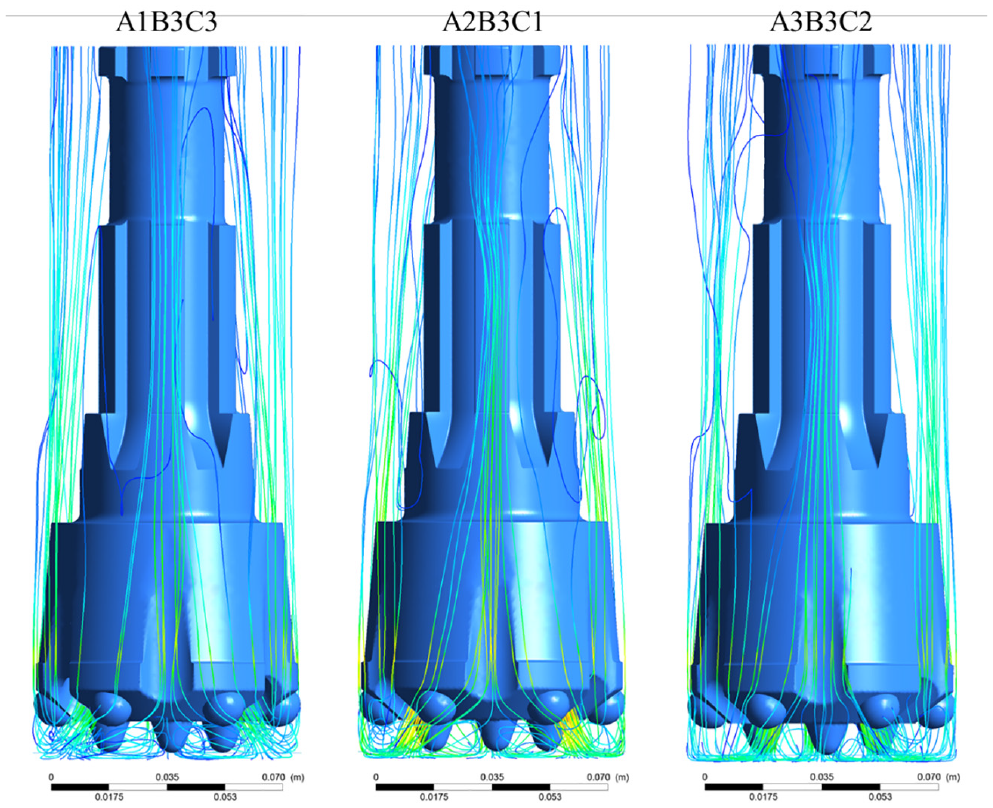
The streamline diagram in the annulus area of the shaft lining. From left to right are A1B3C3, A2B3C1, A3B3C2.
As can be seen from the above two figures, when the length of the chip groove is B2, B3, the streamlines of the annulus area of the shaft lining are relatively smooth, and turbulence rarely occurs. It is more stable than when the chip groove length is B1. This means that a longer chip groove length can improve the stability of the streamline, which indirectly proves that it can improve the stability of the chips migration. With the increase of the length, the guide time of chip groove to chips migration is longer, thereby improving the stability of the movement of the chips, making the chips removal efficiency greatly improved, and effectively reducing the risk of sticking and other risks.
Conclusion
Field test shows that the hydraulic structure of the geophysical drill-bit is closely related to the drilling speed and chip removal efficiency. Therefore, the hydraulic structure of the drill-bit is also a key factor affecting the overall geophysical exploration efficiency.
In the case of flow channel inclination and chip groove length changing, when the diameter of the flow channel is 10 mm, there is no vortex and backflow layer in the flow channel. As the diameter of the flow channel increases, the number of vortices in the flow channel and the area of the backflow layer will increase accordingly, thus reducing the average flow velocity in the flow channel. If the diameter of the flow channel is too small, the gas will decelerate seriously during the initial stage of entering the flow channel. It is helpful to increase the flow velocity by enlarging the initial stage of flow channel diameter.
In the case of flow channel diameter and chip groove length changing, excessively large channel inclination will cause turbulence in the downhole flow field, forming multiple vortices at the bottom of the well, affecting the movement of cuttings. Therefore, the inclination of the flow channel should be as close as possible to the center of the bit. The smaller the inclination of the flow channel, the smaller the area of the low-velocity watershed at the bottom of the well, and the less likely it is to accumulate rock cuttings at the downhole. This means that the friction between the bit body and the cuttings is reduced, thus improving the service life of the bit and reducing the cost of geophysical exploration.
In the case of flow channel diameter and inclination changing, as the length of the chip groove increases, the movement of cuttings in the annulus area of the shaft lining is also more stable. To reduce the occurrence of sticking and improve the efficiency of geophysical exploration.
Footnotes
Declaration of conflicting interests
The author(s) declared no potential conflicts of interest with respect to the research, authorship, and/or publication of this article.
Funding
The author(s) disclosed receipt of the following financial support for the research, authorship, and/or publication of this article: The authors cordially acknowledge the financial support from the Sichuan Science and Technology Program (NO.2019YJ0536), the National Natural Science Foundation of China (NO.51974272), and the National Natural Science Foundation of China (NO.51904263).