
Abstract
The study of phase-change heat-transfer characteristics of crude oil has been one of the hot issues in the field of gathering and transportation. The process of phase-change heat transfer of crude oil involves many complicated problems such as natural convection treatment, latent heat treatment, phase-change interface determination and fluid characteristic change. A mathematical model based on the additional capacity heat method is proposed in this article, and the momentum equations of crude oil liquid phase are presented for Newtonian and non-Newtonian fluids. The aim of this study was to investigate the influence of different factors on the heat transfer performance during the shutdown process of an overhead pipe. Experiments were conducted to verify the model and the solution method; the experimental and model results showed good agreement with a maximum relative error of 4.57%. The temperature fields and solidification conditions of crude oil in pipelines under different shutdown conditions were determined, and the sensitivity of the main effect factors was determined through an orthogonal experiment. The results show that the order of influence was oil initial temperature >thickness of insulating layer >air temperature >thickness of wax layer. The results of the study have important guiding significance on the control of shutdown time and the determination of restarting schemes.
Keywords
Introduction
The cooling and solidification process of crude oil is a typical phase-change heat-transfer problem. The determination of temperature fields inside a cooling pipe is influenced by multiple factors, such as initial temperature at shutdown, air temperature, insulation situation, and so on, and is of great importance to restart up for a pipe. Existing knowledge on the phase change of wax and other materials is very mature,1–5 and the phase change for oil heat transfer in a pipe occurs within a certain temperature range due to the complex composition of the wax. As such, the liquid–solid interface is not easy to determine. Therefore, the treatment of latent heat release and natural convection and the description of non-Newtonian fluids are the key questions in mathematical model.6–8
Convection heat-transfer heat treatment with a moving-phase interface is key to the study of heat transfer of crude oil.6–13 Patience and Mehrotra 9 and Nagano et al. 10 neglected the influence of natural convection by assuming the crude oil properties as constant. Chen and Xuan 11 neglected the convective process, treating the heat transfer as purely conductive. Li 12 established a mathematic model without a convection term in the control equation, and he regarded the latent heat of wax appearance as only appearing at the interface of liquid and solid phases, which was clearly not in accordance with the actual wax removal process of crude oil. 8 Some scholars14–17 used the equivalent thermal conductivity method to convert natural convection into heat conduction calculations. Although this method can obtain the temperature field, it cannot analyze the relevant mechanism of the natural convection heat-transfer process.
Due to the temperature difference between the hot oil and its surroundings, the temperature of waxy crude oil decreases to the wax precipitation point. As the temperature decreases further, the oil coagulates and the gelated crude oil can be regarded as a porous medium.8,17–20 In recent years, enthalpy-porous medium methods have been widely used to simulate the temperature field of crude oil in a pipe, which do not require the determination of the liquid–solid interface, but the release of crude oil latent heat of wax appearance was considered as occurring in a narrow temperature zone near the freezing point. However, there was no explanation regarding determination of these temperature ranges.21–26
For the treatment of latent heat, early researchers10,12 considered latent heat as a heat source, and the latent heat was considered to be released completely at once at an infinitely thin phase interface. Obviously, this is not consistent with the exothermic process of wax crystallization. In most porous media models,22–26 the latent heat was distributed owing to the volume fraction of the liquid oil phase. In studies by Yu et al. 8 and Majidia and Ahmadpour, 27 the specific heat capacity of crude oil in the phase-change interval is determined according to the proportion of liquid–solid crude oil. Due to the complex composition of wax crystals, wax crystals with different numbers of carbon atoms will be precipitated out successively in the cooling process, accompanied by the release of different amounts of latent heat.7,27–34 Therefore, the distribution of latent heat owing to the solid fraction cannot truly reflect the release process of latent heat.
With the development of crude oil differential scanning calorimetry (DSC) testing technology,28,33–35 the additional specific heat capacity method was often used in the treatment of latent heat capacity,7,22,28,29 that is, the latent heat was converted into specific heat capacity using the DSC curve. This treatment of latent heat of phase change was a reasonable and feasible way to accurately represent the latent heat release at different temperatures.
When wax precipitates within pipelines at and below the wax appearance temperature, wax gelation begins and inhibits flow by causing non-Newtonian behavior and increasing viscosities as the temperature of a waxy crude oil approaches its pour point.36,37 With the transformation of a Newtonian fluid into a non-Newtonian fluid, how to describe the change of fluid characteristics in the model is one of the key problems to solve the problem of heat transfer during phase change.38,39 Except for the study by Yu et al., 8 there has been no description of non-Newtonian fluid in the control equations.
To the best of our knowledge, there is no investigation of a crude oil phase-change heat-transfer model that can synthetically consider the actual phase-change latent heat-release process, the natural convection heat-transfer problem, and the transformation of a Newtonian fluid into a non-Newtonian fluid. Computational fluid dynamics (CFD) studies can provide a profound knowledge on the flow and heat-transfer mechanism.35,40,41
This article describes a mathematical model for crude oil phase change in overhead pipelines that can solve key problems in phase-change heat transfer. According to the phase state of crude oil, the control equations were established between partitions with the latent heat handled by the additional specific heat capacity method, and the analysis of Newtonian and non-Newtonian fluids was performed with the momentum equations. Then, taking the total time to freeze as the evaluation parameter, an analysis of the influence of different factors on heat transfer was performed. Finally, the sensitivity of different factors to the phase-change heat transfer was determined through an orthogonal experiment.
Physical model
The physical model of an overhead pipeline in shutdown is shown in Figure 1, where R1 is the inner diameter of the pipe, R2 is the external diameter of the pipe (which is the inner diameter of the insulating layer due to the close connection between pipe and insulating layer), and R3 is the external diameter of the insulating layer. When the overhead pipeline is shut down, the process of oil heat transfer is as follows: first, liquid oil transmits the heat to a condensate reservoir or pipe wall by natural convection; second, the heat is transferred outward through the condensate reservoir, steel pipe, insulating layer, and so on. Finally, heat is transmitted to the atmosphere and surrounding objects by convection and radiation. The oil temperature distribution in the pipe is symmetric around the Y-axis, so the Y-axis is an adiabatic surface.
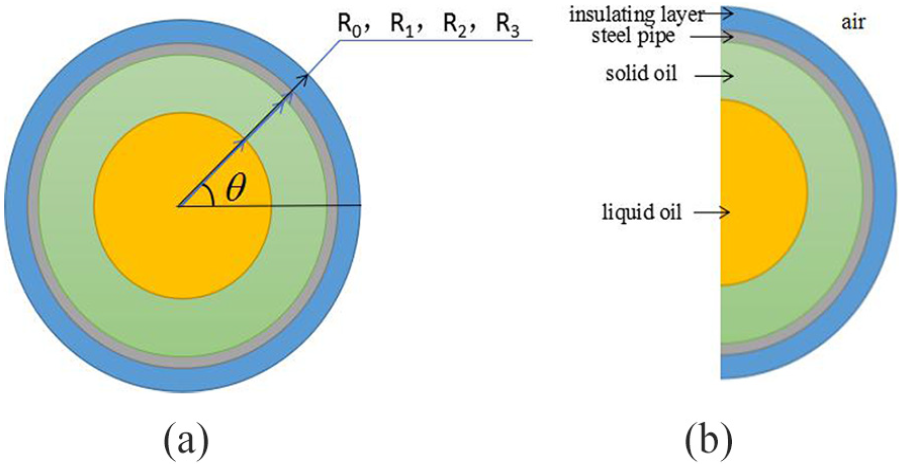
Physical model for an overhead pipeline.
In order to simplify the calculation, there were some assumptions made as follows:
Neglecting viscous dissipation in the fluid;
There was no additional thermal resistance between each layer;
Each layer material was uniform;
At the beginning of shutdown, the temperature of the oil in the pipe was uniform.
Mathematical model
Momentum equations
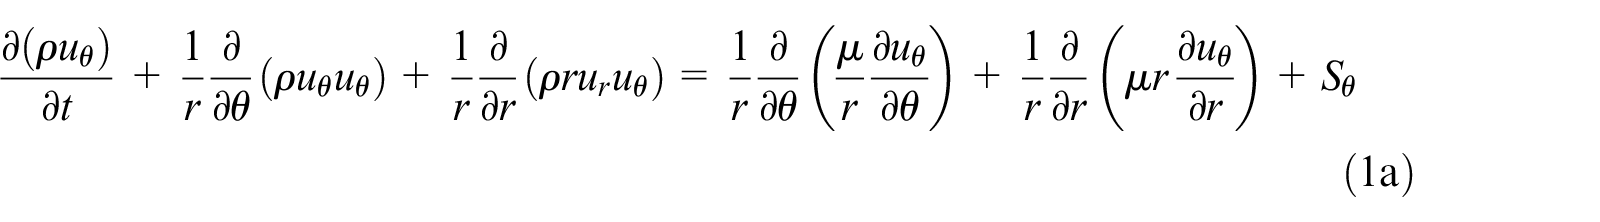
The momentum equations of a liquid are as follows:
For a Newtonian fluid


For a non-Newtonian fluid


When the crude oil cools to form a similar porous medium,


Continuity equation
The continuity equation of a liquid is as follows

Heat-transfer equation
The heat-transfer equation in liquid oil is as follows

The pure heat-conduction equation for the solid phase of crude oil is as follows

In the process of solidification, crude oil releases latent heat, which can be demonstrated by the
The heat-transfer equations for the pipe wall and insulating layer are given as follows


Boundary conditions
There were coupling heat transfer boundaries between liquid crude oil, solid crude oil, pipe walls, and thermal insulation layers. That is, the parameter values on these boundaries do not need to be set in advance but were dynamically loaded and solved according to the exchange of energy during melting and heat transfer. The heat flow density and temperature were continuous

Initial conditions
Initial condition of shutdown, that is, uniform distribution in the pipeline and constant value

Verification and analysis
Fluent 16.0 (ANSYS, Canonsburg, PA, USA) was used to establish the geometry model of the pipe, generating 36,880 meshes by the ancient coin method, such as in Figure 2. The outer wall temperature of the insulation layer was held constant at 263 K. There was a coupling boundary between the inner surface of the pipeline and the crude oil. The experimental crude oil was from the oil field site in Daqing, with the wax precipitation temperature of 315 K, the pour point of 313 K, and the freezing point of 310 K. The oil physical properties are listed in Table 1. The other parameters are shown in Table 2.

The mesh arrangement.
Experimental crude oil parameters.

Physical parameters of steel pipe.

The test bed included the heated water bath, the refrigeration systems, the crude oil heating system, the experimental pipeline, the power pumps, the temperature sensor, and the data transfer system. The experimental device has been granted a national invention patent (grant no. 201510573481.X). The specific experimental steps were as follows: the crude oil heating system heated the crude oil to 333 K and pumped it into the experimental pipeline. Refrigeration systems produced salt water of 263 K and pumped it into the water bath, simultaneously.
The initial oil temperature was the same throughout the experimental pipe, 30 thermocouple monitoring points with equal spacing were set along the axial direction of the center of the pipe and take the average of the test results at 30 points as the experimental test results of the pipe center point temperature. The thermocouples were subjected to error calibration using a primary temperature and a constant temperature water bath. The experimental temperature range was 20°C–80°C, the cooling step was 1°C, and the calibration was repeated three times to finally determine the thermocouple deviation at each temperature. Thermocouples were connected to the automatic temperature-detection system for multi-point real-time temperature measurement, with time step of 5 min. The experiment lasted for 26 h, and a total of 312 groups of pipeline center average temperature test data were obtained.
Comparison between the experimental test results of the hourly pipe center temperature and the simulation results are shown in Figure 3. There was good agreement with a maximum relative error of 4.57%, which meant the model was correct, and the method was reasonable. Thus, the model is valid to discuss the influence of some factors on total freezing time for a hot oil pipeline.

Comparison between simulation and experimental results.
Solidification cloud charts for different shutdown times are shown in Figure 4. The blue parts represent the solidified crude oil. They indicate that with the extension of the shutdown time and the continuous heat transfer between pipeline and the environment, the crude oil near the inner wall of the pipe first cooled to the freezing point (305 K). However, the condensate layer first appeared at the bottom of the pipe. This is due to natural convection, which causes the hot oil to concentrate in the upper half of the pipe. The distribution of crude oil temperature in the pipeline was approximately symmetric along the Y-axis. 6 With increasing shutdown time and the formation of the condensate, the highest temperature point gradually approached the center of the pipe. However, it was not in the center of the pipe, but above it.

Solidification cloud charts.
Figure 5 is a chart of the temperature of the positive Y-axis for various shutdown times. The following three conclusions can be drawn from Figure 5: (1) we can determine the thickness of the condensate layer on the upper pipe wall at different shutdown times. For example, from the 19 h curve, the crude oil temperature at 110 mm from the center of the pipeline reached the freezing point, which means that the thickness of the condensate reached 27 mm. When the shutdown time increased to 25 h, the crude oil temperature at 32 mm from the center of the pipeline reached the freezing point, which means that the thickness of the condensate reached 105 mm. (2) With increasing shutdown time, the position of the highest temperature point will gradually approach the center of the pipe. (3) The temperature difference of the two-point position near the upper wall decreased with the increase in shutdown time. All aforementioned analytical results were consistent with the solidification cloud chart.

Temperature of the positive Y-axis for various shutdown times.
Analysis of the influencing factors
For the given crude oil, the main factors influencing the total freezing time of the crude oil in the pipeline included atmospheric temperature, thickness of the insulating layer, initial oil temperature, and thickness of wax. Atmospheric temperature and initial temperature of the crude oil are the main factors that determine the heat dissipation of crude oil. Their temperature difference represents potential energy, and the thicknesses of the insulation layer and wax layer affect the radial heat transfer resistance. In this article, the influence of external factors on the oil temperature field and solidification time of shutdown has been analyzed. Note that all the simulation conditions were the same as the experiment, except for the change of comparison conditions.
The influence of atmospheric temperature
Atmospheric temperature is the main factor affecting the total freezing time of crude oil in pipeline. The lower the ambient temperature, the faster the oil dissipates heat. Figure 6 depicts the temperature-drop rule of crude oil at typical temperatures for different times in winter in northeast China. It gives the temperature-drop curves of the pipe center at atmospheric temperatures of 253, 258, and 263 K. It can be seen that for different air temperatures, the trends of the temperature-drop curves are consistent. When the air temperature increased by 5°C, the total freezing time increased by 1.5 h.

Temperature drop curves of the pipe center at different atmospheric temperatures.
Figure 6 shows the solidified cloud charts of crude oil in pipes in different atmospheric temperature when the shutdown time reached 22 h. Figure 7(a) shows that for atmospheric temperature of 263 K, the thickness of the condensate layer is about half of the pipe diameter. For atmospheric temperature of 258 K, as the ambient temperature decreased by 5°, the heat dissipation was faster, with only a small amount of liquid crude oil in the center of the pipe. For the atmospheric temperature of 253 K, by this time the crude oil in the pipeline had all solidified, which was completely consistent with the conclusion shown in Figure 6, which was that the maximum temperature in the pipeline had dropped below the freezing point, and the crude oil in the pipeline had all solidified.

Solidified cloud charts of crude oil in pipe 22 h after shutdown: (a) 263 K. (b) 258 K. (c) 523 K.
The influence of the initial oil temperature
Figure 8 describes the temperature drop curves of crude oil at different initial temperatures. It can be seen that for different initial temperatures, the trends of the temperature-drop curves were not consistent. For oil at 333 K, the temperature-drop process can be divided into three stages according to the temperature drop rate: in the first stage, the temperature of crude oil dropped rapidly due to the large temperature difference between the inside and outside of the pipeline; in the second stage, due to the release of latent heat and the formation of porous media regions, the temperature drop rate of crude oil slows down;8,27,31–34 in the third stage, the release of latent heat basically ended, and the temperature drop rate of crude oil increased. However, for the oil at 313 K, the peak of latent heat release was at the beginning of shutdown, the oil at this stage was in the porous media mixing zone, which led to its slow heat dissipation rate, and the heat dissipation of crude oil outwards was basically the same as the release of latent heat, so the temperature remains unchanged. Therefore, within the first 4 h after the shutdown, the crude oil remained essentially the same. Compared to the curves for oil at 323 and 333 K, the curve of the oil at 313 K showed a much more flat trend, which was due to all the crude oil of 313 K in the whole pipeline releasing latent heat,28,34 so the latent heat release was large. However, for the other two cases, with the development of shutdown, the temperature distribution of crude oil in the pipeline changed step by step in space, and only part of the crude oil within a certain temperature range was releasing latent heat. Latent heat release occurred when the temperature at the center of the pipe dropped to the wax precipitation point, which slowed the temperature drop rate. Therefore, for the three curves, the slope of the flat area was different. Higher temperatures had larger slope. From Figure 8, we know that for a 10 K increase in oil temperature, the total freezing time increases by about 7 h.

Temperature drop curves of pipe center at different initial oil temperature.
Figure 9 shows the solidified cloud charts of crude oil with different initial temperatures in the pipe 15 h after shutdown. It can be determined that when the shutdown time reached 15 h, a small amount of condensate appeared in the inner wall of the pipeline filled with crude oil at initial temperature of 333 K, and due to the convection,4,10,13 the condensate layer at the lower pipe wall was thicker than the upper pipe wall. Therefore, if planned maintenance were to be carried out under such shutdown conditions, in order to avoid the appearance of the condensate layer, the maintenance time should be controlled to within 15 h. However, for the pipe filled with crude oil of initial temperature 313 K, at this time, all the oil had solidified.

Solidified cloud charts of crude oil in pipe 15 h after shutdown: (a) 333K. (b) 323K. (c) 313K.
The influence of thickness of the insulation layer and paraffin layer
In order to reduce the heat dissipation of crude oil in the pipeline, thermal insulation outside the pipeline is necessary in the hot oil gathering and transportation process.7,11,37 Figure 10 shows the temperature drop for different insulating layer thicknesses. Waxy crude oil inevitably becomes waxy during the gathering and transportation process. When the temperature drops below the wax precipitation point, wax crystals can precipitate easily,31,32 which then stick to the inner wall of the pipe. Figure 11 describes the temperature drop for different wax layer thicknesses.

Temperature drop curves of pipe center for different insulating layer thickness.

Temperature drop curves of pipe center for different wax layer thickness.
The two aforementioned factors mainly affect the radial heat-transfer resistance of the pipeline. As thickness increases, so does thermal resistance, and the temperature drop is slower. However, the curve changes of the two graphs were significantly different. In Figure 10, as the shutdown time increased, the relative distance between the three curves became larger and larger. However, from Figure 11, we know that the relative position difference of the three curves was mainly reflected in the initial stage of shutdown. With the development of shutdown time, the three curves almost coincided. This was because different thicknesses of the wax layer affected the initial heat-transfer resistance, so the temperature drop rate was different at initial shutdown time. However, with increasing shutdown time, the condensate layer appeared in the inner wall of the pipe,24,35 which weakened the degree of influence of the initial wax layer thickness.
Sensitivity analysis of influencing factors by orthogonal experiment
In recent years, the orthogonal experimental method was widely used in the comprehensive comparison and statistical analysis of experimental factors,42–44 and the orthogonal table can balance sampling within the range of factor change, making each test more representative. In order to analyze the sensitivity of the aforementioned influencing factors within a given range on the total time to freeze, an orthogonal experimental method of four levels and three factors was adopted. Its orthogonal level and the range analysis of each parameter are listed in Tables 3 and 4.
Orthogonal levels.

Range analysis of each parameter.

Combining Figure 12 and Table 4, we see that for the influences from the four range factors given above on total freezing time, the most important factor was the initial temperature of crude oil, which accounted for 59.23% of the total. Wax layer thickness was the least influential, accounting for only 2.14%. The influence of the thickness of the insulation layer is similar to that of the air temperature, which was 21.2% and 17.43%, respectively.

Total freezing time at different levels of various factors.
Conclusion
In this article, a general model incorporating key issues of crude oil change phase that include the treatments of latent heat release and natural convection and the description of non-Newtonian fluids was established, and analysis of the main factors’ effects on temperature drop and total freezing time was performed. The sensitivity of different factors was analyzed based on an orthogonal experimental table. The main conclusions are as follows:
In this model, the latent heat was treated as an additional specific heat capacity, and the momentum equations of Newtonian and non-Newtonian fluids were given to describe the convection problem. Compared with the experimental results, the maximum relative error was 4.57%, and the agreement was good.
With the extension of the shutdown time, the maximum temperature point in the pipeline gradually approaches the center, but the final freezing point was not at the center of the pipeline.
The thermal insulation layer and wax layer both affect the radial heat-transfer resistance of the pipeline. The influence of different thicknesses of the insulation layer will be more and more obvious with the extension of shutdown time, but for waxed pipe, the difference in temperature drop curves caused by different thickness of the wax layer will be weaker and weaker.
The initial temperature and atmospheric temperature of the crude oil directly determine the temperature difference of heat transfer. Their effects on the temperature field and the total solidification time were most prominent.
In order to analyze the sensitivity of the aforementioned influencing factors within a given range on the total freezing time, an orthogonal experimental method with four levels and three factors was adopted. The results show that the order of influence was oil initial temperature >thickness of insulating layer >air temperature >thickness of wax layer.
Footnotes
Appendix 1
Declaration of conflicting interests
The author(s) declared no potential conflicts of interest with respect to the research, authorship, and/or publication of this article.
Funding
The author(s) disclosed receipt of the following financial support for the research, authorship, and/or publication of this article: This work was supported by the National Natural Science Foundation of China (grant no. 51534004) and the Youth Cultivation Fund of Northeast Petroleum University (grant no. 2018QNL-15).