
Abstract
Tunnel portal sections located in the soft-hard rock junction are vulnerable to the strong earthquake motions in seismically active regions. The main objective of this paper is to investigate the seismic response of tunnel portals located in the soft-hard rock junction. Taking the Baiyunding tunnel in northeast China as a background, a shaking table test with a geometric scaling ratio of 1:30 was built. Details of test setup and procedures are introduced first and then the test results are presented. The discussion of the results is based on the peak ground acceleration (PGA), the longitudinal, the contact stress, and the safety factor. The results show that the soft section of the soft-hard rock junction suffers remarkable damages under strong seismic motions, while the hard rock section is less affected by earthquakes. The increasing soft rock range causes a rise of the forced displacement of tunnel linings, which, together with the seismic inertia force, leads to the increase of the contact stress of the linings, and ultimately resulting in the deterioration of the tunnel seismic safety. To mitigate the seismic damage of tunnel portals in the soft-hard rock junction, rock grouting, bolt support, and other effective reinforced methods should be considered in the seismic design of the soft section.
Keywords
Introduction
Tunnels are significant components of any transportation network. Historically, they were believed to be seismic resistant and thought to experience a low rate of dynamic damages in seismically active regions. However, in the last several decades, tunnels were recorded to experience damages at different levels, including the Chichi earthquake (Taiwan, 1999), the Kocaeli earthquake (Turkey, 1999), the Wenchuan earthquake (China, 2008), and the Kumamoto earthquake (Japan, 2016).1–4 The unrecoverable damages not only brought about substantial property loss, but caused some casualties. Therefore, the dynamic response and structure stability under strong seismic motions become a core technical problem and arouse much attention.
Up to now, a large number of researches were conducted to study the seismic response of tunnels. For example, by the mean of the nonlinear dynamic transient analysis, Anastasopoulos et al.5,6 investigated the response of a deeply immersed tunnel under the action of the seismic vibration and the major normal fault. Park et al. 7 developed a procedure to explore the spatially varying ground motion on underground tunnels, and found that the variable ground motion can induce considerable axis stress and cause longitudinal bending of the tunnel lining. By conducting the shaking table test, Aydan et al. 8 presented the influence of the seismic ground shaking on the response and collapse of tunnels, and proposed the empirical equation to quickly assess the possible damages of underground structures. In the work of Chen et al., 9 a series of model tests on utility tunnels conducted in an attempt to explore the structural response under non-uniform seismic excitations. By the finite element method (FEM), Hatzigeorgiou and Beskos 10 investigated the soil-structure interaction of 3D lined tunnels, and discussed the most critical parameters affecting the dynamic response of the mountain tunnels. Combined the results of the FEM analysis and the shaking table test, Jiang et al. 11 observed the seismic performance of a utility tunnel by discussed the rock response, the structure response, the rock-structural response and the earth pressure. Cilingir and Madabhushi 12 conducted the seismic centrifuge tests and full finite element analysis to investigate the effects of the buried depth on seismic behaviors of the circular tunnels. Sun et al. 13 carried out a model test to learn about the dynamic behaviors of portals of the parallel-tunnels. Argyroudis and Pitilakis 14 proposed the fragility curves of shallow metro tunnels in alluvial deposits, when subjected to transversal seismic loading. In the study of Debiasi et al., 15 the frictional response of the rock-structure interface, the geometry of the box structure, the overburden depth, the maximum PGA, and the increasing soil stiffness with increasing depth were considered to study the seismic response of shallow-buried rectangular tunnels. Kouretzis et al. 16 investigated the effects on the hoop force and bending moment of the circular tunnel under the S- and P-seismic actions by adopting the ABAQUS solver. Based on a multi-scale method, the seismic analysis of the long tunnel was obtained in the study of Yu et al. 17 , and the factor of the depth, input motions, the flexible joint and the non-uniform seismic excitation are thoroughly discussed. More relevant works can be found in the works of (Li and Song, 2015; Moghadam and Baziar, 2016; Qiu et al., 2018; Tsinidis et al., 2015; Yu et al., 2018).18–22
These abundant researches have provided good guidance for the aseismic design of tunnels in seismically active areas. However, few studies have focused on the dynamic response of the tunnel located in the soft-hard junction. In the 2008 Wenchuan earthquake, the lining cracking, water seepages, lining collapses, and other serious damages were recorded in the portal sections of the Youyi, Ma’anshan, and Baiyunding tunnels, while the seven tunnels (i.e. the Zaojiaowan, Maojiawan, Chediguan, Futangguan, Taoguan, Caopo, and Dankanliangzi tunnels) located in the same line were less affected by the strong seismic motion.23,24 Based on the investigation reports and researches, the fracture fault zone, the slope failure, and the soft-hard rock junction are the critical issue in these severely damaged tunnels. Scholars have done a lot of research on the former two, but the research on the soft-hard rock junction has only been noticed in recent years. 25 Besides, the existing studies are often based on numerical analysis, but ignore the effective method of model test.
Therefore, in this paper, a shaking table test with a geometric scaling ratio of 1:30 was built to analyze the seismic response of the soft-hard rock junction of tunnel portals. Firstly, the test setup, sensors, modified waves, and test procedures was described in detail. Then, critical factors including the peak ground acceleration, the longitudinal strain, the contact stress, and the minimum safety factor were discussed, and finally, some key conclusions are obtained. The conclusion could provide a scientific reference for tunnel projects with similar geological conditions.
Experimental method and apparatus
Prototype description
The Baiyuanding tunnel is located in Wenchuan County, Aba Tibetan, and Qiang Autonomous Prefecture, Sichuan Province, China, with an altitude of 1044 m and a buried depth of 14–30 m at the portal section. It is a horseshoe-sectional national highway tunnel, and has a total span of 11.3 m and a maximum height of 6.95 m. A composite lining is adopted as the support structure of the tunnel. The initial support is the 0.25 m-thick concrete with a concrete grade of C20, and the secondary lining is 0.6 m-thick reinforced concrete with a concrete grade of C25(the concrete class is consistent with the Chinese Code for design of concrete structures, GB 50010-2010). 26 Referring to geological investigation reports, the overburden of the portal section is mainly quaternary colluvium and diluvium, consists of gravelly soil and sandy silt, would be classified into grade V according to China Code for design of Road Tunnels (JTG D70-2004). 27 The surrounding rock of the lower part of the tunnel is mainly composed of sandstones and limestones, and the corresponding grade of rocks is II (the rock is better with growing grade numbers). The stratum of the Baiyunding tunnel region is depicted in Figure 1.

Stratum of the Baiyunding portal section.
Test facilities
The shaking table in China Nuclear Power Research and Design Institute was used in the test (see Figure 2). This table could provide concise seismic motion with a maximum acceleration of 3.5 g in horizontal and 3.0 g in vertical. Other parameters of the table are listed in Table 1. Model chamber sized 2.5 m × 2.5 m × 2 m was adopted in this study, which was constituted of thickened steel plates, as shown in Figure 3(a). Before the test, the model chamber was firmly clamped to the shaking table test by M30 bolts located at the chamber bottom. Then, a 0.225 m-thick polystyrene board was placed on the inner wall to absorb the energy of reflected waves, and a plasticon film was installed on the polystyrene board to reduce the friction between soils and chamber sidewalls. 1 In addition, at the bottom of the chamber, a layer of gravel is cemented to assure the synchronous vibration of model materials and steel plates (see Figure 3(b)).
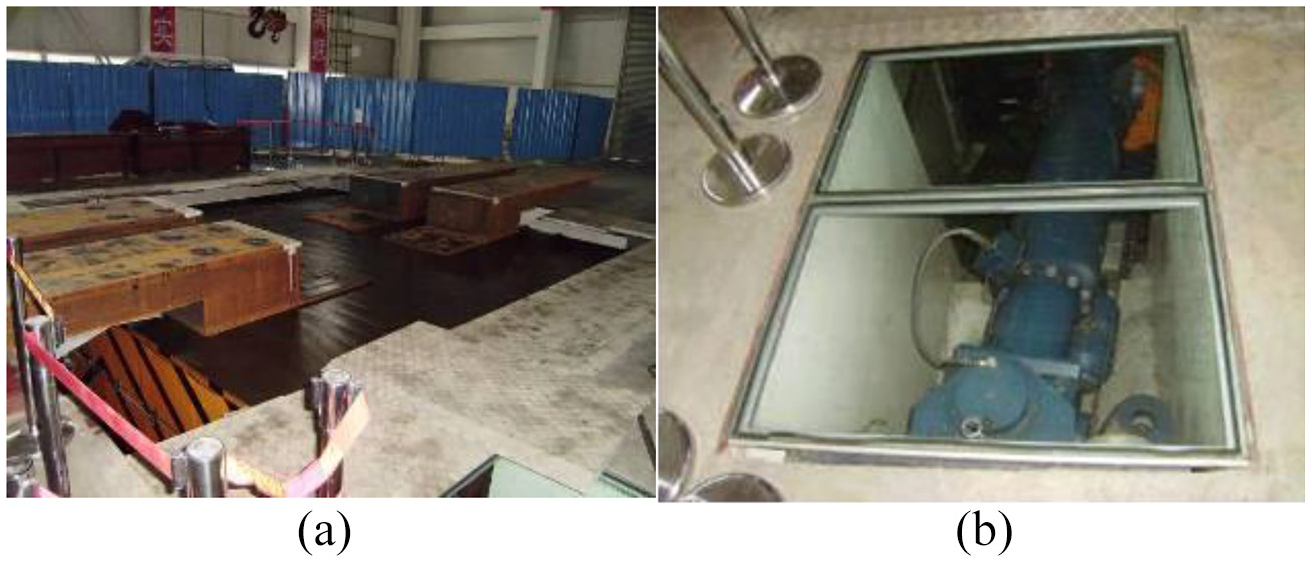
Shaking table: (a) the top view and (b) the actuator.
Parameters of shaking table.


Test chamber: (a) the front view and (b) the inside view.
Scaling laws and similar materials
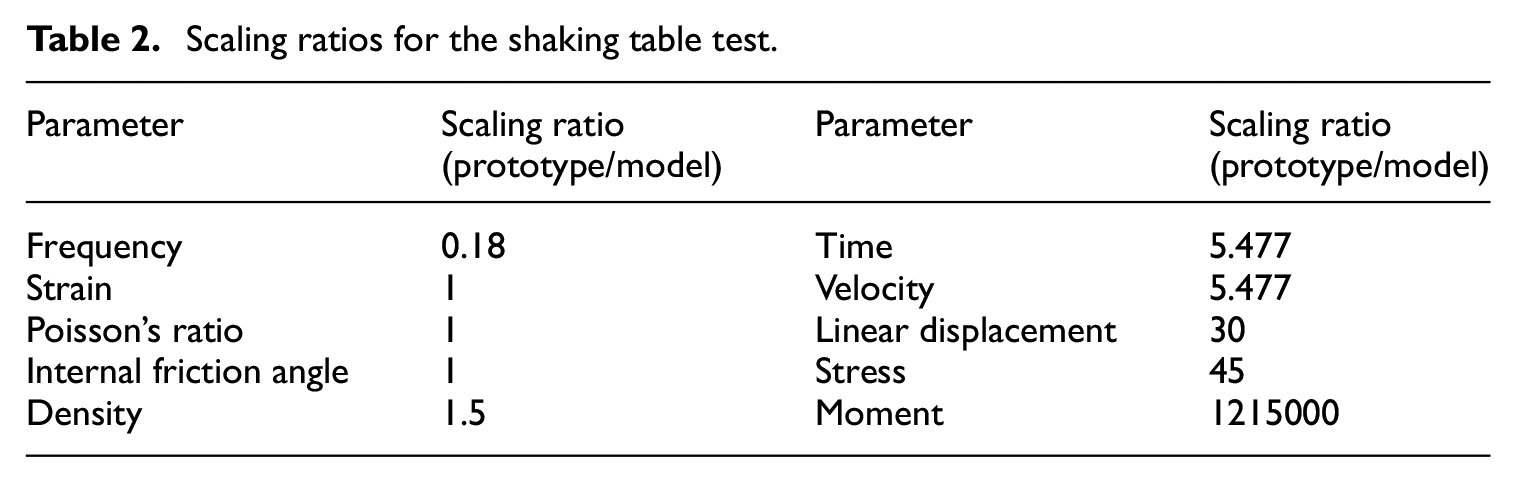
Considering the dimension of the shaking table, the size of the chamber, and the economy of this test, the scaling ratio of 30 in geometric was set. The scaling ratio of elasticity modulus and acceleration was 45 and 1, respectively. The remaining physical quantities of scaling ratio can be derived from the similarity criterion, as shown in Table 2. The variable and complicated surrounding soils of the Baiyunding tunnel region are very tough to bring back to the laboratory. Thus, the model material for rock is the hot melt mixture of fly ash, river sand, and engine oil. 28 Fly ash and river sand are aggregate, and engine oil is the binder. After mixing, cooling, crushing, and screening, the model materials are reconstituted. In this study, it is assumed that the soft rocks, hard rocks, and linings are continuous and homogeneous materials. The corresponding mixture proportions were derived from orthogonal tests and a large number of trial calculations. In accordance with the reduced scale, material properties of model rocks were verified by indoor tests and geological explorations, as listed in Table 3. According to the relevant mechanical tests, the similar materials of rocks in this test are little affected by temperature and humidity, and could well reproduce the stress-strain state.
Scaling ratios for the shaking table test.
Mechanical parameters of surrounding rocks.

The gypsum is a typical brittle material, and its physico-mechanical properties are similar to those of concretes. In theory, it can not only accurately simulate the linear elasticity of concrete, but also roughly reproduce the plasticity of concrete. Also, the gypsum has the advantage of easy preparation and stable properties in comparison with other reconstituted materials. Thus, in the present study, the reinforced concrete lining was simulated with gypsum and steel mesh, and the ratio of gypsum to water in weight was 1.48. Some procedures of the lining preparation are shown in Figure 4.

Lining preparation: (a) mold making, (b) casting, and (c) curing.
Sensor layout and monitoring sections
In the present study, totally five monitoring sections were arranged along the axis direction of the tunnel, namely from section A to section E, to collect the stress, strain, and internal force data of the tunnel under seismic loads. Figure 5 illustrates the cross-section diagram of the test system. Overall, Section A and E were filled with soft rocks and hard rocks, respectively. From the section A to E, the proportion of soft rocks gradually decreases, while that of hard rocks increases. It should be noted that Section D, C, and B were located in the soft-hard rock junction, and the D, C, and B sections intersect with the soft-hard rock interface at the tunnel vault, sidewall, and invert, respectively.
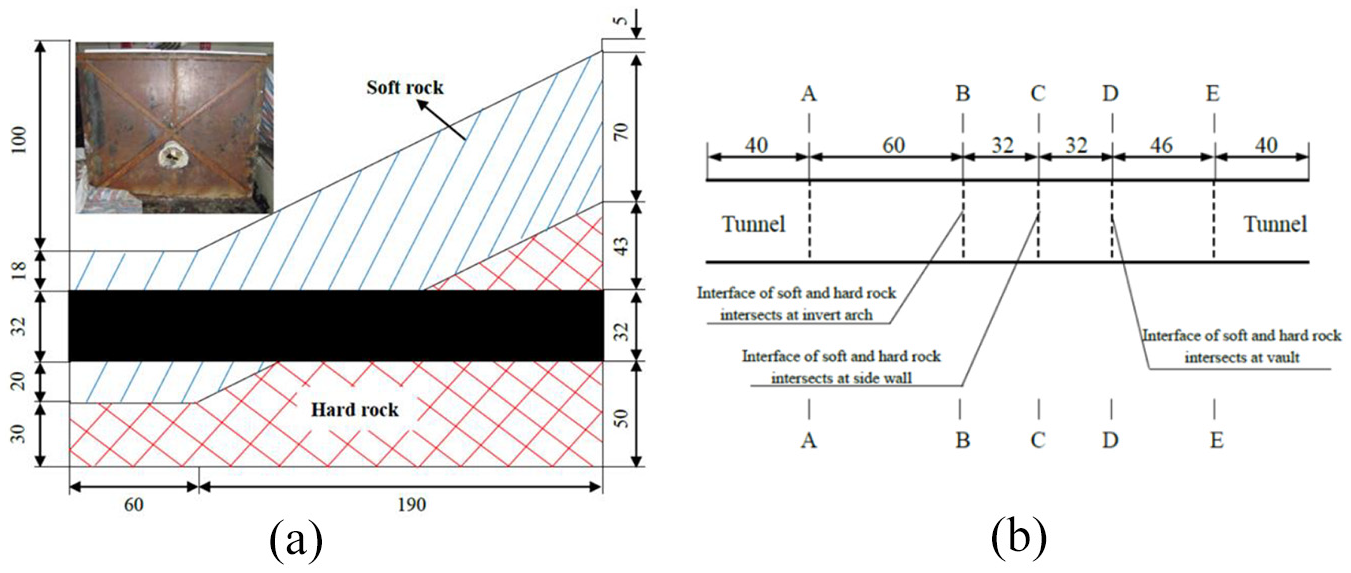
Test model (a) Sectional view and (b) top view (unit: cm).
The accelerations in this paper were concisely measured by three-way accelerometers (TST1010l/TST1010ls). Ten accelerators were arranged to monitor three-dimensional accelerations in two levels, five at the invert arch of the monitoring section, and the other five at the bottoms of the test chamber, which were corresponding to the positions of the monitoring section in the vertical direction. Through the arrangement of accelerators, the seismic acceleration response of the soft-hard rock junction could be studied. A total of five earth stress sensors (DYB-1) were placed between linings and surrounding rocks to monitor the contact stress of linings. Then, 15 resistance strain gauges (BE120-5AA) were installed at the outer of tunnel linings, and three gauges were set on each monitoring section, respectively at the invert arch, vault, and left side wall. In addition, the custom-made data acquisition system is used to monitor and collect seismic data. The system is composed of a dynamic strain data acquisition module and a dynamic strain/ICP data conversion module. It should be noted that the seismic internal force of tunnel lining could not be measured by sensors, but should be calculated with the dynamic strain/ICP data conversion module. All the sensors had been calibrated before using. The sensors for the test are shown in Figure 6, and the layout of the sensor is depicted in Figure 7.

Test sensors: (a) three-way accelerometer, (b) earth stress sensor,(c) dynamic strain data acquisition system, and (d) dynamic strain/ICP data conversion system.

Layout of sensors for the test.
Input seismic motion and test procedure
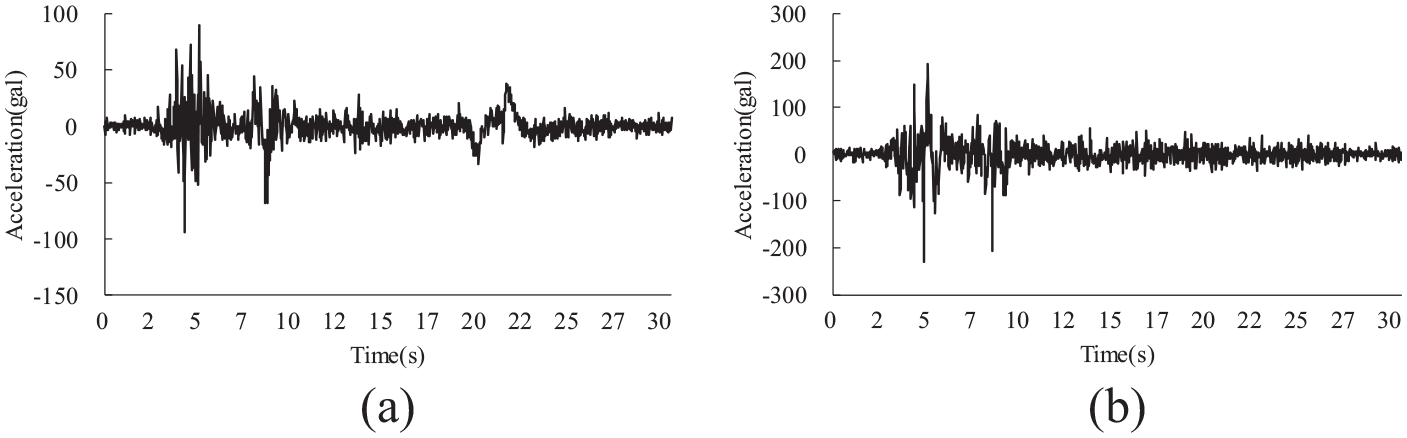
To obtain the seismic response of soft-hard rock junction of tunnel portals in actual seismic events, a representative wave was chosen as the input load, namely, Wolong waves. This kind of wave was recorded at the Wolong station during the 2008 Wenchuan earthquake, and its typical properties can well reflect the seismic characteristic of the Baiyunding tunnel area. The duration of the input motion is 164 s, with a recorded interval of 0.005 s. Before the similar transformation of seismic waves, the modification processes of the filtering and the frequency modulation were carried out. Figure 8 depicts the acceleration time history of the modified input seismic motion with the predominant frequencies of 16, 17, and 21 Hz in the east-west, north-south, and vertical directions, respectively. Through the modal analysis, the predominant frequencies of the test chamber and the tunnel-surrounding rock system are calculated, 49.71 and 5.57 Hz, respectively. Therefore, due to discrepancies on the predominant frequency of input motions, the test chamber, and the tunnel-surrounding rock system, the resonance will not occur in the dynamic test. Before the excitation of seismic loads, the white noise with a small amplitude was input to check the working state of all sensors and acquisition states. Then, the modified seismic accelerations were simultaneously imposed at the bottom of the model, and the sensors began to collect the seismic data since then. The seismic waves propagated upward from the bottom of chambers to tunnel linings, and the east-west, north-south, and vertical directions of seismic waves were corresponding to the horizontal, axis, and vertical directions of the tunnel model.

Time history of the input dynamic motion: (a) east-west direction, (b) North south direction, and (c) Vertical direction.
Results and analysis
Peak ground acceleration (PGA) response
Considering space limitations, only the acceleration time histories of the chamber bottom and the tunnel inverts in Section A are illustrated in Figure 9. Results in the following analysis are in model scale. Table 4 lists the peak ground acceleration (PGA) and its amplification factors of tunnel inverts. Generally, the PAG of the soft tunnel section (i.e. section A) is only 231 gal, it then continues to reduce as the soft rock proportion increases, and finally reaches a minimum of 117 gal at the hard section (i.e. section E). It should be noted that the PGA amplification factor of the section A is 2.46, which is rather higher than that of section E (i.e. 2.46). According to seismic wave field theory, this is because the obvious free-face amplification forms when waves propagate in soft soils, while the vertical amplification in hard rocks is limited. Thus, as the soft rock proportion decreases from section B to section D, the free-face amplification of waves diminishes accordingly, and finally exhibits a downward trend in PGA amplification factors. To sum up, due to the excellent amplification of seismic waves in soft rocks, the seismic force propagating to the tunnel in soft rocks is much greater than that in the hard rock. Consequently, the strong seismic motion of the soft tunnel may lead to severer seismic damages, which is in good agreement with the seismic investigation data.
Acceleration time history: (a) the point at the chamber bottom and (b) the point at the tunnel invert in section A.
PGA and amplification factors.

Note: The average PGA of the chamber bottom is 94 gal.
Longitudinal strain response
The time history of the longitudinal strain is plotted in Figure 10, and vault points in sections C and E are chosen as examples for presenting. Table 5 lists the peak longitudinal strain of tunnel vaults and their growth with respect to the hard section (i.e. section E). All peak longitudinal strains are derived from corresponding time-history curves. It is observed from Table 5 that the peak longitudinal strain of the hard tunnel (i.e. section E) is only 3.80 με, while that of the soft tunnel (i.e. section A) is 4.56 με with a increase percentage of 20.00%. It can be inferred that the forced displacement of the soft section under seismic motions is larger than that of the hard section. In addition, the peak longitudinal strain of section B, C, and D increases to 4.12, 3.99, and 3.87 με, respectively, by 8.42%, 5.00%, and 1.84, respectively. There a positive relationship between the soft rock proportion and the forced displacement for the tunnel at the soft-hard rock junction. That is, the larger the range of soft rocks, the greater the forced displacement of the tunnel in earthquakes. This is one of the reasons why tunnels in soft rock suffer more earthquake damage and the closer to the soft rock, the more serious the earthquake damage.
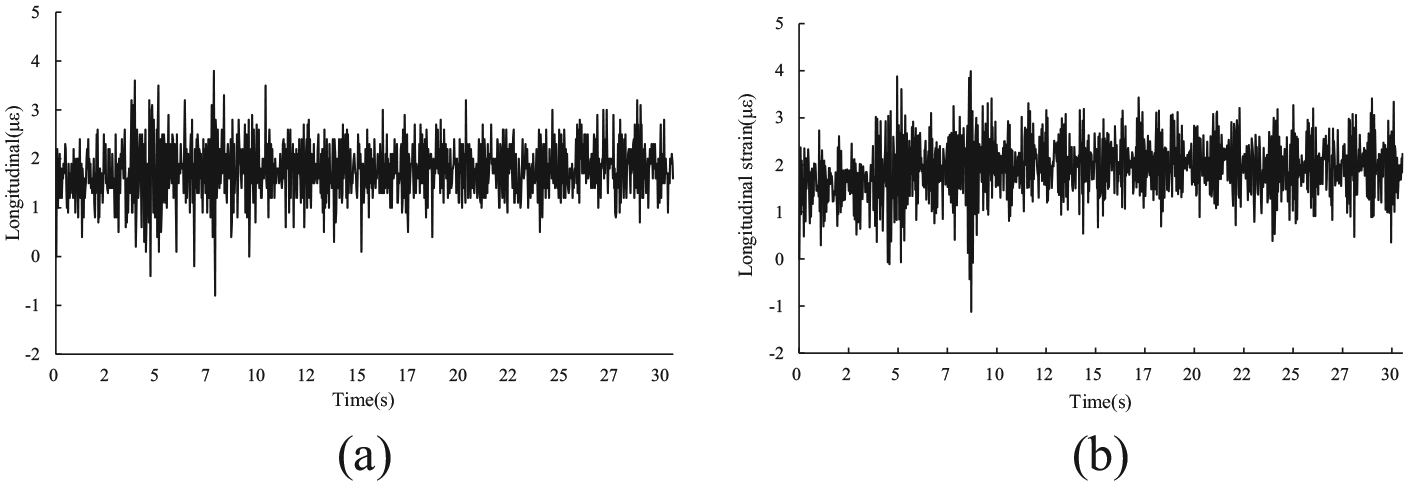
Longitudinal strain time history: (a) section C and (b) section E.
The peak longitudinal strain.

Contact stress response
Taking the section C and E as examples, the contact stress time-history curves of the tunnel vault are depicted in Figure 11. The peak contact stress of monitoring sections and the corresponding growth are calculated in Table 6. The contact stress of the hard section (i.e. section E) is only −0.0.7 kPa, while that of the soft section (i.e. section A) is −8.80 kPa, with an increase multiple of 114.45. This is because the strong seismic inertia force and the large forced displacement of the soft rock tunnels lead to the increase of the contact stress. Consequently, the contact stress should exhibit a diminishing trend from section A to section E correspondingly. From Table 6, the contact stress reduces to −4.65, −3.56, and −0.56 kPa, respectively, which presents a good agreement with the analysis of the PGA and the longitudinal strain.

Time history curves of the contact stress: (a) section C and (b) section E.
Contact stress and increase multiple at each section.

Structural safety factor response
There are numerous safety indexes in the present seismic design of underground structures, such as the axis force, the bending moment, the major principal stress, and so on. In this paper, the safety factor from the Chinese Code for Design of Road Tunnel is chosen as an indicator of seismic safety. 27 This factor could provide a comprehensive safety evaluation by synthetically considering the influence of the strength of concrete, the thickness of the lining section, the eccentric state, the axis force as well the bending moment. The factor is calculated by equations (1) and (2). Generally, the seismic safety is better with growing grade numbers, that is, the larger the safety factor is, the safer the structure is.


Where Ra represents the ultimate compressive strength of concrete; Rl represents the ultimate tensile strength of concrete; K denotes the safety factor; N denotes axial force; b and h represents the width and thickness of the section, respectively; φ represents the longitudinal bending coefficient of structure; α is the coefficient of eccentricity of axial force; e0 is the eccentricity of the section.
The minimum safety factor of tunnel linings are derived from the time-history of safety factor, and the reduced percentage of the minimum safety factor of sections A, B, C, and D relative to section E are listed in Table 7. Overall, the hard section (i.e. section E) has the highest factor of 23.99, which the minimum occurs at the soft section (i.e. section A) with a value of 8.45. From section D to section B, as the soft rock range increases gradually, the minimum safety factor continuously decreased to 17.71, 14.42, and 11.16, respectively, with a reduce percentage of 26.18%, 39.89%, and 53.48%, respectively. The development of the minimum safety factor well corresponds to the analysis of the PGA, the longitudinal strain, and contact stress. To sum up, with the increase of the soft rock proportion, the seismic inertia force and the forced displacement increase correspondingly, which leads to the aggravation of the contact stress, and finally presents a seismic response with a low safety. The results shown are in accord with the damage observed in the in-site, in that the soft sections of the tunnel portal were most seriously damaged. Therefore, in the seismic design for tunnel portals in the soft-hard rock junction, especially in the soft section grouting, bolt support, and other reinforced seismic methods should be considered.
The minimum safety factor.

Conclusion
By the mean of the shaking table test, the seismic response of the portal section in the soft-hard rock junction was investigated. Although the present study is carried out and promoted by a specific project, the results may provide a scientific reference for the tunnel project with similar geological conditions. Some key conclusions are as follows
The soft section of the soft-hard rock junction suffers remarkable damages under strong seismic motions, while the hard rock section is less affected by earthquakes.
The increasing soft rock range causes a rise of the forced displacement of tunnel linings, which, together with the seismic inertia force, leads to the increase of the contact stress of the linings, and ultimately resulting in the deterioration of the tunnel seismic safety.
To mitigate the seismic damage of tunnel portals in the soft-hard rock junction, rock grouting, bolt support, and other effective reinforced methods should be considered in the seismic design of the soft section.
Footnotes
Author contributions
Conceptualization, G.C. and J.M.; methodology, G.C.; investigation, G.C. and J.M.; data curation, G.C.; writing—original draft preparation, G.C. and J.M.; writing—review and editing, J.M.; project administration, G.C.; funding acquisition, G.C.
Declaration of conflicting interests
The author(s) declared no potential conflicts of interest with respect to the research, authorship, and/or publication of this article.
Funding
The author(s) disclosed receipt of the following financial support for the research, authorship, and/or publication of this article: The authors appreciate the support from the National Natural Science Foundation of China (grant no. 51408008).
Data availability
The data used to support the findings of this study are included within the article.