
Abstract
Vascular access (VA) is necessary for patients on hemodialysis, and percutaneous transluminal angioplasty (PTA) is a useful treatment for maintaining VA function. PTA immediately increases the VA flow volume, which can affect cardiac function. We investigated the relationship between changes in VA flow volume and cardiac function in patients who underwent PTA. This was a single-center retrospective observational study, including patients who underwent PTA between June 2016 and August 2016. VA flow volume and cardiac function were measured by sonography before and 1 h after PTA. This study included 50 PTA procedures in 50 cases. PTA significantly increased the median VA flow volume from 445 (range, 150–1229) to 725 (350–1268) mL/min. Although the ejection fraction and diameter of the inferior vena cava were unchanged, the cardiac output (CO) and cardiac index increased significantly in most cases. Surprisingly, the CO was decreased in 18% of cases despite the increased VA flow volume. In this atypical group, a high CO before PTA was found to be a significant factor for the decrease in CO by PTA. In most cases, both VA flow volume and CO were increased by PTA, whereas in some cases, the CO was decreased despite an increase in VA flow volume. This atypical phenomenon may be due to the insufficient adaptive response in the peripheral artery and heart and could predict risks for future cardiac events. Therefore, it is important that such patients are carefully followed up on.
Keywords
Introduction
Vascular access (VA) is necessary for patients on hemodialysis (HD). In particular, arteriovenous fistula (AVF) and arteriovenous graft (AVG) are widely recognized as more favorable VA than central venous catheters in terms of carrying the least risk of infection. 1 In Japan, almost all patients on HD used AVF or AVG, with utilization rates of 89.7% and 7.1%, respectively. 2 Since AVF and AVG are a kind of shunt access, considerable blood flow from high-resistance arterial systems to low-resistance venous systems is generated just after anastomosing the artery to the vein. This shunt flow directly returns to the heart without perfusing any organs; consequently, the flow volume load via VA is added to that in the previously existing systemic circulation. This situation is thought to lead to an increase in cardiac output (CO) after the creation of AVF or AVG. 3 The increased CO boosts venous return further, and both volume loads of the right and left heart dramatically increase. A previous study that compared cardiac function before VA creation with that 2.6 years after VA creation reported that VA decreased right ventricular function, which is associated with mortality. 4 Although a sufficient VA flow volume is necessary for sufficient efficiency of HD, an excess VA flow volume increases cardiac stress and unfortunately can also increase the risk of mortality in patients on HD.
In contrast, VA flow volume is often decreased via VA stenosis or occlusion, leading to the need for VA intervention therapy. Although the patency of an AVF is superior to that of an AVG, the 1-year patency rate of an AVF without intervention therapy is reported to be 64% 5 compared to 31.5% with an AVG. 6 To maintain functional patency of the VA, some guidelines recommend percutaneous transluminal angioplasty (PTA) as a favorable intervention therapy.7,8 After the dilation of the VA stenotic lesions by PTA, the VA flow volume notably increases, which could affect cardiac function. Previous studies that have investigated the relationship between PTA for central vein stenotic lesions and change in cardiac function reported that neither ejection fraction (EF) nor diameter of inferior vena cava (IVC) were unchanged, 9 and that elevation of brain natriuretic peptide (BNP) was observed after PTA. 10 However, these previous studies had contained problems about small sample sizes and special situations, whereby the PTA was against central vein stenosis.
Therefore, to investigate the impact of PTA on cardiac function in patients with HD, we examined the relationship between changes in VA flow volume and cardiac function induced by PTA against stenotic lesions of a forearm AVF or AVG.
Materials and methods
This was a single-center retrospective observational study of patients on HD who underwent PTA at the Kanno Dialysis and Access Clinic between June and August 2016. For patients who were treated more than once with PTA during the study period, only clinical data at the first PTA were used. Cases with moderate or severe cardiac valvular diseases, those who underwent PTA for VA total occlusion, and those without sufficient clinical data were excluded. The VA flow volume was measured just before and 1 h after PTA, and cardiac function was measured by sonography at the time of VA flow volume measurement. Other patient information was obtained from the medical records.
Measurement method for VA flow volume
We measured the VA flow volume using the Doppler ultrasound technique based on a previous report. 11 The same ultrasound equipment (Aplio 500, Toshiba, Tokyo) was used throughout the study. The VA flow volume was defined as the flow volume of the ipsilateral brachial artery, and the resistance index (RI) of the brachial artery was also measured at the same time. Sonographic data were measured by the same technician.
Measurement method for cardiac function
Cardiac function parameters, including EF, CO, cardiac index (CI), left ventricular mass index (LVMI), and the diameter of the IVC, were measured by ultrasonography (Aplio 500, Toshiba, Tokyo) at the time of VA flow measurement before and after PTA. Measurement methods were based on a previous report. 12 The EF and CO were measured using the biplane disk summation method. The LVMI was calculated using the liner method using the Cube formula.
PTA procedure
The operators, who conducted the PTA, selected a balloon size by referring to the diameter of the stenotic lesion and the anteroposterior diameter estimated by ultrasonography or angiographic images. Stenotic lesions were dilated twice by just or slightly over the size balloon for up to 3 min under 20 atmospheric pressure (atm). All procedures were performed using local anesthesia.
Prognosis survey after PTA
We investigated the vital prognosis of participants in this study until July 2020 (4 years after this survey).
Statistical analysis
All obtained data were statistically analyzed. Continuous variables are presented as medians and ranges (minimum–maximum). Mann–Whitney U test was used to perform comparisons between two groups, and Kruskal–Wallis test was used to perform comparisons between the three groups. Wilcoxon’s signed-rank test was used for comparisons between two paired groups. Categorized variables are presented as percentages, and a chi-squared test or Fisher’s exact test was used to detect between-group differences. Spearman’s rank correlation test was used to examine correlations between the two parameters. Logistic regression analysis was used for multivariate analysis, and a p-value < 0.05 was set as the significance level in each analysis. SPSS software (ver. 26; IBM Japan Corp., Tokyo, Japan) was used for the statistical analyses. The datasets generated and/or analyzed during this study are available from the corresponding author upon reasonable request.
Ethical considerations
The study protocol was approved by the Ethical Committee of Shinshu University (approval no.: 4631), and the study was conducted in accordance with the principles of the Declaration of Helsinki as revised in 2013. Informed consent was waived due to the retrospective nature of the study.
Results
Participant characteristics
A total of 318 PTA procedures were performed for 247 patients with HD between June 2016 and August 2016 (3 months). As a result of applying the exclusion criteria, 50 PTA procedures for 50 patients (one PTA per patient) were included in this study (Figure 1). The median age of the patients was 67 years, and 48% were male. Thirty-eight percent of primary kidney disease was diabetic kidney disease, and 28% was chronic glomerulonephritis. Fifty-four percent of patients had left-sided VA, 59% had AVF, and the remaining had AVG. The anastomosis site of VA was the forearm for 56% of the patients. The most common stenotic lesions were located forearm, which were shown in 76% of the patients. Stenosis of the central vein were shown in 4%. Multiple stenotic areas were shown in 20% of the patients (Table 1). In all patients, radial and brachial arteries were used for AVF and AVG, respectively.

Patient selection.
Patient characteristics.

AVF: arteriovenous fistula; BSA: body surface area.
Data for continuous variables are expressed as median and range, and data for categorical variables are expressed as numbers and percentages.
All PTA procedures were successfully performed, and one balloon was used per PTA procedure. A 5-mm diameter balloon was used for ten cases (20%), a 6-mm balloon was used for 39 cases (78%), and a 4-mm balloon was used for one case (2%). The median VA flow volume was significantly increased from 445 to 725 mL/min, and the median RI was significantly decreased from 0.57 to 0.50 (Table 2). With regard to changes in cardiac function, the EF and diameter of the IVC were unchanged, whereas CO and CI increased significantly. Although CO was significantly increased by PTA, the changing rate of CO was not correlated with that of the VA flow volume (r = 0.08, p = 0.58) (Figure S1). When we investigated the individual patient data, we found that there was a group of cases whose CO was decreased despite the increased VA flow volume. Considering the measurement deviation, we divided all cases into three groups: The group of patients whose CO increased by more than 10% (increased group: I group); the group where CO was maintained within a margin of 10% (stable group: S group); and the group where CO decreased by less than 10% (decreased group: D group) (Figure 2). The I group comprised 42% of all cases; their median CO increased from 3.4 to 4.7 L/min, while the median CO changing rate increased to 24% (range, 13%–86%) following PTA. The S group comprised 40% of all cases; their median CO slightly increased from 4.2 to 4.4 L/min, while the median CO changing rate was 3% (range, −7% to +9%). The D group comprised 18% of all cases; their median CO decreased from 5.9 to 4.8 L/min, while the median CO changing rate decreased by −17% (range, −23% to −11%). The age, sex, body surface area, percentage of AVF, VA vintage, HD vintage, history of cardiac diseases, history of diabetes, the proportion of beta-blocker intake, selected balloon size, location of stenotic lesions, blood pressure, and heart rate before PTA did not differ significantly between the three groups (Table 3). The VA flow volumes increased in all groups, and the VA flow volumes before and after PTA, as well as their increasing rates, were identical among the groups. The RIs decreased significantly after PTA in all groups, and decreasing rates of RIs before and after PTA did not differ significantly between the three groups. With regard to cardiac function parameters, the EF and diameter of the IVC were unchanged by PTA, and there were no significant differences among the three groups. The LVMI before PTA in the I group was significantly higher than that in the other groups (Table 3). Since it was thought to be atypical that CO was decreased by PTA despite the increased VA flow volume, we investigated related factors associated with changes in CO using subgroup analysis. In this analysis, continuous variables were divided by the median, and 95% confidence intervals for the means of related factors are presented as a forest plot (Figure 3). The differences between the two groups in terms of sex, CO, EF before PTA, and LVMI were relatively large; thus, we speculated that these factors might be related to a reduction in CO by PTA. Using these factors, we conducted a multivariate analysis and found that a high CO before PTA was a significant factor for a decrease in CO by PTA (Table 4).
Changes in vascular access (VA) flow volume and cardiac parameters after percutaneous transluminal angioplasty (PTA).

CI: cardiac index; CO: cardiac output; EF: ejection fraction; IVC: inferior vena cava; PTA: percutaneous transluminal angioplasty; RI: resistance index. Data for continuous variables are expressed as medians and ranges. Differences between pre- and post-angiography were compared using Wilcoxon s signed rank test

Changes in cardiac output (CO) by percutaneous transluminal angioplasty (PTA). In all patients, CO was increased significantly by PTA. Patients were divided into three groups based on the CO change pattern. The increased group accounted for 42%, the stable group accounted for 40%, and the decreased group accounted for 18%.
Comparison of clinical parameters among the groups divided by cardiac output (CO) reaction patterns by percutaneous transluminal angioplasty (PTA).
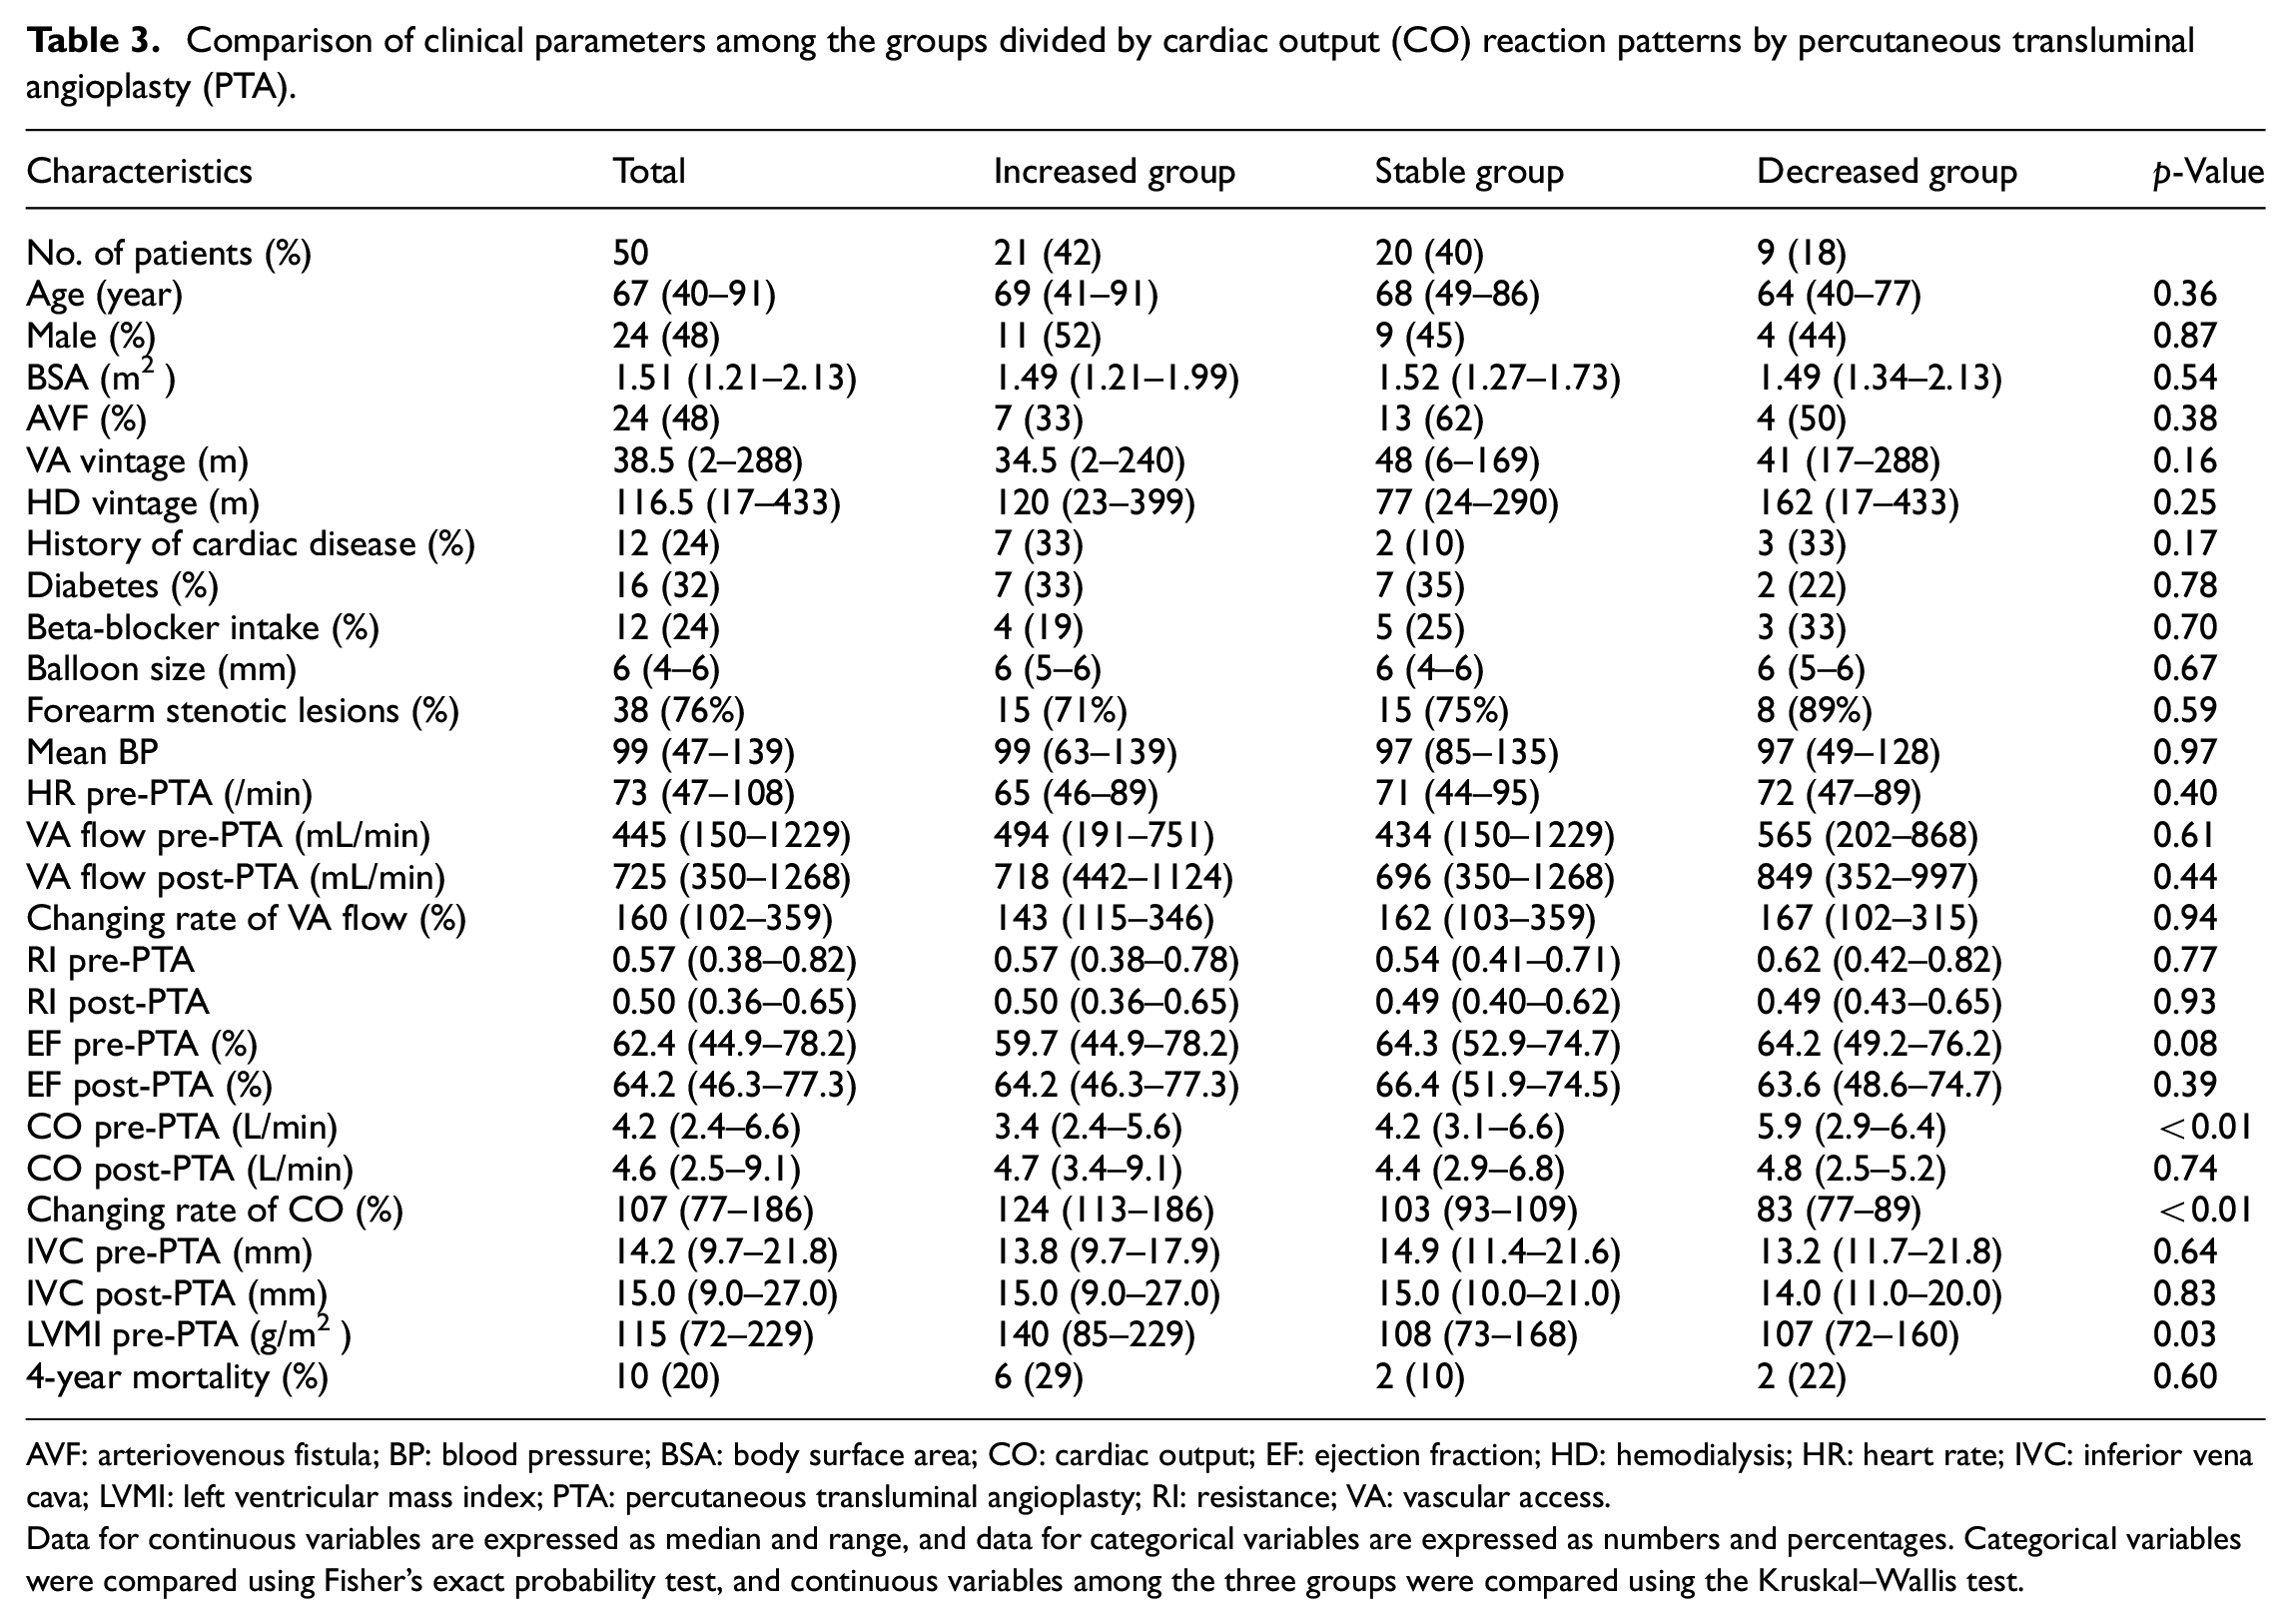
AVF: arteriovenous fistula; BP: blood pressure; BSA: body surface area; CO: cardiac output; EF: ejection fraction; HD: hemodialysis; HR: heart rate; IVC: inferior vena cava; LVMI: left ventricular mass index; PTA: percutaneous transluminal angioplasty; RI: resistance; VA: vascular access.
Data for continuous variables are expressed as median and range, and data for categorical variables are expressed as numbers and percentages. Categorical variables were compared using Fisher’s exact probability test, and continuous variables among the three groups were compared using the Kruskal–Wallis test.
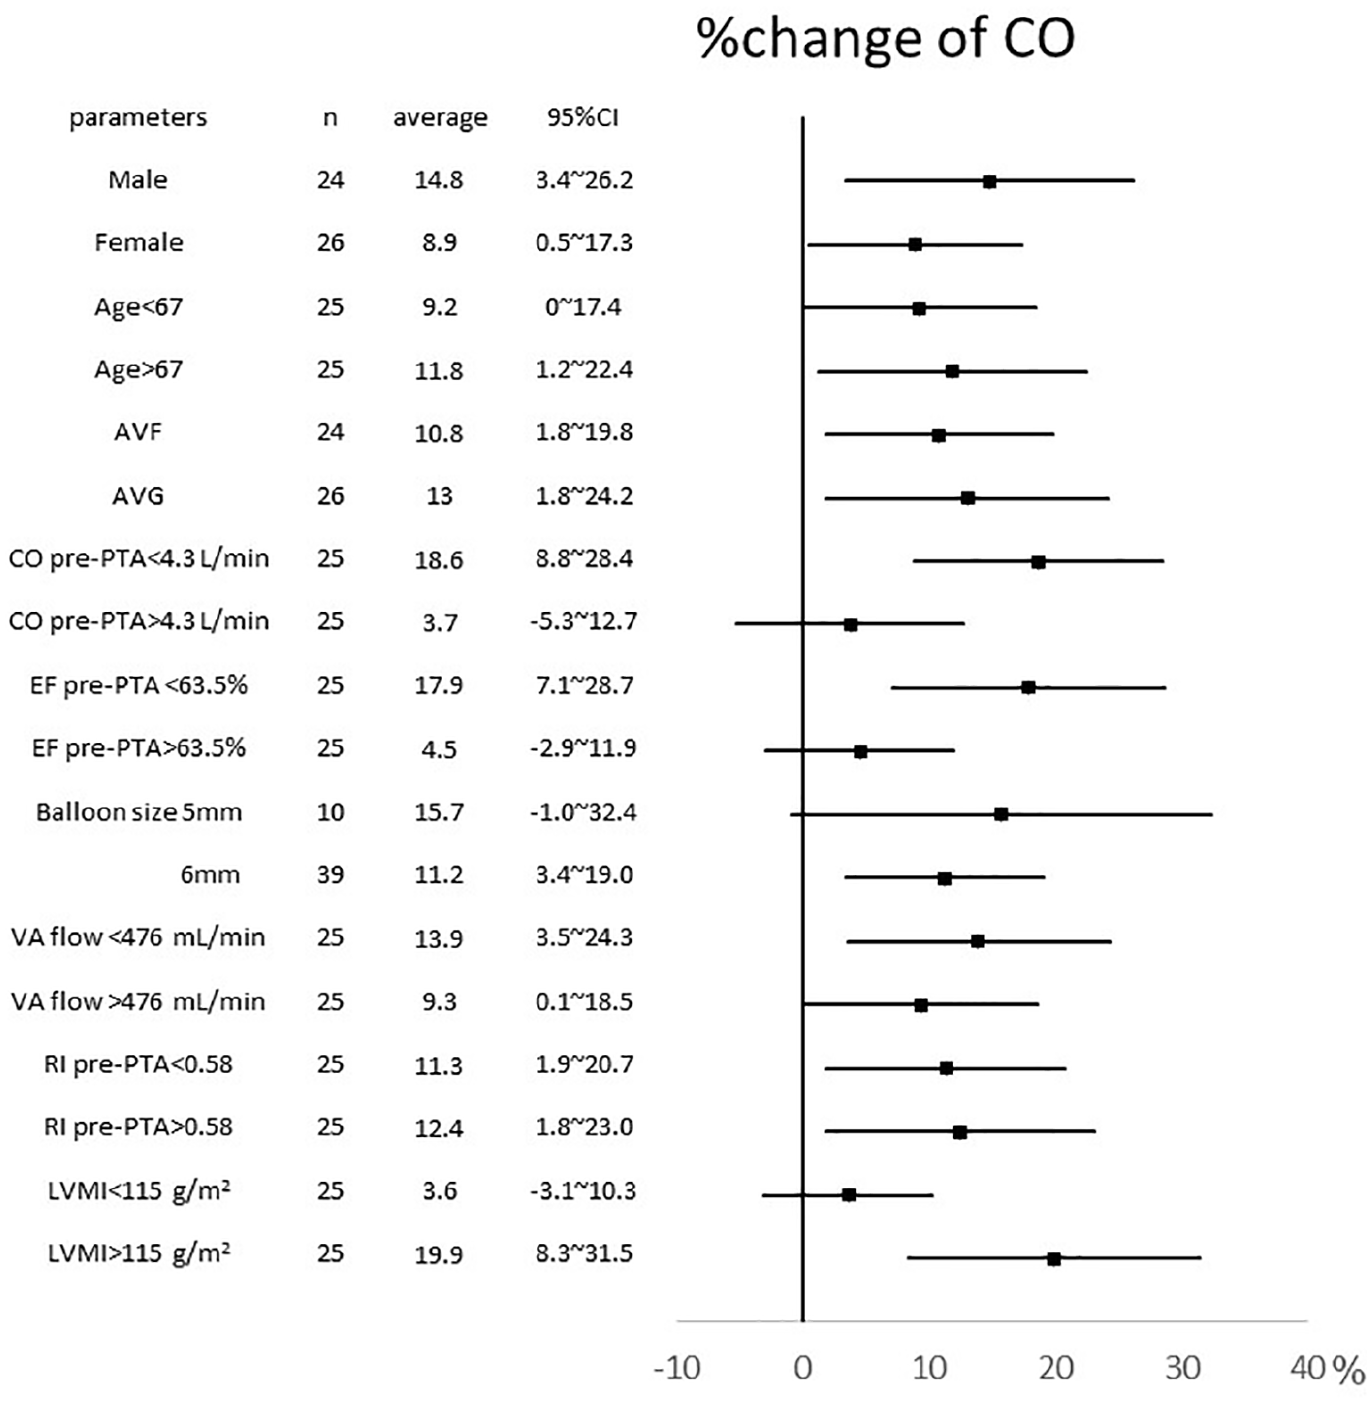
Forest plot of factors relating to a change in cardiac output (CO). Percent changes in CO by PTA were evaluated by subgroup analysis. Continuous variables were divided into two groups by median. The percent change in CO is presented as the mean and 95% confidential interval.
Multivariate analysis for factors relating a reduction in cardiac output (CO) after PTA.
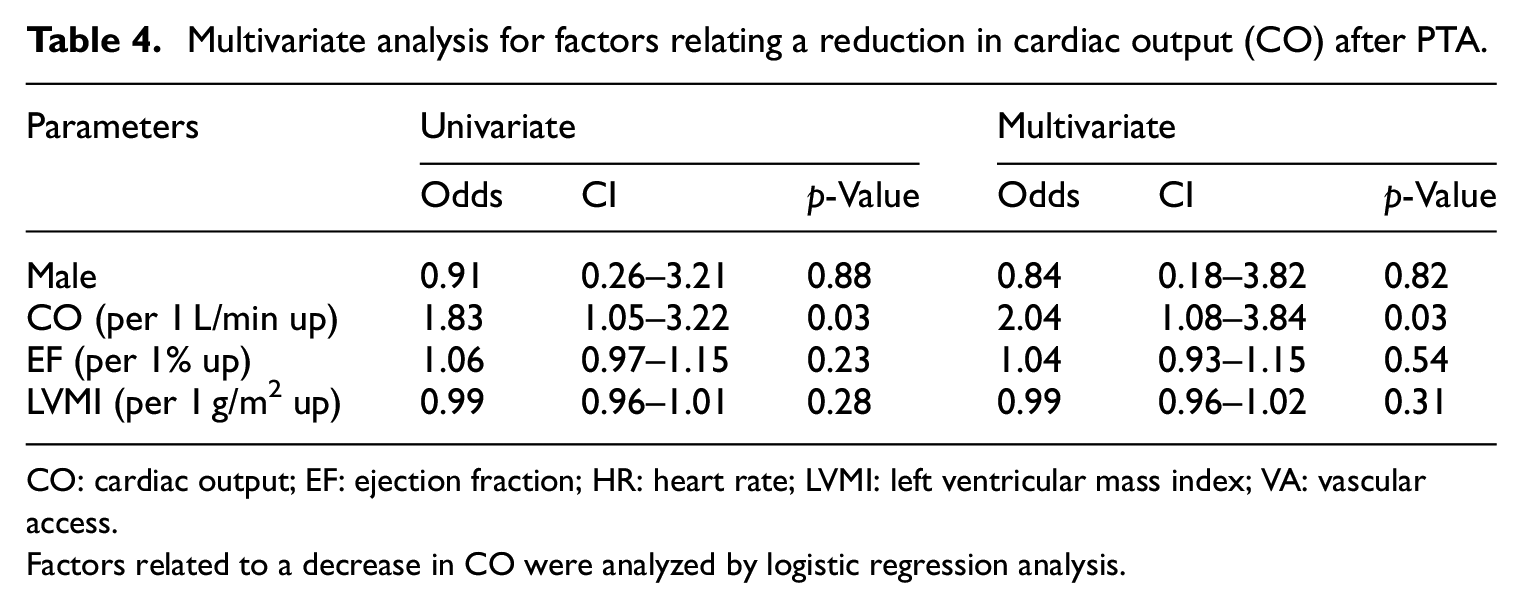
CO: cardiac output; EF: ejection fraction; HR: heart rate; LVMI: left ventricular mass index; VA: vascular access.
Factors related to a decrease in CO were analyzed by logistic regression analysis.
Concerning the prognosis of the patients, 10 patients (20%) died over the 4-year period among all participants. Although mortality was compared between the three groups, no significant differences were detected (Table 3).
Discussion
The current study revealed the alteration in cardiac function by PTA, and that CO was increased by PTA in most cases; however, the alteration patterns of CO differed by case. To understand the impact of shunt access such as AVF or AVG on cardiac function, the concept of dividing CO into flow volume of VA circulation (Qa) and flow volume of the systemic circulation (Qs) was proposed in earlier studies. 13 We utilized this concept and further considered the reason for the different reaction patterns of CO among the groups. Figure 4 presents the conceptual image of the changes in Qa and Qs in the three groups estimated from the clinical data of the current study.

Conceptual image of changes in vascular access (VA) flow volume and systemic blood flow volume in the three groups. The figure is based on the hypothesis that the cardiac output (CO) is equal to the sum of the systemic blood flow volume and vascular access flow volume, and the changing pattern in each group was estimated from the clinical data of the current study.
In general, VA creation generates a low-flow resistance route and a considerable amount of Qa. In a situation with sufficient reserve capacity in systemic circulation to withstand excess volume load, the increase in Qa is compensated by the increase in CO. 14 A previous study reported that the left ventricular diameter was dilated and CO was increased by 15% 14 days after AVF creation 15 ; in this pattern, an increase in Qa induces an increase in CO. PTA for degenerated VA immediately increases Qa, as in the case of the newly created VA. In the current study, CO was significantly increased or maintained by PTA in most cases, probably due to systemic adaptation responses against an increase in Qa. We were unable to detect significant changes in the IVC diameter, despite the fact that VA circulation increases venous return to the heart. Cardiac compensation based on Starling’s law might diminish right-heart load and conceal the IVC change. Meanwhile, cardiac stress due to prolonged high-flow VA should also be considered. A previous study reported that VA flow over 2 L/min predicted high-output cardiac failure. 3 In the current study, there were no cases where VA flow was increased more than 2 L/min after PTA; however, future risk of high-output cardiac failure should be considered in cases with a VA flow over 2 L/min after PTA.
It may be relatively easy to understand the phenomenon of the increase in CO derived from the increase in Qa. However, surprisingly, we found that CO in 18% of cases was decreased despite the increased Qa by PTA. These atypical cases were characteristic in that their CO before PTA was significantly greater than those in the other two groups. We, therefore, considered the influence of two factors affecting Qa and Qs: peripheral flow resistance and cardiac contraction ability.
First, the influence of peripheral flow resistance should be considered. The newly created VA generates a low-flow resistance circuit. When systemic flow resistance is unchanged despite VA creation, Qs is thought to dramatically decrease in contrast with increased Qa. However, such phenomena are rarely observed, and Qs are relatively maintained in real clinical situations. Several studies have suggested that nitric oxide and other vessel-relaxing factors are released from the endothelium as a result of increased wall shear stress due to Qa after VA creation.16–18 These vessel-relaxing factors dilate the arteries and decrease systemic peripheral flow resistance, resulting in the maintenance of Qs. PTA decreases the flow resistance in the VA circuit through the dilation of the stenotic lesion, and also increases Qa and vessel wall shear stress, probably inducing the release of relaxing factors and reducing systemic flow resistance. This may explain why Qs was increased or maintained in the I and S groups, respectively in the current study. Patients in the I group presented high LVMI levels before PTA. LVMI readings have been reported to be related to blood pressure, which was determined here by CO and circulation resistance. 19 Since I group patients had equivalent blood pressure levels to other groups and relatively lower CO than those in other groups, high LVMI level in the I group suggested a continuous high circulation resistance before PTA in this group. Patients with higher circulation resistance could obtain a more positive effect via PTA through dilation of the stenotic lesion and increased vessel-relaxing factors. As a result, patients in the I group presented the largest increase in CO after PTA.
To the best of our knowledge, the decrease in CO after PTA has not been previously reported. As shown in Figure 4, we suspected that the Qs in these patients dramatically decreased after PTA because their CO decreased despite an increase in Qa. In patients with endothelial and arterial dysfunction, the release of vessel-relaxing factors from the endothelium, as well as an adequate arterial response to the relaxing factors, might deteriorate. The D group patients may have such vessel dysfunction; in these patients, Qs could be decreased due to an insufficient decrease in systemic flow resistance. Moreover, the D group patients already had a massive CO before PTA, which may have been derived from an existing marked low systemic flow resistance. It is possible that their vessel adaptation ability against changes in Qa and wall shear stress already reached the limitation level before PTA; therefore, their adaptation response might collapse in the face of further changes, resulting in a Qs reduction.
Second, the influence of cardiac adaptive contraction ability should be considered. An increase in Qa by PTA causes a dramatic increase in venous return volume to the heart. A functionally preserved heart can increase CO and maintain systemic circulation in response to an increase in venous return compensatory. However, patients whose cardiac adaptive ability has reached a limitation level, hardly react with increased venous return, and cannot increase their CO. Therefore, the CO increasing reaction against an acute increase in Qa by PTA might deteriorate in these patients.
As mentioned above, the adaptive responses, including a decrease in peripheral resistance and an increase in CO, might be insufficient and result in a reduction in Qs in the D group in this study. Since their reserve adaptive abilities of the vessel and heart might be very small, these patients may have a high risk of developing heart failure in the future. We were unable to detect significant differences in mortality among the three groups, and we could not provide sufficient evidence to verify our hypothesis; this may have been due to the short timeframe, the small size, and the retrospective study design.
As presented in the current study, the CO change by PTA for degenerated VA varies by case, and the relationship between cardiac function and PTA remains controversial. A previous study reported that PTA affected cardiac function, 9 while another reported that it did not. 10 This discrepancy may have been due to the differences in the backgrounds of the participants included in each study.
Although the impact of VA on cardiac function is not fully understood, the maintenance of cardiac function is crucial for patients on HD. Therefore, we should pay close attention to the long-term prognosis, the occurrence of heart failure, and increases in disdialysis syndrome and mortality in patients on HD who undergo PTA. Further research is needed for a more detailed and long-term assessment of cardiac function and VA flow volume.
This study has several limitations. First, this was a single-center retrospective study; therefore, we could not examine parameters that were not recorded. In particular, the parameters concerning cardiac function after PTA, including heart rate and blood pressure, were limited. The changes in heart rate and blood pressure before and after PTA can influence CO considerably. Although heart rates and blood pressures in subjects before PTA, as well as various medications capable of affecting heart rate and blood pressure such as beta-blocker and systemic anesthetics, were identical among groups, we could not fully discount a significant impact of their changes against CO alteration. Thus, we could not exclude the effects of uncoordinated confounders completely. Second, most of the patients included in this study underwent HD in other facilities; therefore, information concerning body weight change from their dry weight, and their clinical situation during HD could not be obtained. It is possible that these factors affected the results of the current study. Third, we used ultrasonography to measure CO, which was calculated using heart rate and stroke volume. Although the ultrasonography machine and the measurement technician were the same throughout the experiments, we could not rule out the possibility that LV volumes measured by ultrasonography may vary considerably and affect CO results. Furthermore, CO measured by ultrasonography is considerably affected by valvular diseases, so we excluded patients with moderate or severe valvular diseases. To address these problems, other measuring strategies are needed for patients with valvular diseases in future studies. Fourth, parameters after PTA were measured 1 h after PTA. We expected that a 1-h interval would make patients free from the various stresses of PTA, but the remaining stresses from PTA could have affected the parameters after PTA. Fifth, this study was performed with a limited number of patients, and only a small number of patients presented with decreased CO by PTA; therefore, the statistical power is considered insufficient to identify significant factors. Because of these limitations, a large-sized prospective study with more sequential measurements is needed to investigate the reasons for this different response. However, the results of this study suggest very interesting relationships between VA and cardiac function, and these findings may prove useful in the design of future studies.
Conclusions
In most cases, PTA for VA immediately increased the VA flow volume and CO. However, in some cases, CO decreased despite the increase in the VA flow volume by PTA. This atypical phenomenon may be due to the insufficient adaptive response in the peripheral artery and heart and may predict risks for future cardiac events. Therefore, such patients should be carefully followed up to avoid any future complications.
Supplemental Material
sj-jpg-1-sci-10.1177_00368504211031097 – Supplemental material for Impact of a change in vascular access flow volume after percutaneous transluminal angioplasty on cardiac function
Supplemental material, sj-jpg-1-sci-10.1177_00368504211031097 for Impact of a change in vascular access flow volume after percutaneous transluminal angioplasty on cardiac function by Koji Hashimoto, Yuji Kamijo, Makoto Harada, Yosuke Yamada, Taro Kanno and Yutaka Kanno in Science Progress
Footnotes
Acknowledgements
Author’s contributions
KH contributed to the research idea and study design. KH, TK, YK, and YK contributed to data acquisition. KH and YY contributed to the data analysis. KH wrote the manuscript. YK and MH corrected the manuscript, tables, and figures. YK was the research director. All authors have read and approved the final manuscript.
Declaration of conflicting interests
The author(s) declared no potential conflicts of interest with respect to the research, authorship, and/or publication of this article.
Funding
The author(s) received no financial support for the research, authorship, and/or publication of this article.
Supplemental material
Supplemental material for this article is available online.
Author biographies
References
Supplementary Material
Please find the following supplemental material available below.
For Open Access articles published under a Creative Commons License, all supplemental material carries the same license as the article it is associated with.
For non-Open Access articles published, all supplemental material carries a non-exclusive license, and permission requests for re-use of supplemental material or any part of supplemental material shall be sent directly to the copyright owner as specified in the copyright notice associated with the article.