
Abstract
Wildlife trading and the illegal hunting of wildlife are contributing factors to the biodiversity crisis that is presently unfolding across the world. The inability to control the trade of animal body parts or available biological materials is a major challenge for those who investigate wildlife crime. The effective management of this illegal trade is an important facet of wildlife forensic sciences and can be a key factor in the enforcement of effective legislation surrounding the illegal trade of protected and endangered species. However, the science of wildlife forensics is limited by the absence of a comprehensive database for wildlife investigations. Inter-simple sequence repeat markers (ISSR) coupled with high resolution melting analysis (HRM) have been effectively used for species identification of 38 mammalian species. Six primers of the ISSR markers were chosen for species identification analysis. From six ISSR primers resulting in a range of accuracy of 33.3%–100% and 100% in terms of precision in every primer. Furthermore, 161 mammalian samples were 100% distinguished to the correct species using these six ISSR primers. ISSR-HRM analysis was successfully employed in determining mammal identification among varying mammalian species, and thus could serve as an effective alternative tool or technique in the species identification process. This option would offer researchers a heightened level of convenience in terms of its performance and the ease with which researchers or field practice veterinarians would be able to interpret results in effectively identifying animal parts at wildlife investigation crime scenes.
Introduction
The global wildlife trade that has extended from local and small-scale hunting practices to international trade channels is a major threat to the biodiversity of the planet.1–4 Over the past decades, the illegal wildlife trade has increased and intensified continuously and has now been estimated to generate over 20 billion US dollars per year.5,6 Thailand is a hub country for this type of trade with an in-depth record of trade in wildlife markets dating back to the 1960s. 7 Approximately 1% of the mammals exported from Southeast Asia were reported to be wild-caught; nevertheless, the illegal trade of many high-profile species, such as elephants, bears and tigers, is often not reported.6,8 Nowadays, online marketing strategies have become a major problem as they promote environmentally damaging and illegal hunting practices. This is due to the fact that many products derived from wildlife can be distributed by masking their original identity.7,9
Wildlife forensic science has grown rapidly over the past decade and it can play a significant role in biodiversity conservation. 9 The study of hair morphology and morphological osteology have been recognized as high-value references in the validation of the origin of unidentified samples. Moreover, ballistics, fibre analysis, toxicology and veterinary pathology have been used as analytical techniques in the investigation of crimes against wildlife. However, these techniques have some limitations when they are used to examine unknown samples.9,10 Wildlife species identification tools distinguished by DNA and the techniques that are used to develop genetic markers have been adopted in the implementation of several approaches, such as mitochondrial gene (mtDNA), nuclear gene (nDNA), short tandem repeat (STR) and single nucleotide polymorphisms (SNPs), to provide evidence in wildlife crime investigations. This can be done by following recent advances made in human DNA forensics and evolutionary genetics.11,12 Individual identification is done based on repeated polymorphic markers that are used in generating an individual’s genotype. Its value has been well-recognized, mostly in incidences of wildlife poaching and trafficking that require demonstration when different specimens have all come from the same animal.13,14
Inter-simple sequence repeat (ISSR) markers have been extensively used in a number of applications, for example in those associated with establishing genetic improvements as well as species-specific markers.15,16 This method enables researchers to differentiate between species without extensive DNA sequence information.15,16 High resolution melting analysis (HRM) has been introduced as a rapid method for the genotyping of known variants or in the scanning for unknown variants 17 with several advantages including the following: (i) HRM is a closed-tube technique that could reduce cross-contamination and would not require the handling of hazardous materials, (ii) HRM is less time consuming and (iii) with HRM, the DNA are obviously distinguished by graph changing in melting curves that are easy to visualize. 18 Several studies have reported on the successful identification of organisms using HRM in conjunction with various molecular markers, for instance mtDNA, SNPs and STRs.19–25 ISSR markers or DNA fingerprints would be a more powerful tool in distinguishing between individual specimens and species due to the presence of a single primer that can produce differentiated melting curves from multiple loci. Thus, the objectives of this study were to develop and evaluate the utilization of ISSR markers coupled with the HRM technique when identifying wildlife mammal species for the surveillance or prevention of wildlife illegal trading.
Materials and methods
Sample collection
The animals and cadavers used in this study were handled in accordance with the applicable laws, relevant guidelines and provisions for ethical regulations. The methods used in this study were approved of by the Animal Use Committee of the Faculty of Veterinary Medicine, Chiang Mai University, Thailand in 2018 (S32/2561). A total of 161 mammal individual subjects from 38 mammalian species (Table 1) were selected, and 1 mL-blood samples were collected from the live animals through a cephalic, saphenous or jugular vein. The blood samples were then transferred into 3-mL ethylenediaminetetraacetate tubes (EDTA). Tissue samples were collected from animal cadavers. Those tissue samples were obtained from liver, muscle or skin samples, and were collected by sterile scalpel blade or scissors with a sampling size of approximately 3 × 3 cm2 and were around 25 mg. The samples were then kept in sealed containers containing 95% ethanol. Table 1 presents the genetic relationships among mammalian species included in this study (colour codes) via a phylogenetic dendrogram based on data mined from the NCBI GenBank of cytochrome b (CYTB) gene.
Scientific name, generic name, family, number of samples and tissue types. Each colour represents taxonomic classification according to the order of the animal.

DNA extraction
Whole blood samples and tissue samples were extracted from subjects to obtain genomic DNA using DNeasy Blood & Tissue Kits (QIAGEN GmbH, Hilden, Germany) following the manufacturer’s instructions. Collected samples were then separated into non-nucleated blood and tissue samples. For non-nucleated blood samples, 20 µl of 20 mg/mL proteinase K was added and the volume was adjusted with PBS until it reached 220 µl. The tissue samples were cut into small pieces and placed in 1.5 microcentrifuge tubes. Next, 180 µl of ATL buffer and 20 µl proteinase K were added. Samples were then mixed by being vortexed and incubated at 56°C until the tissue was completely lysed. Finally, a 50 µl standard elution volume was added two times in order to recover the DNA. The concentration, yield and purity values of the DNA were determined using a Beckman Coulter DU® 730 spectrophotometer (Beckman Coulter, CA, USA). DNA was kept at −20°C for further analysis.
ISSR primer screening
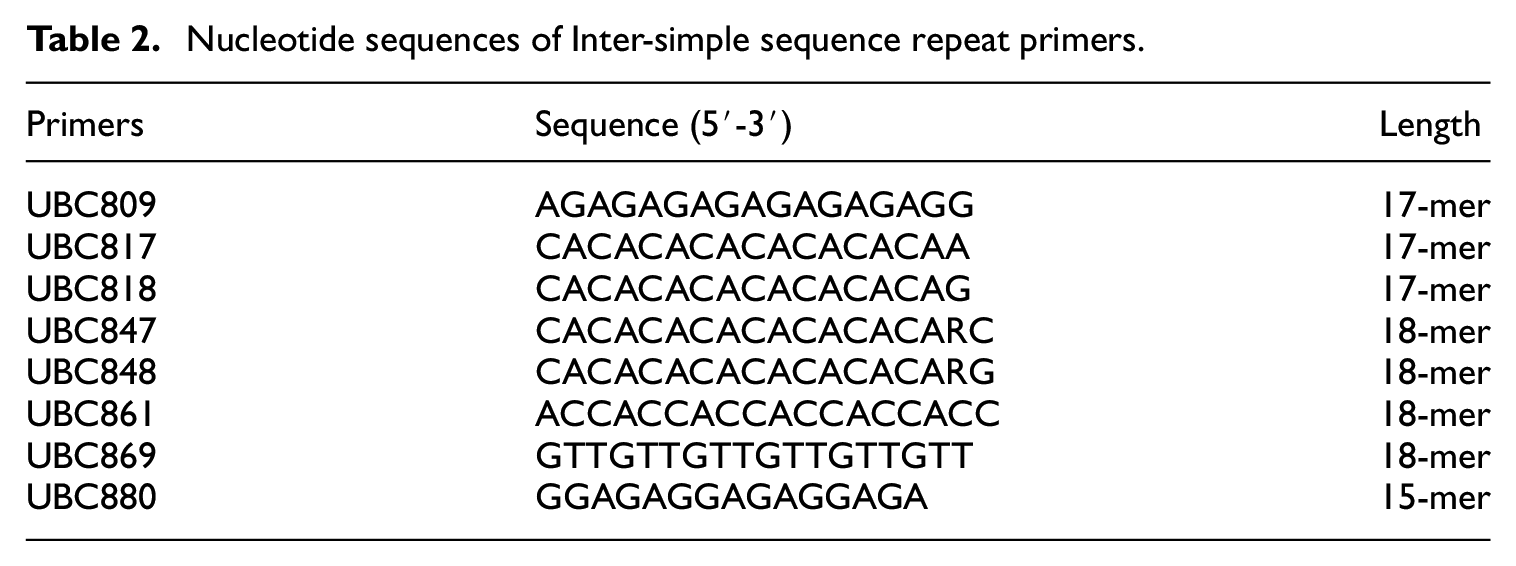
The ISSR technique was chosen to generate DNA fingerprints for various reasons, such as there is no requirement for DNA sequence information in this technique, only a single primer is needed, only a small amount of DNA is required and this technique is associated with a high degree of reproducibility. 15 The details pertaining to PCR reactions and temperature conditions for ISSR primer screening and gel electrophoresis have been reported in our previous studies. 26 We screened the 34 ISSR primer from the Microsatellite UBC primer set 9 obtained from the University of British Columbia (Table 2) using 38 samples acquired from each animal species to generate DNA fingerprints. PCR amplifications were performed in PTC-200 at DNA EngineThermal Cycler (Bio-Rad Laboratories, Inc., CA, USA) with five different annealing temperatures, specifically 55°C, 56°C, 57°C, 58°C and 59°C, respectively. The PCR products were then separated on 2% agarose gel by PowerPac 200 (Bio-Rad, CA, USA) at 120 V for 30 min. Lastly, the PCR products were then visualized by UV light under a GelMax 125 Imager (UVP, Cambridge, England).
Nucleotide sequences of Inter-simple sequence repeat primers.
ISSR-HRM
According to the preliminary primer screening employed to obtain an ISSR fingerprint, eight primers were used to generate the great DNA fingerprint pattern. In this experiment, these primers were adopted to generate a melting profile of the DNA fingerprints based on the ISSR fingerprints established by real-time PCR followed by HRM analysis. Accordingly, these were referred to as ‘ISSR-HRM’. The suitable eight ISSR primers that gave distinct DNA patterns among species from the ISSR primer screening process were chosen to create melting fingerprints using the ISSR-HRM method. Subsequently, real-time PCR was carried out at a final volume of 10°Cµl using a 1X SensiFastTM HRM kit (the EvaGreen® dye, dNTPs and enhancers) (Bioline, TN, USA), 0.5 µM ISSR primer and a 10 ng DNA template. Deionized water was added instead of the DNA template to establish a negative control.
ISSR-HRM was performed on PCRmax Eco 48 (PCRmax limited, Staffordshire, UK) following the protocol described by Kriangwanich et al. 26 During the amplification process, fluorescence data were collected at the end of each annealing cycle. HRM analysis was carried out after 37 real-time PCR cycles at temperature increments of 0.1°C/cycle and between the temperatures of 55°C and 95°C in order to generate high resolution melting curves. Melt curve profiles obtained from ISSR-HRM, normalized curves, difference curves and amplification curves were all generated using Eco software v5.2.12 (PCRmax) to identify any differentiations between the melting profiles of 38 mammalian species.
The normalized melting curves were generated by setting pre- and post-melt normalization regions in order to define temperature boundaries. 27 The melting curve for the negative derivative of fluorescence (F) over temperature (T) primarily displayed the Tm value with a normalized raw curve depicting the decreasing fluorescence and increasing temperature values. In this study the ‘melting fingerprint’, which is the melting profile of each species obtained from ISSR-HRM, displayed more than one peak that resulted from the presence of multiple loci produced from the ISSR primers. From this study, the theoretical interpretation of ISSR-HRM is that the mammals in different species would contribute distinctive sets of multiloci leading to different sets of melting peaks based on a single primer.
Accuracy testing
Thirty-five out-grouped individuals were tested from each mammalian species included in this study based on more than five samples including; four horses (Equus ferus caballus), four domestic sheep (Ovis aries), three domestic dogs (Canis lupus familiaris), three domestic pigs (Sus scrofa domesticus), three Bengal tigers (Panthera tigris), three domestic cats (Felis catus), three Asian palm civets (Paradoxurus hermaphrodites), three wild boars (Sus scrofa), three lesser mouse-deer (Tragulus kanchil), three Asian elephants (Elephas maximus) and three dugongs (Dogong dugon). Those 35 individuals were used as a template for species verification by ISSR-HRM. Six ISSR primers that were used to generate a ‘melting fingerprint’ from the ISSR-HRM technique were applied, and known DNA samples obtained from each species were used as references. Determination of the melting fingerprints were based on the Tm values of the melting peaks and melting patterns of each individual when compared with the references. Percent accuracy and precision were calculated using two-by-two confusion matrix. Statistics from program R version 3.5.1 and melting fingerprints were blind judged independently by two persons for greater accuracy and precision. Additionally, users who participated in the testing had not received any prior information on animal species in order to prevent human bias. The test was administered by employing only melting patterns and melting temperatures so that users could analyse the similarity and group the curves into 11 groups according to the 11 melting curve references that were given.
Results
ISSR-HRM primer screening
We screened 34 ISSR primers under five different annealing temperature conditions (55°C, 56°C, 57°C, 58°C and 59°C) and found that there were eight primers of UBC set 9 at an annealing temperature of 57°C. This outcome provided reproducible and informative results from 38 mammalian species after screening primers three times as shown in Supplemental Figure 1. These results were represented by reproducible bands in Alpaca (Vicugna pacos). Thus, eight ISSR primers were reassessed to generate ISSR fingerprints by real-time PCR followed by HRM analysis (ISSR-HRM).
Melting profiles
The results revealed that six out of eight primers, including UBC817, UBC818, UBC847, UBC848, UBC869 and UBC880, at an annealing temperature of 58°C were enabled to generate melting curves or ‘melting fingerprints’ obtained from the ISSR fingerprints of all 38 mammalian species. Each of the six primers demonstrated different ISSR fingerprints by PCR with multiple melting temperatures and melting peaks. Melting peak temperatures of 72, 65, 73, 71, 71 and 83 were obtained from UBC817, UBC818, UBC847, UBC848, UBC869 and UBC880, respectively among 38 mammalian species as is shown in Table 3. The results of the melting fingerprints of 38 mammalian species using six ISSR primers revealed that the number of distinguishable species of each primer were 100% based on different melting peaks or different ‘melting fingerprints’. The CYTB database mined from the NCBI GenBank (Table 1) indicated that 38 mammalians could be separated into 11 clusters, namely Artiodactyla, Perissodactyla, Eulipotyphla, Canivora, Pholidota, Lagomorpha, Proboscidea, Sirenia, Rodentia, Diprotodontia and Primates, according to species order. Furthermore, Artiodactyla were divided based on their sub-family into Caprinae, Antilope, Cervinae, Bovinae, Tragulidae, Suidae and Camelidae, while Canivora could be classified into the subfamily Canidae, Ursidae, Viverridae and Felidae. Callitrichidae and Cercopithecidae were the subfamily of the primates that were used to categorize 38 mammalian species into 11 groups.
Melting peaks present in the melting fingerprints of 38 mammalian species obtained from ISSR-HRM using six ISSR primers.
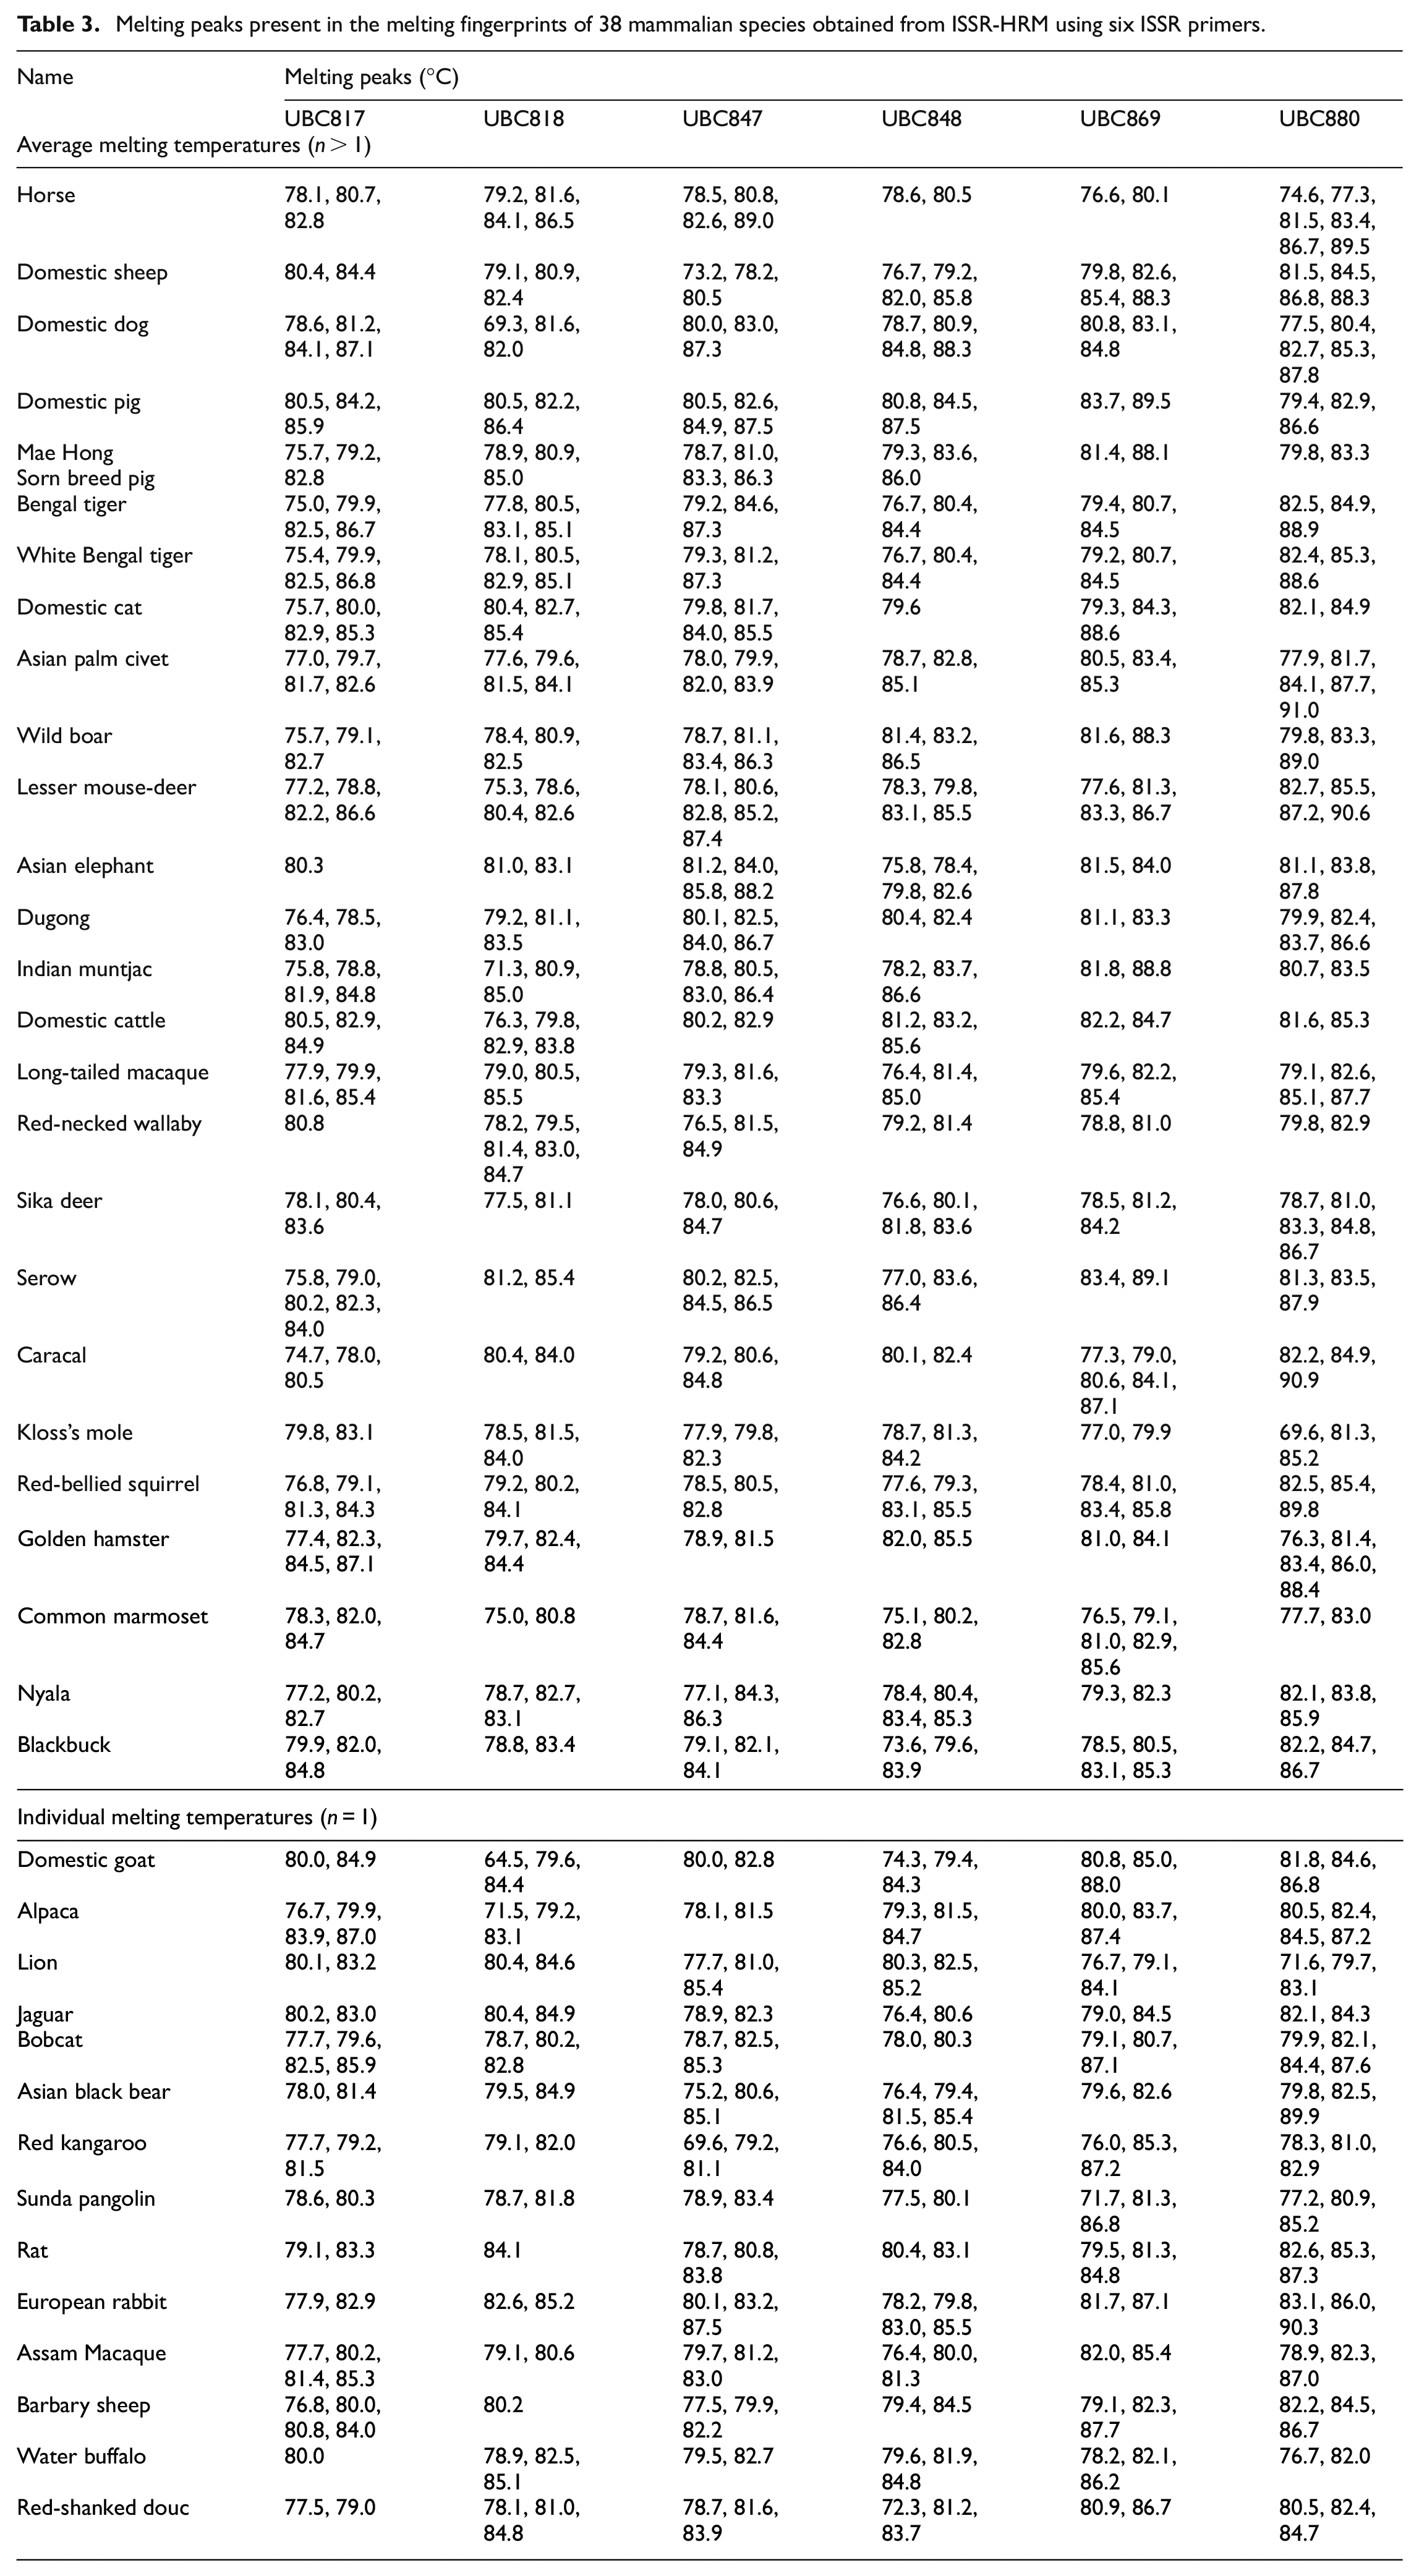
Serow (Capricornis sumatraensis), Blackbuck (Antilope cervicapra), domestic sheep, water buffalo (Bubalus bubalis), Nyala (Tragelaphus angasii), Barbary sheep (Ammotragus lervia), domestic cattle (Bos taurus), domestic goats (Capra aegagrus hircus), Sika deer (Cervus nippon), Indian muntjac (Muntiacus muntjak), wild boar, domestic pig, Alpaca and lesser mouse-deer were grouped together in the phylogenetic tree and were categorized in the order Artiodactyla as shown in Figures 1(a) to 6(a), which indicated that each of three Bovinae subjects that were included in this study had unique melting fingerprints obtained from six ISSR primers. Nonetheless, the melting patterns of the domestic goat and Barbary sheep were relatively comparable, but the melting temperatures differed between the two Caprinae species from every ISSR primers. In particular, the melting peak values obtained from the goat using UBC848 showed three representative melting peaks, 74.3°C, 79.4°C and 84.3°C, while Barbary sheep only showed two representative melting peaks at 79.4°C and 84.5°C. The melting fingerprints, especially Tm, obtained from most ISSR primers of domestic sheep, domestic goats, serow and Barbary sheep, were found to be precisely divergent from each other.
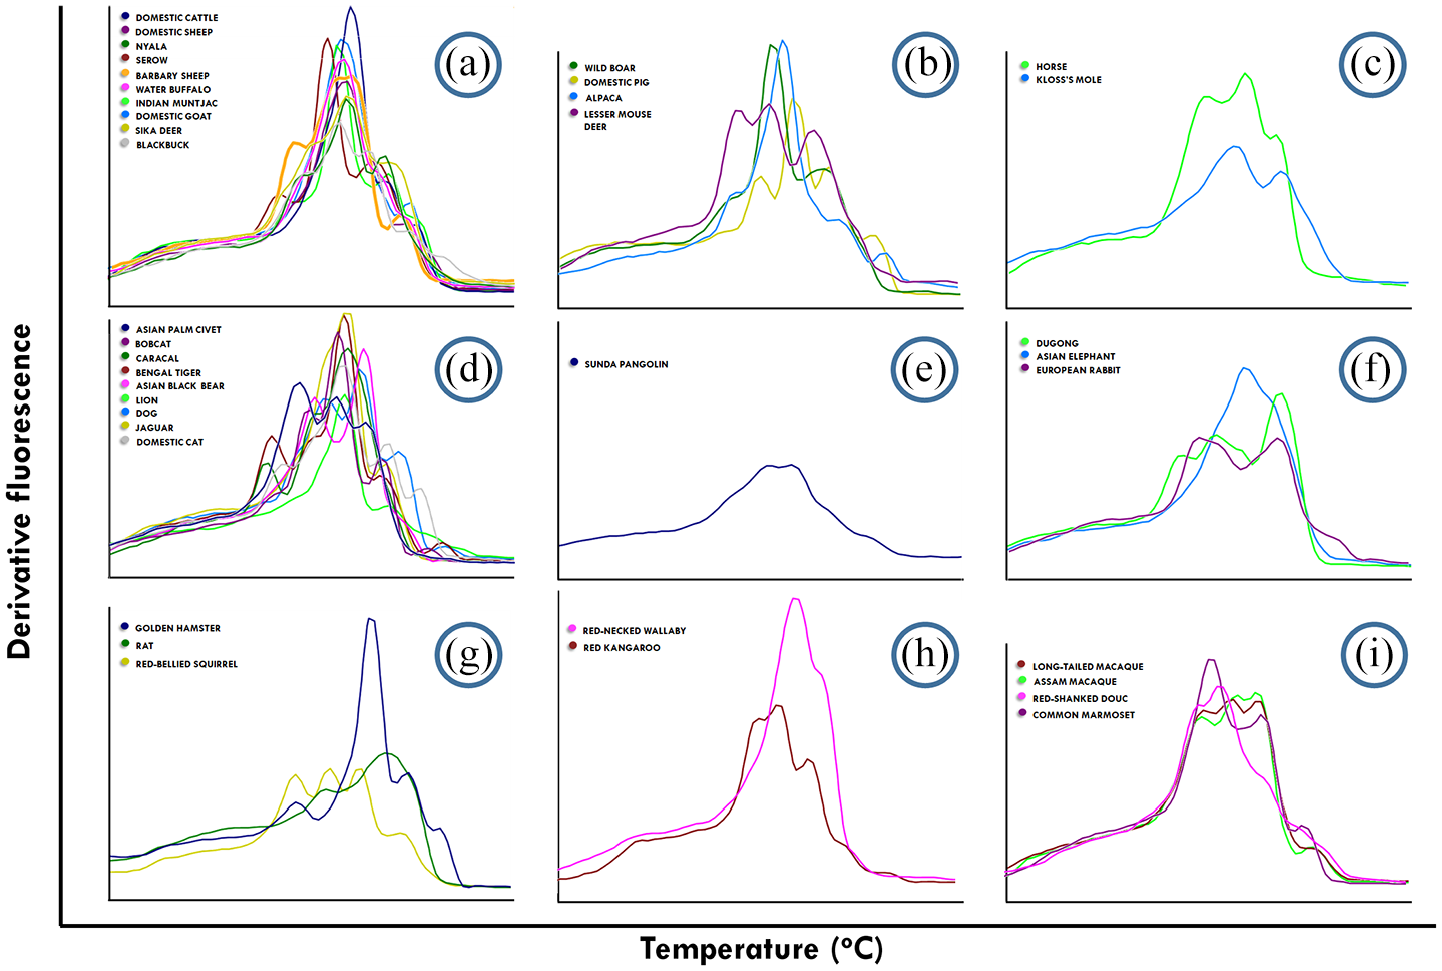
Melting fingerprints of 38 mammalian species derived from the ISSR-HRM method using UBC817 ISSR primers. (a–i) represent the clusters of each mammalian species in this study according to the phylogenetic dendrogram of CYTB. (a) Caprinae, Bovinae, Antilopinae and Cervinae, (b) Suidae, Camilidae and Tragulidae, (c) Equidae and Talipidae, (d) Canidae, Ursidae, Viverridae and Felidae, (e) Manidae, (f) Leporidae, Elephantidae and Dugongidae, (g) Sciuridae, Cricetidae and Muridae, (h) Macropodidae and (i) Callitrichidae and Cercopithecidae.

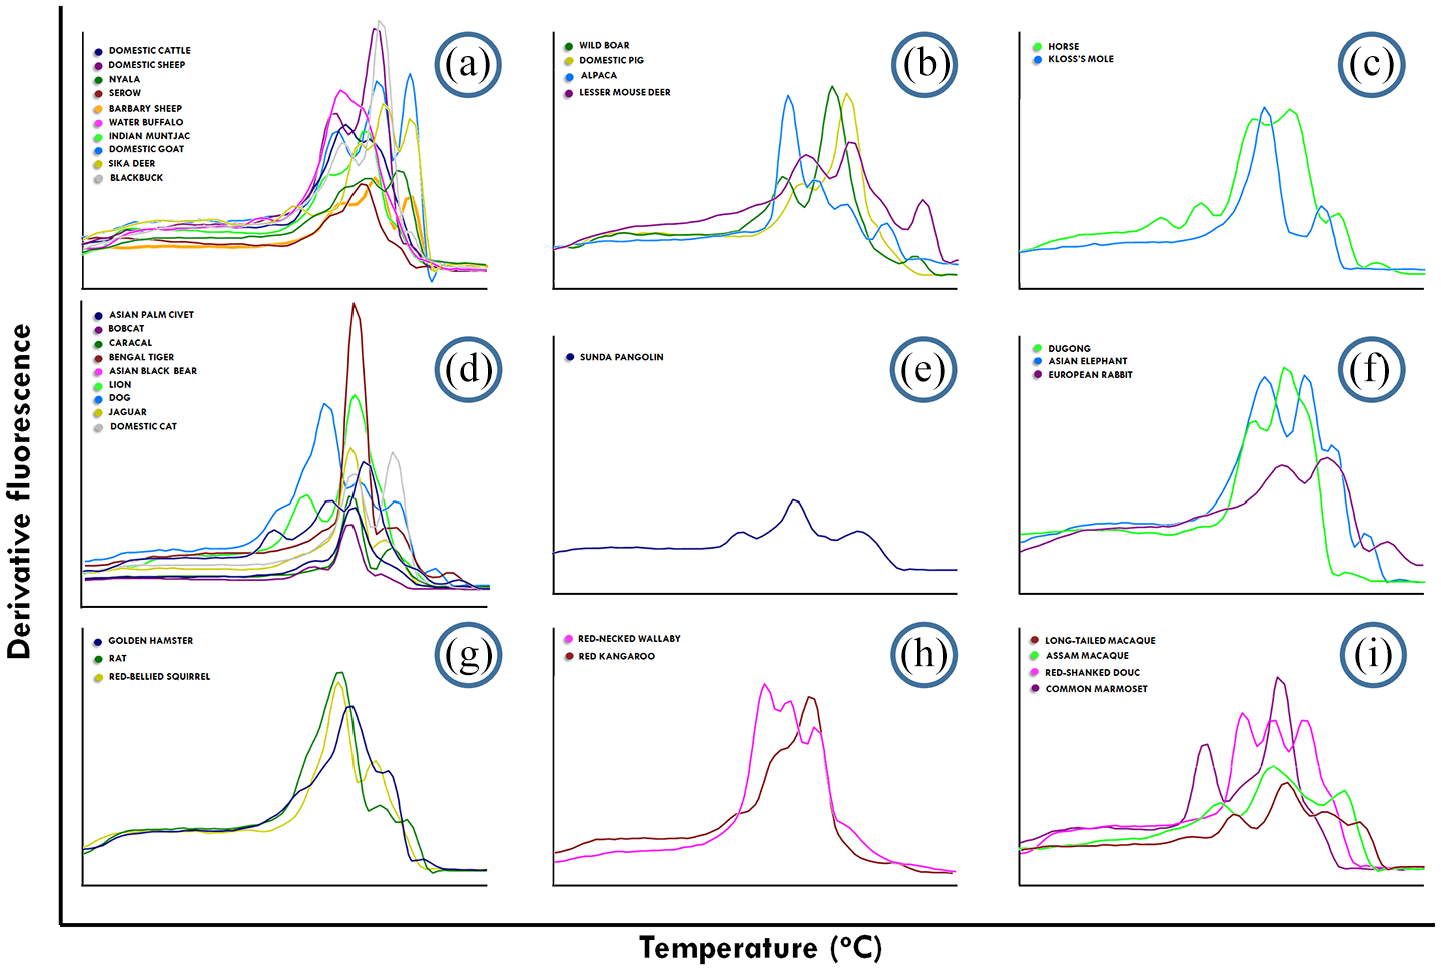
Melting fingerprints of 38 mammalian species derived from the ISSR-HRM method using UBC818 ISSR primers. (a–i) presents the clusters of each mammalian species in this study according to the phylogenetic dendrogram of CYTB. (a) Caprinae, Bovinae, Antilopinae and Cervinae, (b) Suidae, Camilidae and Tragulidae, (c) Equidae and Talipidae, (d) Canidae, Ursidae, Viverridae and Felidae, (e) Manidae, (f) Leporidae, Elephantidae and Dugongidae, (g) Sciuridae, Cricetidae and Muridae, (h) Macropodidae and (i) Callitrichidae and Cercopithecidae.

Melting fingerprints of 38 mammalian species derived from the ISSR-HRM method using UBC847 ISSR primers. (a–i) presents the clusters of each mammalian species in this study according to the phylogenetic dendrogram of CYTB. (a) Caprinae, Bovinae, Antilopinae and Cervinae, (b) Suidae, Camilidae and Tragulidae, (c) Equidae and Talipidae, (d) Canidae, Ursidae, Viverridae and Felidae, (e) Manidae, (f) Leporidae, Elephantidae and Dugongidae, (g) Sciuridae, Cricetidae and Muridae, (h) Macropodidae and (i) Callitrichidae and Cercopithecidae.

Melting fingerprints of 38 mammalian species derived from the ISSR-HRM method using UBC848 ISSR primers. (a–i) presents the clusters of each mammalian species in this study according to the phylogenetic dendrogram of CYTB. (a) Caprinae, Bovinae, Antilopinae and Cervinae, (b) Suidae, Camilidae and Tragulidae, (c) Equidae and Talipidae, (d) Canidae, Ursidae, Viverridae and Felidae, (e) Manidae, (f) Leporidae, Elephantidae and Dugongidae, (g) Sciuridae, Cricetidae and Muridae, (h) Macropodidae and (i) Callitrichidae and Cercopithecidae.

Melting fingerprints of 38 mammalian species derived from the ISSR-HRM method using UBC869 ISSR primers. (a–i) presents the clusters of each mammalian species in this study according to the phylogenetic dendrogram of CYTB. (a) Caprinae, Bovinae, Antilopinae and Cervinae, (b) Suidae, Camilidae and Tragulidae, (c) Equidae and Talipidae, (d) Canidae, Ursidae, Viverridae and Felidae, (e) Manidae, (f) Leporidae, Elephantidae and Dugongidae, (g) Sciuridae, Cricetidae and Muridae, (h) Macropodidae and (i) Callitrichidae and Cercopithecidae.
Melting fingerprints of 38 mammalian species derived from the ISSR-HRM method using UBC880 ISSR primers. (a–i) presents the clusters of each mammalian species in this study according to the phylogenetic dendrogram of CYTB. (a) Caprinae, Bovinae, Antilopinae and Cervinae, (b) Suidae, Camilidae and Tragulidae, (c) Equidae and Talipidae, (d) Canidae, Ursidae, Viverridae and Felidae, (e) Manidae, (f) Leporidae, Elephantidae and Dugongidae, (g) Sciuridae, Cricetidae and Muridae, (h) Macropodidae and (i) Callitrichidae and Cercopithecidae.
Sika deer and Indian muntjac are classified in the Subfamily Cervinae but in different genus. For Cervus and Muntiacus, the melting pattern and melting peaks were not associated with any of the six screened ISSR primers obtained from this study. Lesser mouse-deer, Alpaca domestic pig and wild boar also displayed distinguishable melting fingerprints (Figures 1(b)–6(b)). Moreover, the domestic pig and wild boar could be separated from each other by melting peak temperatures. Interestingly, ISSR-HRM analysis was able to separate and identify some mammalian species that shared a subspecies from the Tm temperature of the melting peaks, such as in the wild boar and domestic pig as is shown in Figure 7. In addition, the melting fingerprints of the Thai native breed and the Mae Hong Sorn breed were similar to that of the wild boar, while domestic pigs showed different melting fingerprints. Additionally, horses revealed unique melting fingerprints and melting temperatures in every ISSR primer as well as did Kloss’s moles (Euroscaptor klossi) as shown in Figures 1(c) to 6(c)).

Melting fingerprints of the Mae Hong Sorn domestic pig breed, commercial domestic pig and wild boar derived from UBC817 and UBC848. Red lines represent each melting peak of the melting fingerprints. (a–c) indicate the melting peaks generated from UBC848 and (d–f) indicate the melting fingerprints generated from UBC817.
Figures 1(d) to 6(d) depict the order Canivora, which includes the Bengal tiger, jaguar (Panthera onca), lion (Panthera leo), domestic cat, bobcat (Lynx rufus), caracal (Caracal caracal), black bear (Ursus thibetanus), domestic dog and Asian palm civet. In contrast to when the genotype is used to determine a physical appearance or phenotype, the melting fingerprints of the Bengal tiger were not different from the normal Bengal tiger and the white Bengal tiger. Nevertheless, the melting patterns and Tm values were different when compared with Panthera spp., which included the Bengal tiger, the jaguar and the lion. The Panthera spp. has a very similar morphological profile to the domestic cat; however, according to the results of the melting fingerprint and melting peak temperatures, a particular distinction was observed between the Bengal tiger, jaguar, lion and domestic cat. Meanwhile, melting fingerprints and Tm values indicated that the Felidae, Caracal and Bobcat were individual species. In addition, the melting fingerprints of the domestic dog, Asian black bear and Asian palm civet obtained from six ISSR primers could be differentiated from each other. The Sunda pangolin (Manis javanica) was clustered in one single cluster, while the melting curves presented in Figures 1(e) to 6(e) were different in each primer. Likewise, the cluster of the European rabbit (Oryctolagus cuniculus), Asian elephant and dugong that were grouped together in the phylogenetic dendrogram of this study, revealed a diverse range of melting fingerprints (Figures 1(f)–6(f)).
When analysing the melting patterns among Rodents or order Rodentia, as is shown in Figures 1G–6G, the melting fingerprints were unique between the Red-bellied squirrel (Callosciurus erythraeus), the Golden hamster (Mesocricetus auratus) and the common rat (Rattus rattus) according to all ISSR primers. The melting fingerprints of Marsupials (Macropodidae) and Primates (Callitrichidae and Cercopithecidae) are presented in Figures 1(h) to 6(h) and 1(i) to 6(i), respectively. The Red kangaroo (Osphranter rufus) and Red-necked wallaby (Macropus rufogriseus) share the same genus; however, the melting peaks were different in all ISSR primers. For example, the Tm values or melting peaks obtained from UBC 848 were 79.2°C and 81.4°C in the Red kangaroo, but were 76.6°C, 80.5°C and 84.0°C in the Red-necked wallaby. The Old world monkey (Cercopithecidae), including the Long-tailed macaque (Macaca fascicularis), the Assam macaque (Macaca assamensis) and the Red-shanked douc (Pygathrix nemaeus) shared fairly similar melting patterns, but displayed distinctive melting peaks obtained from all six ISSR primers employed in this study. In addition, Macaca spp. revealed highly related melting fingerprints. The Common marmoset (Callithrix jacchus) is considered a new world monkey (Callitrichidae) in the order of Primates and revealed a particularly noticeable melting fingerprint. These included five melting peaks at 76.5°C, 79.1°C, 81.0°C, 82.9°C and 85.6°C generated by UBC869, while other primates displayed only two or three melting peaks.
Accuracy and precision testing of ISSR-HRM
In the present study, the ISSR-HRM method established in this present study was used to aid in species identification with the use of six ISSR primers to generate melting fingerprints. The accuracy testing of this assay was performed with the use of out-grouped samples which were chosen from 11 mammalian species, as has been mentioned in the Materials and Methods section. This method could be employed without any need for prior recognition of the species by inspectors. Our results revealed that the UBC848 ISSR primer had a 100% degree of accuracy, in which both inspectors could distinguish all random individual samples into 11 corrected mammalian species (Table 4). Furthermore, the UBC847 ISSR primer was the least precise with a 78.79% degree of accuracy, while the other ISSR primers, UBC817, UBC818, UBC869 and UBC880, displayed degrees of accuracy at 90.91%, 83.33%, 96.97% and 84.09%, respectively. Moreover, the domestic dog, domestic cat and Asian elephant were identified successfully at 100%, while the lesser mouse-deer was misclassified most frequently. The degree of precision from every primer and animal species was calculated and showed a 100% degree of precision.
Percentage of accuracy and precision rate of each primer.

Discussion
The method reported here reliably identified 38 mammalian species using the ISSR-HRM analysis of nuclear DNA extracted from blood and tissue samples. One of the highlights of this study is that the melting fingerprints derived from the ISSR-HRM technique could potentially be used as a selective tool for facilitating species discrimination of wildlife mammalian species. This could be accomplished with a high degree of accuracy at crime scene investigations in the surveillance of illegal wildlife trading and poaching.
The HRM method employed for the detection of various DNA samples by real-time PCR has been used to discriminate between species in wildlife forensic sciences. 23 In this study, rather than using expensive analysis methods based on specific fluorescent probes, immediate post PCR melting analysis by HRM was employed to offer a quick and cheap alternative tool that does not require the use of sophisticated equipment or experts. This method also offers various other advantages, such as; (i) the PCR run analysis performance enables high-throughput screening while avoiding cross-contamination due to the presence of a closed-tube reaction, (ii) it provides an estimate of the target DNA relative concentration, (iii) the combined ISSR-HRM analysis method is thus a quantitative and qualitative approach and (iv) melting fingerprints could be automatically generated using software to prevent any potential bias in the interpretation of the data.24,28 In accordance with a number of other benefits, this screening method has a reasonable cost, and is fast and easy to handle. It is also associated with a reliable degree of data interpretation.24,29,30 Additionally, correct species identification could be difficult or impossible to achieve based on the remains of morphological features obtained from small amounts of samples materials, such as the remains of organs, meat, bones, nails, hair and blood stains identified in wildlife crime investigations. Therefore, the examination of DNA remains a fundamental aspect of species investigation, while its application must rely on alternative methods that demand a minimum of procedures and low cost but can still contribute to the important task of accurate species identification. 31
The results obtained from six ISSR primers, UBC817, UBC818, UBC847, UBC848, UBC869 and UBC880, as nuclear DNA could be used to effectively discriminate between every mammalian species included in this study. Even better degrees of segregation can be expected from the A/T to G/C changes or %GC composition. In addition to changes in A/T to T/A and G/C to C/G, the changes of two or three hydrogen bonds can lead to differences in Tm values between 0.8°C and 1.4°C in small amplicons.23,32 Therefore, this effect could be one reason for the success of the individual melting fingerprints employed in this study. Also, many factors can affect the melting behaviour, by the type of base substitution, the position of the base substitution, the neighbouring DNA of the base substitution and the fact that %GC are the major factors affecting the melting behaviour of each amplicon, all of which can lead to differences in melting shapes.19,33,34
PCR-based methods for animal species identification using a universal primer PCR assay for simultaneous identification of animal species with variable lengths of mtDNA, such as cytochrome b and cytochrome c oxidase subunit I (COI), have been successful in the identification of mammalian species including those in the Artiodactyla order.35,36 Furthermore, the Bovinae subfamily was divided into three main tribes, which are Tragelaphini, Boselaphini and Bovini. 37 Phylogenetic reconstruction and identification within the Bovini subfamily have been associated with some difficulties in resolving interspecific relationships, but Bubalus spp. and Bos spp. revealed a strong degree of separation between these two genera. 38 Therefore, the melting fingerprints obtained from this study can be used to separate Nyala, water buffalo and domestic cattle into three unique patterns in relation to the findings of a previous study. In addition, Barbary sheep were distinct from other ovicaprines and were no more closely related to domestic sheep than to domestic goats. 39 Some characteristics of the Barbary sheep suggest a degree of affinity to the domestic sheep and share some degree of affinity to other goats. In particular, the Barbary sheep had five distinctly domestic sheep-like biochemical characters, five domestic goat-like characters, seven characters in common with both species and 10 unique characters. 40 The phylogenetic tree showed a closer degree of relationship exists between domestic goats and Barbary sheep than Barbary sheep and domestic sheep. This outcome is similar to the results achieved with the melting fingerprints obtained from the ISSR-HRM results, in which the melting patterns of the domestic goat and Barbary sheep were more comparable than those of the domestic sheep.
Ungulate species were identified using 12S rRNA coupled with HRM with species-specific primers. The findings revealed fragments of different length and thus different melting behaviours or patterns for each species. 24 In this study, six ISSR primers were combined with quantitative real-time PCR resulting in different melting behaviours or melting fingerprints for each of the 13 ungulate species (Artiodactyla). Moreover, our findings revealed that the similarity of the melting fingerprints between Thai indigenous breeds, the Mae Hong Son breed, and the wild boar was higher than when compared to that of the commercial domestic pig. For example, melting peak temperatures from UBC817 were relatively similar between the Mae Hong Son breed and the wild boar, respectively. Meanwhile, the melting peak temperature of the commercial domestic pig exhibited a significant difference from both the Mae Hong Son breed and the wild boar. Therefore, the Mae Hong Son native pig breed displayed a lower superior value of genetic diversity parameters, which were also comparatively lower than in some of the commercial pigs and crossbreds. It was also notable that the genetic distance among the Thai wild boar and the Duroc or commercial pig was lower than of the Mae Hong Son indigenous breed. 41 Additionally, the morphology of the Mae Hong Son indigenous breed was found to be more comparable to the wild boar in terms of its short body and small head. It was also similar in length to the wild boar. However, some had white hair in the middle of their face but were mostly black with white bellies and slightly arched backs. They were also observed to have flabby bellies with moderately wide shoulders and hips.42,43
In the genus Panthera spp., PCR-RFLP of cytochrome b was used to classify tigers among different species, and the approach was proven to be an easy method of identification for tigers and leopards when using difficult sources of DNA such as feces. 44 However, the melting fingerprints of the Bengal tiger were not different from those of the normal Bengal tiger and the white Bengal tiger in five out of six ISSR primers, namely UBC817, UBC818, UBC848, UBC869 and UBC880. This might have happened because the mutation did not occur at the sequence of the amplified region from five ISSR primers of the white Bengal tiger and the orange Bengal tiger resulting in a similar melting curve.
All extant marsupials are endemic to Australian and the Americas and share the distinctive characteristic in which the young are carried in the pouch of the mother. The most species-rich group of macropodids that exploit these more open mesic to semiarid habitats is the genus Macropus. This group can be further divided into three subgenera, notably Notamacropus (wallabies), Ospharnter (red kangaroos and wallaroos) and Macropus (grey kangaroos). 45 From a previous study, the presence of mtDNA and nuclear DNA could result in a strongly significant incongruence between individual nuclear genes of the separated Red kangaroo and red-necked wallaby species into two different clusters. 46 This might be the reason for the two distinct melting fingerprints observed in this study. In the genus Macaca spp., five species of macaque are indigenous to Thailand, which include the long-tailed macaque and the assam macaque. 47 The similarity of these species with minor differentiations in the melting fingerprints might be related to the morphological characters of each of the species and subspecies of the macaques. Notably, the long-tailed macaque species can be identified by the species-specific characteristic of a relative tail length >100%, while assam macaques have a relative tail length of 35%–65%. However, with the presence of certain slight dissimilarities, assam macaques have often been misidentified as rhesus macaques and long-tailed macaques in some regions of northern Thailand.48,49
However, the ISSR-HRM technique for species identification still presents some limitations, especially in terms of the genetic variations that exist in different populations of the same organism or animal. This outcome could have an influence on their genetic fingerprinting resulting in differences among each population. This effect could have created a discrepancy in the melting fingerprints as well. For example, Asian elephants that are raised in different camps may also display differences in the genetic fingerprints obtained from ISSR markers. 26 Therefore, in this study, the ISSR-HRM technique might produce slight variations in the melting fingerprints obtained from individual and different Asian elephant specimens. Nevertheless, the melting peak temperatures between individual elephants were only marginally different at 0.1°C. This might have occurred as a result of a number of other factors and certain variations that were influential during the process, such as DNA quality, DNA template sequence in complement to the primer, use of the pipetting technique, different batches being prepared in the master mix and small changes in the environmental factors that arose from each real-time PCR reaction including cation concentration, pH, ionic force, etc. 50
Conclusion
In conclusion, our results demonstrate that ISSR-HRM analysis could serve as an effective tool for the species identification of wildlife mammalians at the species or subspecies level based on unique melting fingerprints. However, reference controls must be recorded throughout the process in order to best facilitate data interpretation. 51 In this manner, once a species is clearly indicated, only the appropriate animal group would need to be analysed. Universal ISSR analysis could also provide a functionally initial overview and serve as a potentially constricted molecular tool for species identification.52,53 ISSR-HRM was proven to be a selective tool that could easily be used in laboratories and might also be useful in wildlife crime forensic investigations. However, some of the sample numbers have indicated the possibility of the existence of certain limitations. For example, we had access to only one sample for some mammalian species; nevertheless, these samples still revealed certain differentiations among the species. Therefore, an evaluation with a higher number of samples per species may be required in further studies. Additionally, increasing numbers of mammalian species should be used in future studies in order to develop a robust database for species identification and discrimination for use in wildlife crime investigations.
Supplemental Material
sj-docx-1-sci-10.1177_00368504211026163 – Supplemental material for Mammalian species identification usingISSR-HRM technique
Supplemental material, sj-docx-1-sci-10.1177_00368504211026163 for Mammalian species identification usingISSR-HRM technique by Wannapimol Kriangwanich, Korakot Nganvongpanit, Kittisak Buddhachat, Puntita Siengdee, Siriwadee Chomdej, Siriluck Ponsuksili and Chatchote Thitaram in Science Progress
Footnotes
Acknowledgements
We would also like to thank all of veterinarians who helped with the blood and tissue collection processes employed in this study.
Author contributions
Wannapimol Kriangwanich: Methodology, Validation, Formal analysis, Investigation, Data Curation, Writing Original Draft; Korakot Nganvongpanit: Conceptualization, Resources, Writing, Review & Editing, Supervision and Project Administration,; Kittisak Buddhachat: Data Curation, Writing, Review & Editing; Puntita Siengdee: Resources, Data Curation, Writing, Review & Editing; Siriwadee Chomdej: Supervision; Siriluck Ponsuksili: Supervision; Chatchote Thitaram: Supervision, Project Administration, Writing, Review & Editing.
Declaration of conflicting interests
The author(s) declared no potential conflicts of interest with respect to the research, authorship, and/or publication of this article.
Funding
The author(s) disclosed receipt of the following financial support for the research, authorship, and/or publication of this article: Financial support for this study was provided by the Royal Jubilee Ph.D. Program, Thailand Research Fund (TRF), Faculty of Veterinary Medicine, Chiang Mai University, Thailand (R000022228). Additional support was obtained from Chiang Mai University through the research administration office which provided necessary budget via the Excellence Center in Veterinary Bioscience (ECVB), Chiang Mai University, Thailand.
Supplemental material
Supplemental material for this article is available online.
Author biographies
References
Supplementary Material
Please find the following supplemental material available below.
For Open Access articles published under a Creative Commons License, all supplemental material carries the same license as the article it is associated with.
For non-Open Access articles published, all supplemental material carries a non-exclusive license, and permission requests for re-use of supplemental material or any part of supplemental material shall be sent directly to the copyright owner as specified in the copyright notice associated with the article.