
Abstract
The aquatic ecosystem is under increasing pressure from environmental contaminants due to anthropogenic activities. This study investigated the potential of glyphosate and paraquat to induce DNA damage and other cell abnormalities in juvenile African Catfish, Clarias gariepinus. Juvenile fish were exposed for 96 h to 0.36, 0.48, 0.60, 0.72 and 0.84 mg/L glyphosate; and 0.018, 0.037, 0.055, 0.110 and 0.221 mg/L paraquat. Following the exposure, the fish liver and blood were analysed for DNA damage and micronucleus respectively. DNA damage was analysed using comet assay while the micronucleus test was used for assessing nuclear abnormalities. Both herbicides induced DNA damage in fish, with paraquat exhibiting higher toxicity. The severity in liver DNA damage was observed to be dependent on concentration. The herbicides triggered formation of micronuclei, bean-shaped cells, lobed nuclei, and apoptosis in blood cells of fish. Both herbicides also increased the frequency of occurrence of these cell abnormalities in erythrocytes and showed mutagenic potential in fish. Glyphosate and Paraquat both have mutagenic potentials in fish and this is a reflection of the threat these contaminants pose to fish and other forms of aquatic life in our natural water bodies. Low concentrations of these herbicides should be encouraged when usage is inevitable
Introduction
The environment is under constant threat due to increasing human population, intensive agriculture, industrialization and urbanization. Over-exploitation of natural resources have further aggravated these environmental problems. Ultimately, these activities have tremendously impacted the aquatic environment. Fortunately, in the last few years, humans have begun to realize past mistakes and efforts are being made to reverse the trend. However, more effort in securing the environment is a sine-qua non so that man’s existence is not overly threatened. 1
A great number of the Nigerian populace are into agriculture, the vocation accounting for a portion of the nation’s gross domestic product (GDP). In recent times, as stakeholders in issues concerning the environment continue to mount pressure on government, policies that deter bush burning, due to its attendant risk and negative impact on the environment have been initiated. In response, farmers and households have switched to the use of herbicides and other chemicals as their primary means of clearing lands, and for the control of seasonal weeds and unwanted plants. 2 Paramount in this group of herbicides are glyphosate and paraquat, which have been shown to be quite effective in protecting arable crops against early competition from annual grasses and in controlling broadleaved weeds. 3
Glyphosate, the active ingredient in Roundup® formulations, is a post-emergent and non-selective herbicide. It is widely used in many areas of agriculture for destroying and controlling herbaceous plants in lakes, canals, paddy fields, slow moving water, and fish ponds. Glyphosate generally has a short half-life and binds strongly to sediment particles. Environmental concentrations of this chemical can vary very widely. Concentrations of this chemical in surface waters between 10 and 328 μg/L have been reported.4–6 In waters close to a soyabean cultivation area, concentrations between 0.1 and 0.7 mg/L were reported, 7 while Edwards et al. 8 reported 5.2 mg/L glyphosate in runoff. Glyphosate, may cause ecological imbalance, and eventually damage haematological, oxidative and metabolic parameters of non-target organisms. 9
Paraquat is also a non-selective herbicide. It is the active ingredient in the formulation of Paraforce®. It is a common contact herbicide, for controlling aquatic plants, vegetative pests and terrestrial weeds. It has been reported to be present in many waters of the world. 10 Paraquat acts very fast and has little bioavailability to crops. Ikpesu 11 reported paraquat concentrations of 0.004 mg/L from the Warri basin in Nigeria. Thi Hue et al. 12 reported paraquat contentration of 0.134 mg/L in some streams from Northern Vietnam.
The direct chemical analyses of water and sediment in environmental monitoring programs is a function of the methods of measurements available and excludes the capability to foretell the toxicity of complex chemical mixtures. 13 In spite of the establishment of limits by manufacturers when herbicides are being applied, herbicide concentrations are being measured in the aquatic environments well beyond the level permitted by law. 14 Fishes are important bioindicators of environmental toxicity due to their sensitivity in evaluating ecological risks posed by xenobiotics.15,16 Evaluating the adverse effects of pesticides on fish species has become very important due to the ecological and economic importance of fish. 17
Different toxic endpoints and different fish species have been employed to evaluate the toxicity of these pesticides. Previous literature reported the ability of these herbicides to damage liver cells and induce certain enzymatic responses in Clarias gariepinus, and also to disrupt normal fish behaviour and physiology under the same treatment conditions.18,19 A major occurrence in cells exposed to toxic chemicals is DNA damage. Nucleotide sequence can be altered when DNA lesions occurs at specific sites of the gene, setting off the process of mutation and some other cellular responses. 20 Singh et al. 21 describes the Comet Assay as a sensitive, easy, well accepted method in measuring different DNA lesions like single, double strand breaks and alkali-labile sites in single cells. Furthermore, the micronucleus assay is used to detect chromosomal damage in once-divided bi-nucleated cells, which contain micronuclei and other cellular abnormalities. The frequency in the occurrence of micronuclei is a reflection of cytotoxicity indicating breakage in chromosome and/or total chromosome loss. 22
In Nigeria, glyphosate and paraquat are being continually applied on farmlands for high crop yield. The toxicity of glyphosate on Heterobranchus bidorsalis fingerlings was investigated by Aghoghovwia and Izah. 23 The phyto-toxic effects of glyphosate on onions has also been reported. 24 Similarly, Babarinsa et al. 25 studied the degree of usage of paraquat in Oyo state Nigeria. Akinloye et al. 26 studied the mode of action of paraquat in paraquat-contaminated vegetables.
The African catfish is an important fish in Nigeria. It is highly prized by both farmers and consumers and distributed throughout all freshwater ecosystems. It is also being widely used as a sentinel organism in toxicity studies. Hence, this study was conceived to examine the toxicity of acute concentrations of two commonly used herbicides in the African catfish, Clarias gariepinus using the micronucleus test and comet assay.
Materials and methods
Sample collection and maintenance
Three hundred and sixty C. gariepinus juveniles were purchased from a fish farm in Ota, Ogun State, Nigeria and averaged 3.94 ± 1.51 g in body weight and standard body length of 7.35 ± 2.33 cm. The fish samples were taken in aerated jerry cans containing water from the fish farm into fish tanks in the laboratory and allowed to go through a 2-week acclimatization period in dechlorinated water. Fishes were fed twice a day with pelleted diet containing 35% crude protein at 4% body weight during this period. Adaption to laboratory conditions by the fishes was believed to have been achieved when death at less than 5% was recorded and feeding was discontinued 24 h prior to the onset of the experiment.
Test solutions and in vivo fish exposure
Commercial formulations of glyphosate and paraquat were purchased from an outlet in Lagos, Nigeria. The commercial formulations used in this study were Roundup®, formulated as 360 g per litre of glyphosate and Paraforce®, formulated as 480 g per litre of paraquat. Acute renewal bioassay, according to OECD guidelines No 203 27 was carried out in the laboratory, to determine the toxicity of both herbicides to C. gariepinus. After the acclimatization period, five test nominal concentrations, 0.36, 0.48, 0.60, 0.72 and 0.84 mg/L glyphosate, and 0.018, 0.037, 0.055, 0.110 and 0.221 mg/L paraquat, were dissolved in study tanks of 150 L capacity, holding dechlorinated water. These concentrations were chosen after a series of range finding tests while also taking note of the highest environmental concentrations reported in literature for both herbicides. A negative control (0.00 mg/L) and a positive control (PC), 5 mg/L cyclophosphamide were also set up simultaneously with the treatment concentrations. 28 The large tanks were further connected via PVC pipes to three small 25 L treatment tanks each containing 10 fish, that is, three replicates, making a total of 30 fishes per concentration. Exposure was done only once under the conditions of 12:12 h light:darkness and fish response was regularly checked within 96 h. In the course of the experiment, mortality was observed and recorded. Water physicochemical parameters were monitored twice daily in the course of the experiment to ensure they were within permissible range. At the end of 96 h, fishes were sacrificed and their livers excised.
Micronucleus (MN) assay
After the exposure period, heparinized microcapillary tubes were used to collect blood specimens from three fish in each treatment group and the control via the caudal vein. With some modification, micronucleus assay in the blood cells of fish was conducted according to the protocol described by Udroiu. 29 The blood of fish was smeared onto pre-cleaned slides in duplicates. The blood was smeared onto the slides to produce even blood smear distribution, fixed at room temperature in methanol for 15 min, air-dried, stained in phosphate buffer solution with 10% Giemsa, washed twice and mounted. Cells that had been evenly spread on the pre-cleaned slides were observed for micronucleus scoring. Between 5000 and 8000 erythrocytes for each concentration were observed using a light microscope (Eclipse E200, Nikon) fitted with a camera for micronuclei analysis. The numbers of clear and characteristically shaped micronuclei (MN) in the blood cells were observed (1000×) counted and converted to frequencies. Other abnormally shaped cells counted included bean-shaped cells (BSC), lobed nuclei (LN) and fragmented apopototic cells (FAC). Cells that were scored were separate, easily distinguishable and of almost equal size according to the criteria introduced by Fenech. 30 The frequency of the occurrence of micronuclei was calculated as and shown as a percentage.
Comet assay
To measure the genotoxicity of glyphosate and paraquat, alkaline comet assay using a Trevigen Comet Assay Reagent Kit, USA was employed. Fish liver was cut into small pieces, allowed some time (about 5 min to settle) and the liquid medium was removed. To a solution of 1× phosphate buffered saline (PBS), 1–2 mL of ice cold 20 mmol/L ethylenediaminetetraacetic acid (EDTA) was added and tissue was further macerated into smaller pieces and left for about 5 min. The cell suspension was retrieved, taking care to avoid transfer of debris. After counting, cells were pelleted and suspended in 1× PBS (free of calcium and magnesium ions) at 1 × 10⁵ cells/mL. Cells were combined with molten low melting agarose, at 37°C, 1 × 10⁵/mL and at a ratio of 1:10 (v/v). From this cell suspension, 50 μL was thereafter pipetted onto CometSlide. Agarose containing the cells was spread to cover the entire sample area with the help of a pipette tip. Slides were then placed flat in the refrigerator for 10 min at 4°C. Thereafter, the slides were transferred into Lysis Solution at 4°C overnight. Following this, Alkaline Unwinding Solution was freshly prepared at pH>13, and the slides (after draining excess buffer from them), were immersed in this solution. They were left to stay in Alkaline Unwinding Solution at 4°C for 1 h. The slides were made to pass through electrophoresis in an electrophoresis solution at 21 volts for a period of 30 min. Excess electrophoresis solution was also lightly removed from the slides, immersed twice in deionized water for 5 min each, and in 70% ethanol for 5 min. Samples were dried for 10–15 min at 37°C for easier observation. On each observed circular dried agarose, 100 μL of diluted SYBR green was spread and stained for about 30 min in the dark at room temperature. Excess SYBR green solution on the slides were gently drained away and briefly rinsed in water. The slides were completely dried at 37°C and observed under a fluorescence microscope (Leica DMLS Germany). Three fish per concentration were observed (400×). Two slides were prepared for each fish specimen, 20 cells per slide, and a total of 120 cells were randomly scored for each concentration and analysed using the Comet IV Computer Software (Perceptive Instruments, UK). DNA damage was defined as the percentage of DNA in tail.
Analysis of data
Statistical analyses were performed using statistical software SPSS 20. Assumption of normality and homogeneity of variances were tested for graphically and by Levene’s test. One-way analysis of variance (ANOVA), was used to analyse data for the control and treated groups while Duncan Multiple Range Test was used to compare between the means. All data were considered significant at p < 0.05.
Results
The average physico-chemical parameters (temperature, pH and dissolved oxygen) of water, into which the pesticide concentrations were administered, were measured to be between 26.8°C and 27.4°C, 7.0–7.5 and 3.62–3.68 mg/L respectively 31 both herbicides. These values were within the range recommended for aquaculture except for dissolved oxygen. This probably is an indication of the effect of the herbicides in water, polluting and therefore reducing the dissolved oxygen content
The probit values and mortality for fishes exposed to acute concentrations of the two herbicides are shown in Tables 1 and 2 respectively. It was observed that for both herbicides, mortality was dependent on concentration. The 96-h LC50 for each of glyphosate and paraquat were prorated from the probit values and found to be 0.530 and 0.07 mg/L respectively.
Mortality of C. gariepinus exposed to acute concentrations of glyphosate for 96 h.

Mortality of C. gariepinus exposed to acute concentrations of paraquat for 96 h.

The result shows that acute concentrations of glyphosate have the ability to induce micronucleus and other nuclear abnormalities in fish blood (Table 3). Similarly, Table 4 summarizes the ability of acute concentrations of paraquat to induce the same. Apart from micronucleus, other nuclear abnormalities noticed included bean-shaped cell, fragmented apoptotic cell and lobed nuclei. The difference in the number of micronucleus and other cell abnormalities in the blood of fish treated with the herbicides and the control was significant. The frequency of occurrence of other cell abnormalities was higher compared to that of micronucleus for both herbicides. The result also showed a concentration-dependent increase in the frequencies of occurrence of these cell abnormalities. In the blood of the glyphosate-treated fishes, there was 0.78% frequency of altered cells in the lowest concentration and this gradually increased to 1.80% in the highest concentration after the 96 h period. In like manner, the frequency of altered cells in the blood of fish exposed to the lowest concentration of paraquat is 0.71% and this increased gradually to 1.57% in the highest concentration within the same treatment period.
Frequencies of cell alterations caused by cytotoxic effects of acute concentrations of glyphosate in C. gariepinus.

BSC: bean-shaped cells; FAC: fragmented apoptotic cells; LN: lobed nuclei; MN: micronuclei.
Values in the same column with different superscript are significant (p ≤ 0.05). Mean values ± SE are for n = 6, where n is the total number of slides scored.
Frequencies of cell alterations caused by cytotoxic effects of acute concentrations of paraquat in C. gariepinus.
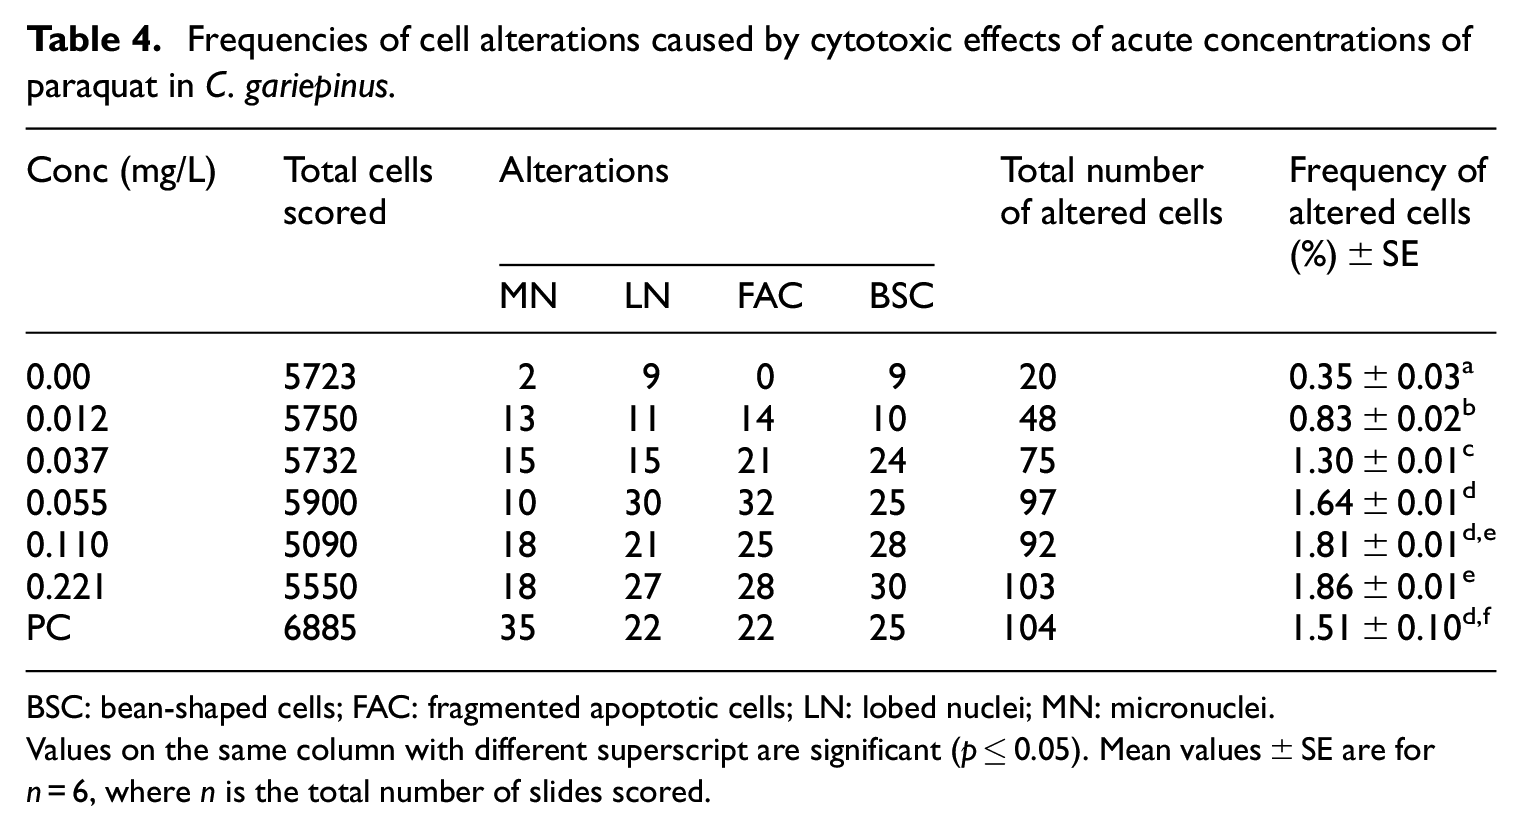
BSC: bean-shaped cells; FAC: fragmented apoptotic cells; LN: lobed nuclei; MN: micronuclei.
Values on the same column with different superscript are significant (p ≤ 0.05). Mean values ± SE are for n = 6, where n is the total number of slides scored.
Exposure of fish to acute concentrations of glyphosate revealed DNA damage in fish tissue when compared with untreated fish samples. Furthermore, the greatest degree of damage was observed in fishes treated with the highest dose of glyphosate indicating that damage was concentration-dependent. A similar scenario was noticed in the fishes exposed to paraquat-treated water, where DNA damage in fish tissue was also observed to be concentration-dependent. Fish samples exposed to the highest dose of paraquat also exhibited the highest degree of DNA damage. The order of increasing magnitude of the damage induced on DNA by the two herbicides are presented in Figure 1(a) and (b). The comets formed from analyses of the liver cells of C. gariepinus juveniles exposed to varying concentrations of each herbicide indicated potential genotoxic properties.

Relationship between percentage tail DNA and acute concentrations glyphosate (a) and paraquat (b) on C. gariepinus after 96 h. Different letters indicate statistical differences (p < 0.05).
Discussion
A positive correlation between mortality and herbicide concentration was observed in this study (Table 1). According to Fryer and Makepeace, 32 in all toxicants, a threshold is attained above which there is an observable effect. Below this level, animals are in tolerance zone. The mortality pattern is between 17% and 87% for glyphosate, and 6% and 90% for paraquat which is similar to the report by Rand and Petrocelli 33 that there should be less than 35% mortality in the lowest concentration and at least more than 65% mortality in the highest concentration. Ateeq et al., 34 Olurin et al. 35 also observed these range of values. The present study shows that the 96 h LC50 value of glyphosate was 0.530 mg/L. This is in contrast to previous studies by Akinsorotan et al., 36 Okomoda and Ataguba 37 and Ayoola 38 who all reported LC50 values of 43.65, 17.5 and 1.05 mg/L respectively after exposing C. gariepinus fingerlings to acute concentrations of glyphosate. The 96 h LC50 value of paraquat as observed in this study was 0.07 mg/L, which is also at variance with previous studies. Ladipo et al. 39 reported a value of 1.75 mg/L while Omitoyin et al. 40 reported a value of 18 mg/L of paraquat to C. gariepinus fingerlings. The LC50 values depend on fish species and the test conditions as well as herbicide formulations. 41 This variation may also be due to age of the experimental fish. Rand and Petrocelli 33 observed that physiological advancement, related to a more developed immune system offers resistance to stress which may also explain differences in values between this study and others. As the physicochemical parameters of water were found to be within the range of C. gariepinus culture in this study, death of fishes could have occurred either directly as a result of herbicides toxicity, or by the herbicides making the medium unconducive for the fishes or even by a combination of both. Furthermore, the high margin of toxicity observed in the two herbicides may be also be attributed to the many variety of herbicide formulations, different test conditions and test designs. There are also other herbicide formulations similar to the brand names used in this study which exhibit varying degrees of toxicity. 42 Hence, toxicity observed as being reported in this study may be seen to be a resultant of all the components in the formulation, additives inclusive.
In this study, acute concentrations of glyphosate and paraquat were able to induce micronuclei formation (MN) and various other cell abnormalities like apoptosis, bean-shaped cell and lobed nuclei in fish. This corroborates the findings of previous researchers28,43 who both reported cytogenetic effects of glyphosate in fish. This study also reveals that the higher the dose of the herbicides administered, the higher the frequency of nuclear abnormalities. An increase in the number of micronuclei in peripheral blood of Heteropneustus fossilis, with increasing dose was reported by Das and Nanda 44 on exposure to paper mill effluents and mitomycin C. An increase in micronuclei frequency in Channa punctata (Bloch) was also reported with increasing concentrations of chlorypyrifos after acute exposure. 45
The shape of cells in the control fish samples looked normal with no form of abnormalities. This means the different abnormalities observed in the exposed fish would have been as a result of the adverse effects of the herbicides in fish. Lobed nucleus is a reflection of abnormal cell division, a result of blockage of cytokinesis. This abnormality in the division of the cell could cause genetic imbalance and may be implicated in the formation of cancerous cells. 46
The bean-shaped blood cells recorded in this study, may be seen as alterations in which the outlines of these cells have undergone necrosis. 47 Red blood cells are very essential in the transport of oxygen. 48 Oxygen is very vital to fish respiration; especially, when it occurs through the gills. Alterations in the erythrocyte can cause reduced oxygen levels, inhibiting the flow of blood and thereby causing respiratory dysfunction. This imbalance in respiratory function may affect the fish erythrocyte morphology and number. 49
Other nuclear abnormalities, that is, apoptosis, bean-shaped cell and lobed nuclei observed were more in numbers than micronuclei. It has been reported that the MN is a weak indicator of cytotoxicity compared to these other cell abnormalities. The micronucleus test for fish was postulated by Carrasco et al. 50 as having a low sensitivity. They opined that it could be connected to low frequency of micronucleated cells occurring in fish. Some of the other nuclear abnormalities (apoptosis, bean-shaped cell and lobed nuclei) reported in this study was previously reported by other authors.51,52 It has been found that changes in the morphology of the nucleus is a product of exposure to xenobiotic contaminants, originating from a genotoxic event. 53 Low induction of micronuclei in fish blood have previously been reported54,51 on exposure of fish to environmental contaminants.
The difference in the percentage frequency of altered cells between the lowest and highest concentrations is higher in glyphosate than in paraquat. Cell kinetics and replacement has been adduced as a reason for differences in erythrocyte micronucleus frequencies such as these. 55
Markers of liver function can be used for the evaluation of the integrity and functionality of the liver. 56 It can be observed from this study that glyphosate and paraquat have genotoxic potential in the liver cells of C. gariepinus. This is demonstrated via DNA damage to the liver cells of fish, especially as there are significant differences in the comets observed between the herbicide-exposed fish and the control groups. Hence, this may be adjudged to be lesion type that may be considered potentially pre-mutagenic 57 relating to genotoxic and mutagenic attributes of the herbicide. 58
Glyphosate has been reported to be toxic to different fish body systems. Lugowska 59 reported that glyphosate impedes the development of fish. Roy et al. 60 described glyphosate as a developmental toxicant. They reported that glyphosate exerted toxicity ranging from reductions in the head and eyes, to neurotoxicity and loss of brain ventricle delineation in zebrafish. Furthermore, in another study, Roy et al. 61 reported glyphosate toxicity to the heart of the embryos of zebrafish. The genotoxicity of glyphosate being reported in this study further complements growing list of the different ways in which glyphosate exerts toxicity in fish body systems.
Paraquat is highly soluble in water, and coupled with its difficulty to degrade and decompose, 62 paraquat has been described as a high-risk toxicant, implicated in neurodegenerative diseases in animals and even humans. 63 Parvez and Raisuddin 64 evinced that when aquatic organisms are subjected to a pollutant, their response leads to a modification of their cellular and biochemical biology, causing significant physiological, behavioural and even tissue alterations. According to Fairbairn et al. 65 DNA damage could originate as a result of single/double strand DNA breakage, DNA adducts formation and DNA-DNA/DNA protein cross-links as a result of interactions between DNA and the pesticide or its metabolites. The damage observed in DNA in this study could have occurred from any of these. Interference with cellular function and cell cycle regulation could occur from exposure to Roundup® and glyphosate-based products, causing genomic instability and subsequently, cancerous cells may development. 66–68
In mitochondria, methyl groups, which are components of herbicides used in this study, in a process called methylation, can bind to very important enzymes and respiratory protein complexes causing oxidative phosphorylation to uncouple and generating reactive oxygen species (ROS) in the process. 69 As reported by Rotimi et al., 70 generation of ROS can lead to lipid peroxidation and subsequently DNA fragmentation. According to Woźniak et al., 71 glyphosate-based compounds have the ability to induce reactive oxygen species hence damage DNA through ROS-mediated effects. In addition to the action of xenobiotics on DNA structure, DNA damage can also occur through the formation of by-products possessing oxidative damaging potential.
It is possible that reactive oxygen species were generated in the fish body in the present study, and may be responsible for the genotoxicity observed. There have been several reports demonstrating clearly an association between the generation of reactive oxygen species and DNA damage leading to increasing lesions at the level of the chromosome.72,73
In conclusion, the result of this study has shown that glyphosate is toxic to fish DNA. Similarly, paraquat has also shown genotoxic potentials. This corroborates our previous reports18,19 on the ability of these herbicides to cause toxicity in Clarias gariepinus under similar exposure conditions. Since both herbicides are commonly used, it is important to continue to exercise caution in the application of these chemicals when their use becomes inevitable.
Footnotes
Acknowledgements
Authors will like to appreciate Covenant University through the University’s Center for Research, Innovation and Discovery (CUCRID) for their commitment to the payment of the processing charge for this article.
Declaration of conflicting interests
The author(s) declared no potential conflicts of interest with respect to the research, authorship, and/or publication of this article.
Funding
The author(s) received no financial support for the research, authorship, and/or publication of this article.