
Abstract
Ewing sarcoma (ES) is a malignant tumor that occurs mostly in children. However, the underlying mechanisms of ES are still unknown. Analyzing the results of two previous miRNA array reports, we found that miR-146b-5p might be an onco-miRNA in ES progression. To test this hypothesis, we detected the expression levels of miR-146b-5p by real-time PCR and observed the effects of miR-146b-5p on the progression of ES cells by CCK8 and transwell assays. Bioinformatics and luciferase assays were used to identify the target genes of miR-146b-5p. It showed that the expression levels of miR-146b-5p were upregulated in ES cell lines compared with human mesenchymal stem cells (MSCs). Up- or downregulation of miR-146b-5p in ES cell lines could effectively promote or block the proliferation, migration, and invasion of ES cells, respectively. Furthermore, we demonstrated that BTG2 was one of the target genes and mediated the effects of miR-146b-5p in ES cells. Interestingly, we also found that miR-146b-5p was partly involved in the anticancer effects of pemetrexed in ES cells. Our study revealed that miR-146b-5p affected the progression of ES by suppressing BTG2, which might shed light on anticancer drug development and ES treatment in the future.
Introduction
Ewing sarcoma (ES) is the second most frequent, high-grade malignant bone tumor in children and adolescents after osteosarcoma. 1 Although the overall incidence of ES is low (approximately one case per million people), it is very harmful because of its high rate of dissemination and mortality. Over 70% of patients treated with regular surgery, radiation or chemotherapy relapse within 2 years of initial diagnosis.1,2 Hence, clarifying the underlying mechanisms of ES metastasis and identifying novel therapeutic targets are critical to reduce the recurrence and death of this devastating disease.
MicroRNAs (miRNAs), ∼22 nucleotide small noncoding RNA molecules, are involved in many cellular processes and play important roles in the development of cancers as either tumor suppressors or oncogenes.3,4 MiRNAs negatively regulate the stability or translational efficiency of their target mRNAs by binding mostly to their 3′ untranslated regions (UTRs). Distinct miRNA profiles may serve as molecular biomarkers for different types of tumor diagnoses, prognoses, and predictions of therapeutic responses, including in ES.5–7 Among these miRNAs, miR-20b, and miR-301a promote ES cell proliferation by targeting transforming growth factor-β receptor II and PTEN, respectively, while miR-130b accelerates ES metastasis through the ARHGAP1/CDC42 pathway.8–10 Moreover, repressing miR-145 initiates mesenchymal stem cell reprogramming toward ES stem cells through upregulation of SOX2 expression. 11 Thus, understanding the miRNA expression profiles during Ewing carcinogenesis may shed light on ES diagnostic and treatment regimens.
Two previous studies using miRNA array methods revealed distinct patterns of miRNA expression between ES biopsies or cell lines and normal mesenchymal stem cells (MSCs).12,13 However, the differentially expressed miRNAs identified by these two papers were quite inconsistent. We compared the results of the two studies and found that miR-146b-5p was upregulated significantly in both ES tissues and cell lines. MiR-146b-5p, an onco-miRNA, has been reported to promote the progression of multiple epithelial tissue-derived cancers, including papillary thyroid cancer, colorectal cancer, pancreatic cancer, cervical cancer, and so on.14,15 Conversely, miR-146b-5p functions as a suppressor miRNA and a predictor of a better prognosis in non-small cell lung cancer, hepatocellular carcinoma, and gallbladder cancer.16–18 These results indicate that the roles of miR-146b-5p in different cancers are disparate. Until now, there has been no report showing the effect of miR-146b-5p on ES, a tumor originating from mesenchymal tissue.
Therefore, in this study, we performed a series of experiments to detect the expression and roles of miR-146b-5p in ES cell lines. Moreover, we found that B-cell translocation gene 2 (BTG2) may be the downstream target of miR-146b-5p during this process.
Materials and methods
Cell culture and transfection
Human mesenchymal stem cells (MSCs, Cat# PCS-500-012) and human ES cell lines A673 (Cat# CRL-1598), SK-ES-1 (Cat# HTB-86), RD-ES (Cat# HTB-166), ESA-1 (Cat# HTB-83), Hs 863.T (Cat# CRL-7598) were obtained from the American Type Culture Collection (ATCC, USA). They were maintained in RPMI 1640 or Dulbecco’s Modified Eagle’s Medium supplemented with 10% fetal bovine serum, streptomycin (100 μg/ml) and penicillin (100 U/ml). All cells were cultured in an incubator with humidified atmosphere of 5% CO2 at 37°C. MiR-146b-5p mimic, scrambled mimic, miR-146b-5p inhibitor, scrambled inhibitor, BTG2 siRNA, and control siRNA were all purchased from Guangzhou RiboBio Co., Ltd., (Guangzhou, China). Twenty-four hours after cell plating, miRNA mimics (100 nM), inhibitor (150 nM), si-BTG2 (100 nM) or their scrambled controls were transfected with the riboFECTTM CP Reagent (RiboBio) according to the design of experiments, until the following tests began.
RNA extraction, reverse transcription and quantitative real-time PCR
Total RNA was extracted from cells using an Ultrapure RNA Kit (CWBIO, Beijing, China) according to the manufacturer’s instructions. Then, total RNA was reverse transcribed using a First-Strand cDNA Synthesis kit (Invitrogen, USA). Quantitative real-time PCR was performed on a MyiQ Real-Time PCR Detection System (Bio-Rad, USA) using a two-step PCR protocol with an initial denaturation step at 95°C for 10 min, followed by 40 cycles with a denaturation step at 95°C for 15 s and an annealing/elongation step at 60°C for 60 s. For analysis of miRNA, small nuclear U6 was used as an internal control, while for analysis of mRNAs, GAPDH was used as the internal control. The relative expression levels were evaluated using the 2−ΔΔCt method. All experiments were repeated three times. The forward and reverse primers for BTG2 were 5′-ATGAGCCACGG GAAGGGAA-3′ and 5′-TTGGACGGCTTTTCGGGAA-3′, and the primers for GAPDH were 5′-GGAGCGAGATCCCTCCAAAAT-3′ and 5′-GGCTGTTGT CATACTTCTCATGG-3′, respectively. Moreover, the forward and reverse primers for miR-146b-5p were 5′-ACACTCCAGCTGGGTGAGAACTGAAT TCCAT-3′ and 5′- TGGTGTCGTGGAGTCG-3′, and the PCR primers for U6 were 5′-CTCGCTTCGGCAGCACA-3′ and 5′-AACGCTTCACGAATTT GCGT-3′.
Western blot analysis
Cells were collected and lysed in ice-cold RIPA buffer supplemented with protease inhibitors. Protein concentration was determined using the BCA method. Equal amounts of protein were separated by 10% SDS-PAGE and then transferred to PVDF membranes. After blocking for 2 h at room temperature in 5% nonfat milk, the membranes were incubated overnight with anti-GAPDH (1:5000, 10494-1-AP, Proteintech, China) and anti-BTG2 (1:1000, ab85051, Abcam, USA) primary antibodies separately. Then, the membranes were incubated with the appropriate horseradish peroxidase-conjugated secondary antibodies, followed by incubation with an enhanced chemiluminescence system. Densitometry analysis of the bands was performed by Quantity One (version 4.5.0., Bio-Rad Laboratories, Inc.). The proteins were quantified and expressed as the ratio to GAPDH. All experiments were repeated three times.
Cell proliferation analysis
After transfection for 24 h, ES cells were seeded in a 96-well plate at a density of 1000 cells per well. Then, cells in each well were incubated with 10 μl of CCK8 reagent (Solarbio Science & Technology, China) for 2 h at the 0 h, 24 h, 48 h, and 72 h time points. The optical density of the cells was detected with a microplate reader (Bio-Rad, USA) at 450 nm. All experiments were repeated three times.
Cell migration and invasion assays
Transwell chambers (8 µm pore size, Millipore, USA) were used to detect invasion and migration in ES cells. For cell invasion, the chambers were precoated with Matrigel (BD Bioscience, USA). After transfection for 24 h, cells were seeded in the upper chambers at a density of 1 × 10⁵ in 200 µl of serum-free DMEM. The lower chambers were filled with 500 µl DMEM containing 20% fetal bovine serum as a chemoattractant. After 24 h of incubation, the non-invaded cells on the upper transwell membrane were gently removed with cotton wool swabs, while the invaded cells were fixed and stained with 0.1% crystal violet. The stained cells were imaged using a microscope (Olympus IX53, Japan) and counted in three random fields of view. The cell migration experiment was the same as the invasion assay except that there was no Matrigel coat.
Vector construction and luciferase assays
The wild-type 3′-UTR of the BTG2 gene and a mutated version were cloned downstream of the firefly luciferase gene of pmirGLO (Promega, USA) (named BTG2_WT and BTG2_MUT, respectively). Cells were plated in 24-well plates at a density of 2 × 10⁵ per well for 24 h and were then cotransfected with miR-146b-5p mimic or scrambled mimic (50 nM) and BTG2_WT or BTG2_MUT (40 ng/well) with Lipofectamine 3000 (Invitrogen, USA). Renilla luciferase was included as a control. At 48 h post transfection, cell lysates were prepared using Passive Lysis Buffer (Promega), and luciferase activity was detected using the Dual Luciferase Reporter Assay System (Promega, USA). The results were normalized to the Renilla luciferase results and expressed as relative luciferase activity (firefly LUC/Renilla LUC). Experiments were independently repeated three times.
Pemetrexed treatment
Twenty-four hours after cell plating, RD-ES cells were exposed to pemetrexed (10 nM or 100 nM). After a 24-h drug exposure, the expression of miRNA was detected by quantitative real-time PCR. To detect the cell proliferation activity, the adherent RD-ES cells in a 96-well plate were firstly transfected with miRNA mimics (100 nM) or mimic controls, and 24 h later, 100 nM pemetrexed was administered. CCK8 assay was performed 0 h, 24 h, 48 h, and 72 h after pemetrexed treatment.
Statistical analysis
Data are expressed as the mean ± SD of at least three independent experiments. Statistical analysis was carried out using SPSS 17.0 software (SPSS Inc., USA). Comparisons between the different groups were performed using Student’s t test or one-way analysis of variance (ANOVA). P-values <0.05 were considered significant.
Results
MiR-146b-5p expression was upregulated in ES cell lines
Two previous studies using miRNA array methods revealed 19 and 36 significantly upregulated miRNAs in ES biopsies and cell lines compared with normal MSCs, respectively.12,13 MiR-146b-5p, miR-301a, miR-19b, and miR-128 were identified in both studies (Figure 1(a)). The role of miR-301a in ES was verified in previous reports, 9 therefore, in our following studies, miR-301a was excluded. We detected the expression of miR-146b-5p, miR-19b, and miR-128 in five ES cell lines and normal MSCs, respectively. The results showed that only the expression levels of miR-146b-5p in all tested ES cell lines were significantly higher than those in MSCs, with the most increase in RD-ES cells and the least increase in ESA-1 cells (p < 0.01; Figure 1(b)). Conversely, there were considerable variations of miR-19b or miR-128 expressions in these ES cell lines (Figure 1(c) and (d)). These observations suggested that miR-146b-5p was upregulated and might play a role in human ES.

MiR-146b-5p expression was upregulated in ES: (a) Venn diagram showing the upregulated miRNAs in the reports by Karnuth et al. 12 and Parafioriti et al., 13 (b) the relative expression levels of miR-146b-5p in human MSCs (as a control) and five different human ES cell lines, (c) the relative expression levels of miR-19b in human MSCs (as a control) and five different human ES cell lines and (d) the relative expression levels of miR-128 in human MSCs (as a control) and five different human ES cell lines.
MiR-146b-5p was involved in the proliferation of human ES cells
To investigate the effect of miR-146b-5p on ES cell progression, miR-146b-5p mimic was transfected into ESA-1 cells, and miR-146b-5p inhibitor was transfected into RD-ES cells. The proliferation of cells in each group was evaluated by CCK8 assay. The results showed that the miR-146b-5p mimic effectively elevated the expression of miR-146b-5p in ESA-1 cells (p < 0.01, Figure 2(a)) and significantly increased the OD value from 48 h to 72 h compared with the NC treatment (both p < 0.01; Figure 2(b)). On the other hand, inhibition of miR-146b-5p by miR-146b-5p inhibitor showed the opposite effects on the proliferation of RD-ES cells (both p < 0.01; Figure 2(c) and (d)). These results suggested that miR-146b-5p could promote the proliferation of ES cells.

Regulation of miR-146b-5p affected the proliferation of ES cells. Real-time PCR was used to determine the expression of miR-146b-5p in ESA-1 (a) and RD-ES (c) cells with different treatments. CCK8 assays were performed to determine the viability of ESA-1 (b) and RD-ES (d) cells after transfection with miR-146b-5p mimic or inhibitor.
MiR-146b-5p was involved in the invasion and migration of human ES cells
To further investigate the specific effects of miR-146b-5p on ES cell migration and invasion, a transwell assay was used. In migration assays, the number of migrated ESA-1 cells in the miR-146b-5p mimic-treated group was markedly greater than that in the scrambled group (p < 0.01, Figure 3(a) and (b)). Conversely, the number of migrated RD-ES cells in the miR-146b-5p inhibitor-treated group was significantly less than that in the scrambled group (p < 0.01, Figure 3(c) and (d)). Invasion assays also showed similar results to the migration assays, whereby the miR-146b-5p mimic increased the number of invaded cells, while the miR-146b-5p inhibitor decreased it compared with the NC treatment (p < 0.01, Figure 3(a) and (d)). These results suggested that miR-146b-5p is involved in the invasion and migration of human ES cells.

Regulation of miR-146b-5p affected the migratory and invasive abilities of ES cells. Transwell assays were used to detect cell migration. Representative images and quantitative analysis of the migrated ESA-1 cells (a and b) and RD-ES cells (c and d) are shown. The invasion ability of ES cells was measured using Matrigel transwell assays. Representative microscopy images of cells in the lower chamber and the quantification analysis of ESA-1 cells (a and b) and RD-ES cells (c and d) are shown.
BTG2 was one of the predicted target genes of miR-146b-5p
Next, we wanted to identify the potential target genes involved in miR-146b-5p-regulated ES progression. A series of bioinformatic prediction tools, including TargetScan, miRanda, miRWalk, and PITA were used. Only the target genes that were predicted by all the programs, verified by >10 Ago CLIP-seq experiments and related to tumor development were studied further. Our bioinformatic predicted results suggested that BTG2 might be a target gene of miR-146b-5p, with almost 45 Ago CLIP-seq experiments supporting it (Data from ENCORI). To test this hypothesis, a luciferase reporter assay was performed. Luciferase activity significantly decreased when ESA-1 cells were cotransfected with the miR-146b-5p mimic and the 3′ UTR of WT BTG2 (p < 0.01, Figure 4(a) and (b)). However, luciferase activity did not change when the miRNA binding sites on BTG2 were mutated (p > 0.05, Figure 4(a) and (b)). Moreover, we found that the mRNA and protein levels of BTG2 decreased significantly in RD-ES cells compared with MSCs (p < 0.01 for both), and the decrease in BTG2 could be reversed by miR-146b-5p inhibitor administration (p < 0.01 for both, Figure 4(c) and (d)). Similarly, we found that the mRNA and protein levels of BTG2 decreased significantly in ESA-1 cells compared with those in MSCs (p < 0.01 for both), which could be further enhanced by miR-146b-5p mimic administration (p < 0.01 for both, Figure 4(e) and (f)). Based on these results, we concluded that BTG2 might be an important target of miR-146b-5p during ES progression.
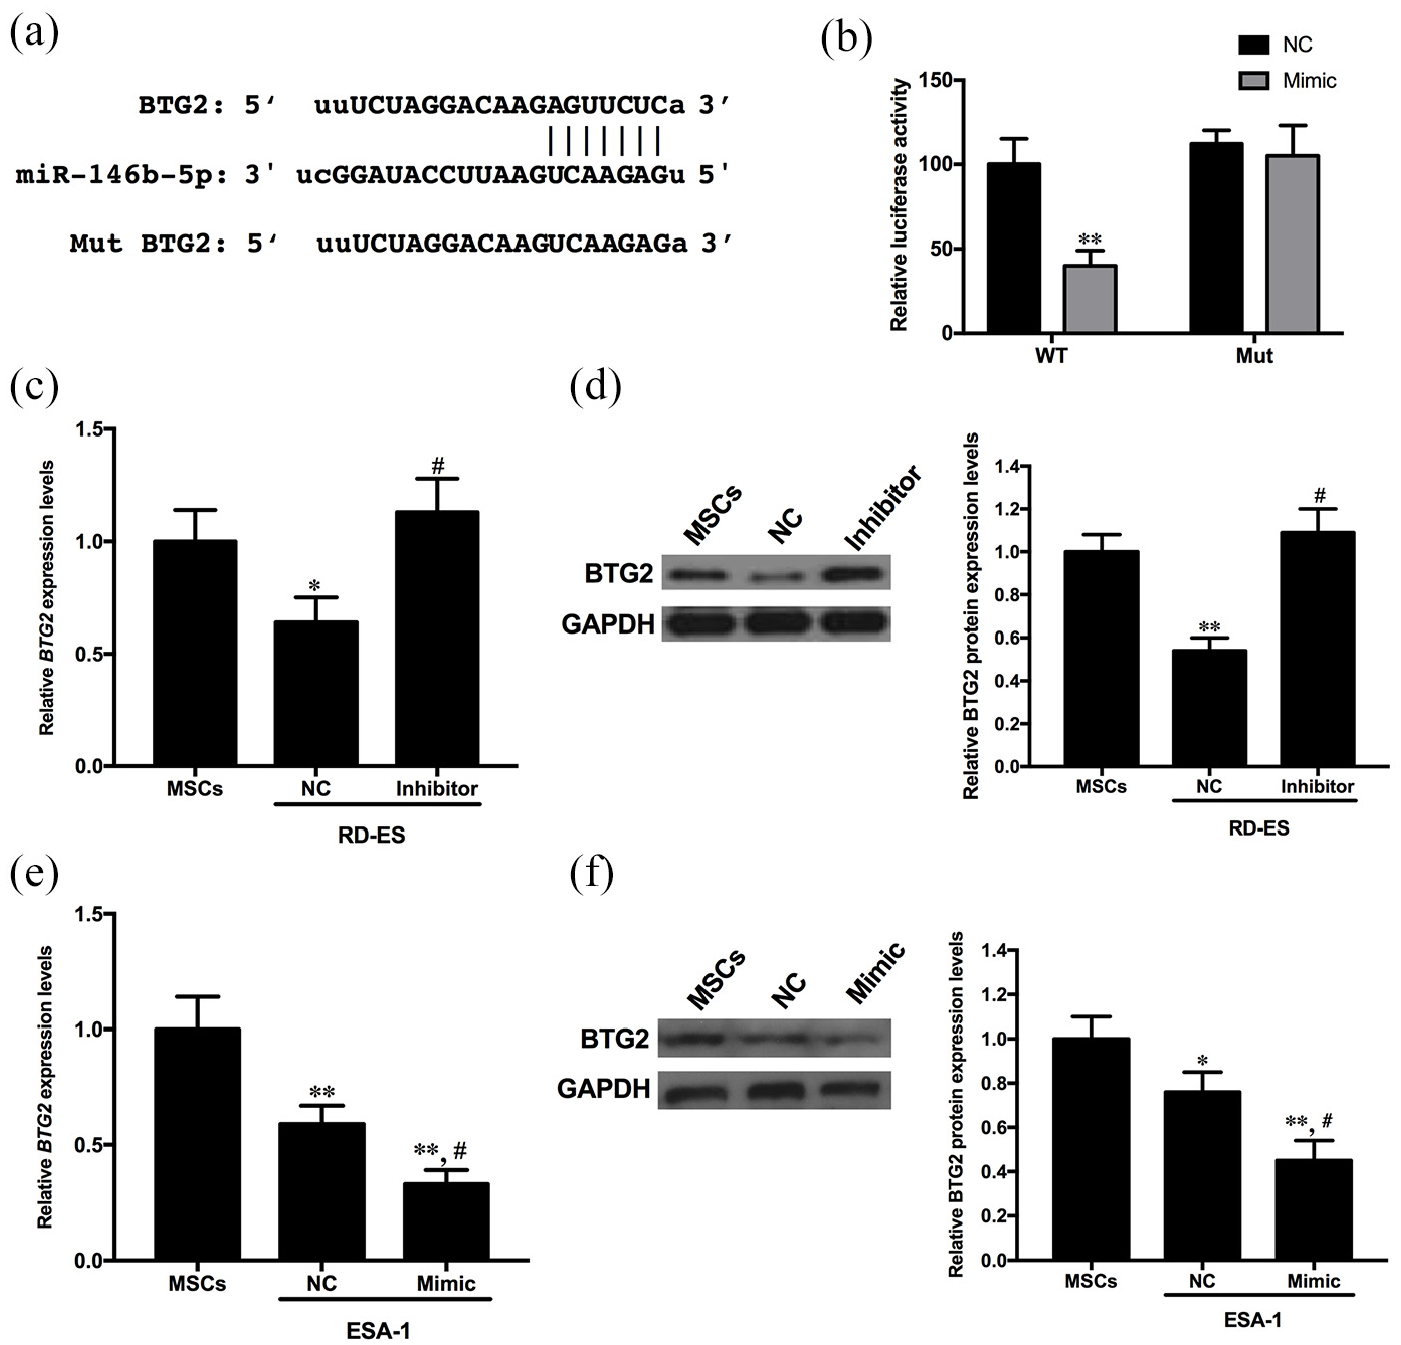
miR-146b-5 directly binds BTG2 and regulates its expression in ES cells: (a) sequences of wild-type (WT) and mutant (MUT) BTG2 3′-UTR with miR-146b-5p, (b) the changes in luciferase activity under different treatments. ESA-1 cells were cotransfected with the miR-146b-5p mimic or scrambled control and the luciferase reporter construct containing the WT or MUT BTG2 3′-UTR. The results were normalized to the values of groups with the miR-146b-5p scrambled control treatment. Comparisons between the different groups were performed with Student’s t test. **p < 0.01, compared with the WT + NC group. n = 3 per group. (c) Relative mRNA levels of BTG2 in RD-ES cells with different treatments, (d) relative levels of BTG2 protein in RD-ES cells with different treatments. Densitometry analysis of the bands was performed by Quantity One. The proteins were quantified and expressed as the ratio to GAPDH, (e) relative mRNA levels of BTG2 in ESA-1 cells with different treatments and (f) relative levels of BTG2 protein in ESA-1 cells with different treatments. Densitometry analysis of the bands was performed by Quantity One. The proteins were quantified and expressed as the ratio to GAPDH.
miR-146b-5p is involved in ES progression by regulating BTG2
The above results show that miR-146b-5p can regulate the expression of BTG2 in ES cells. Next, to investigate whether the miR-146b-5p/BTG2 pathway is crucial for the progression of ES cells, BTG2 siRNAs (siRNA1 and siRNA2) and miR-146b-5p inhibitor were cotransfected into RD-ES cells. As shown in Figure 5(a) and (b), the high expression of BTG2 mRNA and protein in the miR-146b-5p inhibitor-treated group was restored by si-BTG2 (all p < 0.01). Accordingly, the suppressive effects on RD-ES cell proliferation and migration by miR-146b-5p inhibitor were partially abolished after administration of si-BTG2 (all p < 0.05 or 0.01, Figure 5(c) and (d)). These findings consistently suggested that BTG2, as a downstream target gene of miR-146b-5p, was involved in ES cell development.

miR-146b-5 is involved in the tumorigenesis of ES cells by regulating BTG2 directly: (a) real-time PCR was used to determine the mRNA expression of BTG2 in RD-ES cells after treatment with BTG2-specific siRNA1 or siRNA2, (b) Western blot was performed to determine the relative levels of BTG2 protein in RD-ES cells with different treatments. Densitometry analysis of the bands was performed by Quantity One. The proteins were quantified and expressed as the ratio to GAPDH, (c) the proliferation activity of RD-ES cells was determined by CCK8 assay and (d) The migration activity of RD-ES cells was determined by transwell assay after different treatments.
MiR-146b-5p mediated the anticancer roles of pemetrexed in ES cells
A previous report showed that pemetrexed, a newly developed anti-folate chemotherapy drug, could effectively inhibit the growth of some ES cells at a low dose (Mean IC50 = 64 (39, 89) nM), but its mechanisms are still unknown. 19 Then, we chose RD-ES cells, which had been used to observe the effect of pemetrexed in this report, for the following studies. The results showed that pemetrexed treatment not only dose-dependently decreased the expression of miR-146b-5p (p < 0.01, Figure 6(a)) but also significantly inhibited the proliferation of RD-ES cells (p < 0.01, Figure 6(b)). Moreover, miR-146b-5p mimic administration reversed the inhibitory effect of 100 nM pemetrexed on RD-ES proliferation (p < 0.01, Figure 6(b)), implying miR-146b-5p mimic might change the IC50 value of pemetrexed. These results suggested that the anticancer effects of pemetrexed in ES cells are partly mediated by regulating the expression of miR-146b-5p.

MiR-146b-5p mediated the anticancer roles of pemetrexed in ES cells: (a) real-time PCR was used to determine the expression levels of miR-146b-5p in RD-ES cells 24 h after treatment with different doses of pemetrexed and (b) the proliferation activity of RD-ES cells was determined by CCK8 assay after different treatments. The dose of pemetrexed is 100 nM.
Discussion
Increasing evidence has indicated that miRNAs play an important role in the occurrence and progression of ES.20,21 In our study, miR-146b-5p was selected first from the results of two reported miRNA array analyses and then verified to be abnormally highly expressed in ES cell lines and to negatively correlate with BTG2 expression. Moreover, in vitro experiments showed that miR-146b-5p increased the proliferation, migration, and invasion of ES cells. Furthermore, we also confirmed that miR-146b-5p exerted its biological functions by directly targeting the 3′-UTR of BTG2. Finally, we verified the involvement of miR-146b-5p in the anticancer effects of pemetrexed in ES cells.
MiR-146b-5p is a highly conserved miRNA that regulates the expression of many genes.14,15,22 Previous reports found that miR-146b-5p is involved in the progression of multiple epithelial tissue-derived cancers, but its roles were quite different,14–18 which suggests that the effects of miR-146b-5p on tumorigenesis have obvious tissue specificity. Zhou et al. 23 reported that miR-146b-5p, as an onco-miRNA, also regulated the chemoresistance of one of the most common malignant bone tumors, osteosarcoma. However, the roles of miR-146b-5p in ES are still unclear. In this study, we found that miR-146b-5p was upregulated in all of the typically used ES cells, which is consistent with previous findings. Moreover, we first found that up- or downregulation of miR-146b-5p could effectively promote or block the proliferation, migration, and invasion of ES cells, respectively. These data demonstrate the tumor-facilitating role of miR-146b-5p in ES. Interestingly, we also found a dose-dependent decrease of miR-146b-5p expression in ES cells after pemetrexed treatment. Previous reports indicated that some miRNAs, including miR-22, miR-24, and miR-25, could predict the clinical efficacy of pemetrexed in lung cancer.24,25 Our study indicated that miR-146b-5p might be a novel biomarker to predict the effect of pemetrexed on ES. Certainly, our experiment is still very preliminary, in the following, more other ES cell lines experiments and even in vivo animal studies need to be performed.
To identify the molecular mechanisms of miR-146b-5p-mediated tumor facilitation, we predicted the putative target genes by four commonly used miRNA databases. Among the candidate genes, BTG2 was selected for further experimental validation. The protein encoded by BTG is a member of the BTG/Tob family, which have anti-proliferative properties. BTG2 overexpression is associated with cell cycle arrest from G1 to S phase by suppressing Cyclin B1, Cyclin D1, and Cyclin E1. 26 Moreover, BTG2, through its interaction with Ccr4-associated factor 1 (CAF1) and CCR4, enhances mRNA deadenylation and consequently mRNA decay. 27 Finally, existing studies suggest that BTG2 plays an important role in tumor progression as a tumor suppressor gene. 28 BTG2 expression is decreased and positively correlated with the prognosis of some cancers, such as non-small cell lung cancer, gastric cancer, and bladder and hepatocellular carcinoma.29–33 It was recently revealed that the mRNA expression of BTG2 could be regulated directly by a number of miRNAs to affect the development of cancers. 23 For instance, miR-6875-3p can suppress BTG2 by binding to its 3′-UTR to maintain sustained proliferation of hepatocellular carcinoma in vitro and in vivo. 33 MiR-663 regulates apoptosis in non-small cell lung cancer cells by affecting the expression of two novel direct targets, PUMA/BBC3 and BTG2, to control mitochondrial outer membrane permeabilization. 34 miR-25-3p promotes proliferation by targeting BTG2 in triple-negative breast cancer. 35 However, the relationship between BTG2 and miR-146b-5p has not yet been reported. In this study, we used a luciferase assay to determine the direct binding of the BTG2 3′-UTR and the miR-146b-5p seed sequence. Moreover, the mRNA and protein expression levels of BTG2 were negatively regulated by miR-146b-5p overexpression or downregulation. Knocking down the expression of BTG2 could effectively inhibit the suppressor roles of miR-146b-5p inhibitor in the proliferation, migration and invasion of ES cells. To the best of our knowledge, this is the first report on the involvement of the miR-146b-5p/BTG2 pathway in the progression of ES.
Although our research demonstrated that miR-146b-5p/BTG2 participated in the proliferation, migration and invasion of ES cells in vitro through gain- and loss-of-function experiments, the effects of miR-146b-5p/BTG2 in vivo were not tested. Additionally, the use of two ES cell lines used in functional studies provided limited evidence. Further research will offer more information on these aspects.
Conclusion
Our investigation revealed that miR-146b-5p affects the progression of ES via downregulation of BTG2, which might shed light on anticancer drug development and ES treatment in the future.
Footnotes
Acknowledgements
The authors thank Professor Zhu Zhe for experiments design assistance.
Authors’ contributions
PL and LQ designed the study and wrote the manuscript. LQ, WZ and JL performed the experiments and statistical analysis. All authors read and approved the final manuscript.
Declaration of conflicting interests
The author(s) declared no potential conflicts of interest with respect to the research, authorship, and/or publication of this article.
Funding
The author(s) received no financial support for the research, authorship, and/or publication of this article.
Availability of data and materials
The datasets used and/or analyzed during the current study are available from the corresponding author on reasonable request.