
Abstract
The ubiquitin-proteasome system (UPS) plays crucial roles in numerous cellular functions. Dysfunction of the UPS shows certain correlations with the pathological changes in Alzheimer’s disease (AD). This study aimed to explore the different impairments of the UPS in multiple brain regions and identify hub ubiquitin ligase (E3) genes in AD. The brain transcriptome, blood transcriptome and proteome data of AD were downloaded from a public database. The UPS genes were collected from the Ubiquitin and Ubiquitin-like Conjugation Database. The hub E3 genes were defined as the differentially expressed E3 genes shared by more than three brain regions. E3Miner and UbiBrowser were used to predict the substrate of hub E3. This study shows varied impairment of the UPS in different brain regions in AD. Furthermore, we identify seven hub E3 genes (CUL1, CUL3, EIF3I, NSMCE1, PAFAH1B1, RNF175, and UCHL1) that are downregulated in more than three brain regions. Three of these genes (CUL1, EIF3I, and NSMCE1) showed consistent low expression in blood. Most of these genes have been reported to promote AD, whereas the impact of RNF175 on AD is not yet reported. Further analysis revealed a potential regulatory mechanism by which hub E3 and its substrate genes may affect transcription functions and then exacerbate AD. This study identified seven hub E3 genes and their substrate genes affect transcription functions and then exacerbate AD. These findings may be helpful for the development of diagnostic biomarkers and therapeutic targets for AD.
Introduction
The ubiquitin-proteasome system (UPS) includes the following enzymes: ubiquitin activating enzymes (E1), ubiquitin conjugating enzymes (E2), ubiquitin ligase enzymes (E3), deubiquitinating enzymes (DUB), and the 26S proteasome.1,2 The UPS is a multicomponent system for protein degradation that is necessary for eukaryotic organisms to degrade approximately 80% of intracellular proteins. 3 Ubiquitin is an evolutionarily conserved peptide containing 76 amino acids; ubiquitin-related enzymes bind ubiquitin molecules to substrates through a multistep catalytic process, and the substrate protein is then degraded by the proteasome. 4 The UPS also plays crucial roles in posttranslational modification, regulation of cellular signal transduction, cell cycle processes, and repair of DNA damage.4,5 Numerous metabolic pathways and cellular regulatory networks require precise spatial and temporal control of effector protein levels by the UPS. 6
The UPS is involved in protein quality control and the removal of misfolded or aggregated proteins, and UPS dysfunction is correlated with neurodegenerative diseases. Damage to the UPS will affect the degradation of amyloid β (Aβ) and cause abnormal aggregation of Aβ in Alzheimer’s disease (AD). Aggregated Aβ inhibits proteasome activity and subsequently causes damage to the multivesicular body sorting pathway. 7 The impaired UPS also causes increased β-secretase and γ-secretase, which accelerates the hydrolysis of amyloid precursor protein (APP) to produce Aβ and promotes Aβ aggregation. 7 Ubiquitinated APP cannot be degraded by the proteasome when the activity of the proteasome is inhibited, which results in the accumulation of ubiquitinated proteins in the cell. 8 Dysfunction of the UPS may also promote the aggregation of tau protein in AD, and the higher-order oligomers and aggregates of tau cannot enter the narrow proteasome open channels. 9 Recent studies have suggested that UPS-dependent protein degradation is associated with synaptic plasticity and learning or memory functions, that the UPS plays a vital role in hippocampal long-term memory consolidation and that substrate-specific E3 may be the key factor in memory regulation. 10
The above studies suggested that the impaired UPS correlated to the pathogenesis of AD, and the decreased UPS activity in AD may lead to further deterioration of the disease. It is worth noting that increasing the UPS activity will enhance the organism’s ability to resist oxidative stress and prolong life in various animal models and human cell lines. 11 Our previous work revealed the differences in the expression of learning- and memory-related genes in different brain regions in AD. 12 In this study, we aimed to explore the different impairments of the UPS in multiple brain regions of AD through transcriptome data analysis and to identify hub E3 genes and their potential substrate genes.
Methods
Data collection
The microarray data of Alzheimer’s disease were downloaded from the Gene Expression Omnibus (GEO) database (http://www.ncbi.nlm.nih.gov/geo). Data screening was based on the following criteria: (1) the data are genome-wide; (2) the data should include AD and control samples; (3) the data should include multiple brain regions; (4) no age difference exists between AD and controls in each brain region; and (5) raw microarray data are available. With these criteria, we finally chose the dataset of GSE5281 13 for our reanalysis. The dataset contains 87 AD samples and 74 control samples. The brain regions in this dataset included the entorhinal cortex (EC), hippocampus (HIP), medial temporal gyrus (MTG), posterior cingulate (PC), superior frontal gyrus (SFG), and primary visual cortex (PVC). There was no age difference between AD and controls in each brain region (Table 1). The datasets of GSE36980 14 and GSE48350 15 also contain AD and control transcriptome data for multiple brain regions and were used as validation sets. In order to explore the expression differences in the blood transcriptome and proteome in patients with AD, we chose the GSE63060 dataset 16 to analyze the gene expression profiles in blood, which contains 145 patients with AD and 104 age- and sex-matched controls. The GSE29676 dataset 17 contains serum proteome data from 50 patients with AD and 40 controls and was used to explore the changes in protein levels. For details on data preprocessing, see our previous reports.12,18
Age information between patients with Alzheimer’s disease and controls.
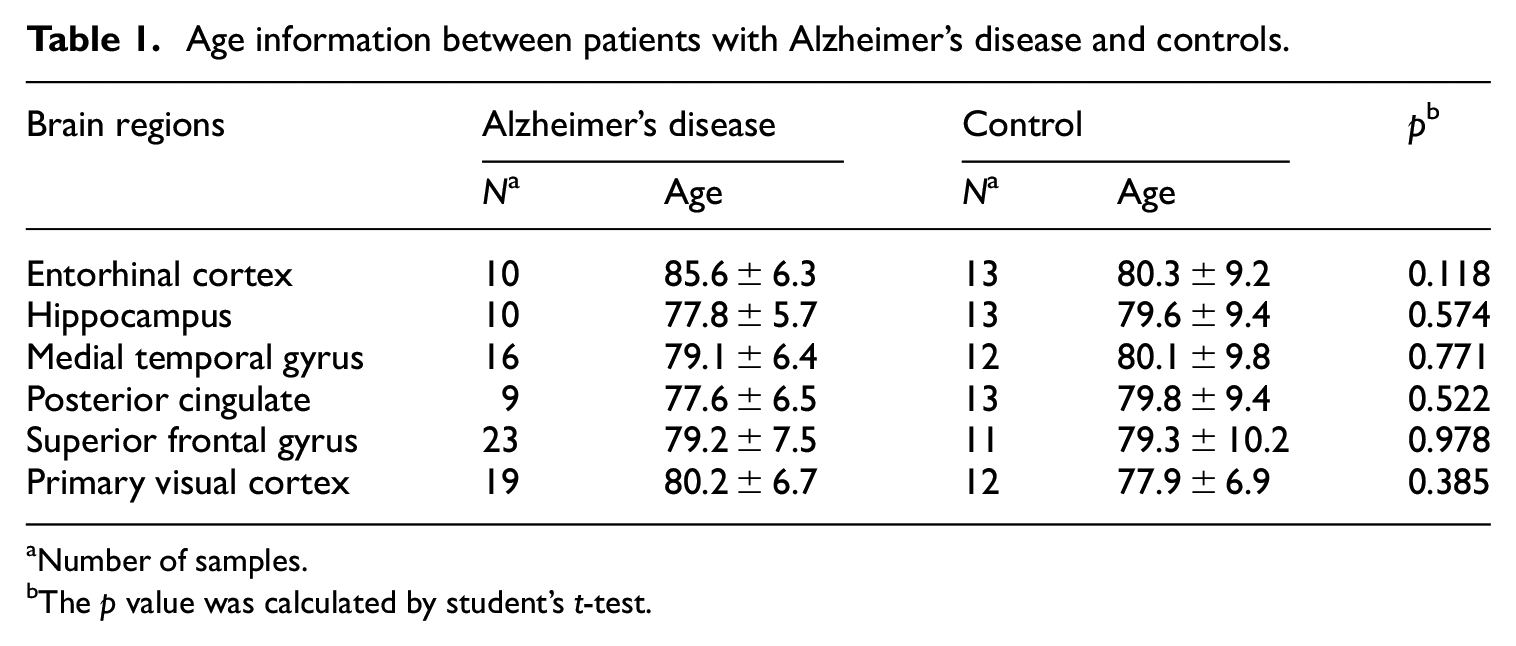
Number of samples.
The p value was calculated by student’s t-test.
Differential expression gene analysis
Bioinformatics analysis of the microarray data was carried out by R statistical software v3.6.1 (https://www.r-project.org/) and Bioconductor Library (https://www.bioconductor.org/). Differential gene expression analysis was performed using the empirical Bayesian algorithm in the limma package in R. 19 Up- and downregulated genes were defined as a log2 transformed fold-change (logFC) ≥ 1 or ≤−1 for AD samples compared with controls. A false discovery rate (FDR)-corrected p value ≤0.05 was considered significant. Differentially expressed genes shared by more than three brain regions are considered to be hub genes. The heatmap package in R was used to show the gene expression profiles, and the clustering method was chosen as “ward.D2.”
GO and KEGG enrichment analysis
Information on human genes and related GO terms (including biological process, cellular component and molecular function) was downloaded from the QuickGO database (http://www.ebi.ac.uk/QuickGO-Beta/). The reference human genes and pathways were downloaded from the Kyoto Encyclopedia of Genes and Genomes (KEGG) database (http://www.kegg.jp/). GO terms and KEGG pathways with less than 10 genes were removed. GO and KEGG enrichment analysis was performed using the hypergeometric test and the formula shown in a previous report. 20 The reference gene set is all detected genes in the GSE5281 dataset. An FDR-corrected p value ≤0.05 was considered significantly enriched.
UPS gene collection
The UPS genes were downloaded from the Ubiquitin and Ubiquitin-like Conjugation Database (http://uucd.biocuckoo.org). 21 This database collected 129,416 potential proteins from 148 different species and protein types, including E1, E2, E3, DUB, ubiquitin-binding domain-containing protein (UBD) and ubiquitin-like domain-containing protein (ULD). A total of 878 human UPS genes (including 10 E1 genes, 42 E2 genes, 700 E3 genes, and 126 DUB genes) were downloaded in this study. Proteasome-related genes were extracted from the proteasome pathway in the KEGG database. This study mainly focused on the E3 genes, and the hub E3 genes were defined as the differentially expressed E3 genes shared by more than three brain regions.
Construction of AD prediction models
The prediction models were built using the blood transcriptome and proteome data of patients with AD and controls. The biomarkers were chosen as the hub E3 genes and proteins. The receiver operating characteristic (ROC) curve and the area under the curve (AUC) of the single marker were calculated using the pROC package in R. A stepwise modeling strategy was used to screen the optimal multigene and multiprotein models. The model with the largest AUC was defined as the optimal model. For example, in the multigene prediction model, the gene with the largest AUC was first selected. Then, we used a multivariate logistic regression model to generate the combined effect of the selected gene and each of the remaining genes. Next, we selected the best two-gene model with the highest AUC and repeated the previous steps. Finally, we selected the optimal model with the highest AUC in each multigene combination model.
E3 substrate prediction and correlation analysis
Two web server tools, including E3Miner (http://e3miner.biopathway.org) 22 and UbiBrowser (http://ubibrowser.ncpsb.org), 23 were used to predict the substrate of hub E3. The hub E3 genes and the top 10 predicted substrate genes based on confidence were used to construct the E3-substrate interactive network. Network visualization was performed using Cytoscape v3.4.0 (https://cytoscape.org/). Pearson correlation analysis was used to analyze the correlation between the E3 genes and the predicted substrate genes. A p value ≤0.05 was considered significant. The mouse dataset GSE113436 was used to validate the expression of NSMCE1 and the predicted target genes. The data is the transcriptome profile of Nsmce1 overexpression in mouse hippocampal neuronal cells. 24
Results
Commonly differentially expressed genes correlate to AD pathology
Differential expression analysis showed that there were a large number of downregulated genes in EC, HIP, MTG, and PC, and relatively few genes were affected in SFG and PVC (Figure 1(a)). Furthermore, there were also a considerable number of upregulated genes in the MTG and SFG. Most of these genes were differentially expressed in multiple brain regions, and few genes were differentially expressed in specific brain regions (Figure 1(b)). There were two differentially expressed genes shared by all six brain regions (APOO and PCYOX1L). A Venn diagram showed that a total of 462 genes were differentially expressed in more than three brain regions (Figure 1(b)). The KEGG pathway enrichment results suggested that these genes were mainly involved in the pathways of neurodegenerative diseases (such as Alzheimer’s disease), nervous system (such as synaptic vesicle cycle and GABAergic synapse), metabolism (such as oxidative phosphorylation, glycolysis and the TCA cycle), signal transduction (such as the Hippo signaling pathway and cAMP signaling pathway), protein degradation (such as the proteasome) and transcription (such as basal transcription factors) (Figure 1(c)). Numerous studies have reported that these pathways are correlated with the Aβ and tau protein processes, synaptic dysfunction and neurodegeneration in AD.7,25–28 This evidence suggests that the damaged genes and pathways shared by multiple brain regions can accurately reflect the pathological changes of AD.
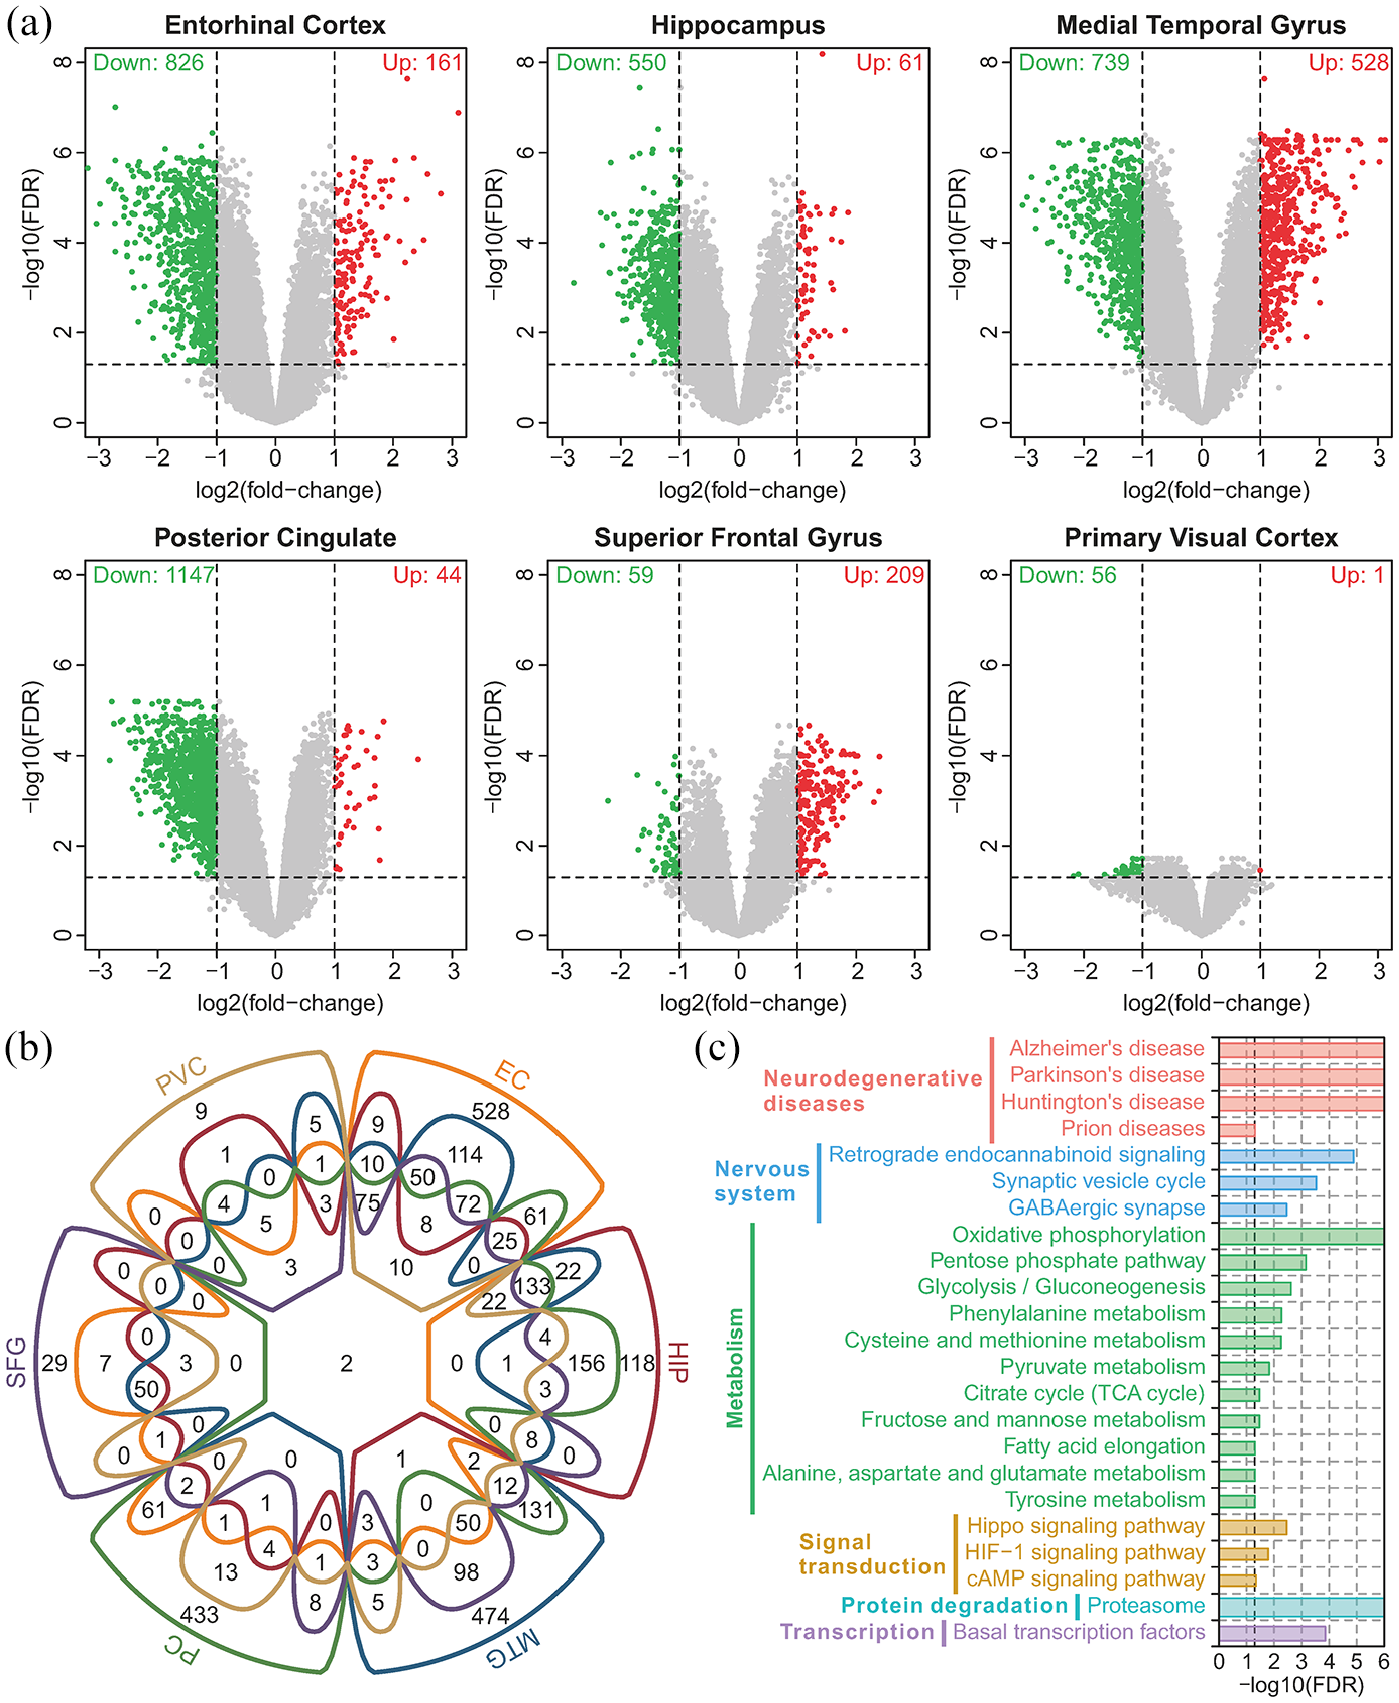
Overview of the differentially expressed genes and their functions: (a) volcano plot of all genes in six brain regions. Red points indicate upregulated genes, and green points indicate down regulated genes, (b) Venn diagram of differentially expressed genes in six brain regions, and (c) enriched KEGG pathways of differentially expressed genes shared by more than three brain regions.
UPS-related functions were damaged in multiple brain regions in AD
GO and KEGG enrichment analyses were performed using the differentially expressed genes in each brain region. The results showed that there were 193, 357, 272, 283, 666, and 265 enriched GO items (Figure 2(a)) and 23, 40, 29, 38, 3, and 22 enriched KEGG pathways (Figure 2(b)) in the EC, HIP, MTG, PC, SFG, and PVC, respectively. There were 195 enriched GO items and 27 enriched KEGG pathways shared by more than three brain regions. These enriched GO items and KEGG pathways included multiple UPS-related functions. By analyzing the enriched UPS-related functions in different brain regions, we found that HIP and PC showed the highest significance, EC and MTG showed moderate significance, and SFG and PVC showed relatively low significance (Figure 2(c)).

Enriched GO functions and KEGG pathways in six brain regions: (a) Venn diagram of enriched GO functions (including biological process, cellular component and molecular function) in six brain regions, (b) Venn diagram of enriched KEGG pathways in six brain regions, and (c) significantly enriched ubiquitin-proteasome system-related functions and pathways in more than three brain regions.
E3 genes were downregulated in multiple brain regions
There were multiple differentially expressed UPS genes in the EC, HIP, MTG, and PC, whereas only a few genes were affected in the SFG and PVC (Figure 3(a)). Because E3 has substrate specificity, this study mainly focused on the E3 genes. These differential E3 genes were almost all downregulated in the EC, HIP, and PC, and only MTG showed more than a dozen upregulated genes. The clustering results of the 73 combined differentially expressed E3 genes in six brain regions confirmed this trend (Figure 3(b)). The Venn diagram analysis showed that there were seven differentially expressed E3 genes shared by more than three brain regions (Figure 3(c)), and these genes were identified as hub E3 genes. Among these genes, UCHL1 was downregulated in the EC, HIP, MTG, and PC; CUL3, EIF3I, and NSMCE1 were downregulated in the EC, HIP, and PC; and CUL1, PAFAH1B1, and RNF175 were downregulated in the HIP, MTG, and PC (Figure 3(d)). The clustering results suggested that the HIP and PC showed the most serious downregulation of the hub E3 genes, followed by the MTG and EC, whereas the SFG and PVC showed relatively slight damage. The clustering results of the proteasome genes also showed a consistent trend (Figure 3(e)). Furthermore, most of the combined differentially expressed E3 genes showed a low expression trend in different brain regions, and the hub E3 genes also showed a consistent downregulation trend in almost all brain regions in the two validation datasets (Figure 3(f)–(i)). Combining the above analysis results, we infer that these hub E3 genes may play crucial roles in the pathogenesis of AD. The role of these hub E3 genes in AD pathology showed in Supplemental Table 1, and the brief signaling cascade of these hub E3 genes showed in Supplemental Figure 1. To explore the possible E2 conjugating enzyme in connection with identified E3 ligases, we used Pearson correlation analysis to explore the combination possibility between hub E3 and E2 genes. Among these hub E3 genes, CUL1, CUL3, PAFAH1B1, and RNF175 showed a strong correlation with multiple E2 genes (Supplemental Figure 2).

Expression profiles of ubiquitin-proteasome system-related genes and hub E3 genes: (a) gene expression of ubiquitin-related genes in different brain regions. The line length indicates the log2 (fold-change). The red, green and gray colors indicate that the gene is upregulated, downregulated and not statistically significant, (b) heatmap of the combined differentially expressed E3 genes in six brain regions, (c) Venn diagram of the differentially expressed E3 genes in the EC, HIP, MTG and PC, (d) heatmap of the hub E3 genes in six brain regions, (e) heatmap of the proteasome-related genes in six brain regions, (f) heatmap of the combined differentially expressed E3 genes in the validation set of GSE36980, (g) heatmap of the hub E3 genes in the validation set of GSE36980, (h) heatmap of the combined differentially expressed E3 genes in the validation set of GSE48350, and (i) heatmap of the hub E3 genes in the validation set of GSE48350.
Expression of hub E3 genes and proteins in the blood of AD
To explore the expression difference in E3 genes in blood, we mapped the AD brain transcriptome data with blood transcriptome and proteome data. There were 73 combined differentially expressed E3 genes in the GSE63060 dataset and 28 combined differentially expressed E3 proteins in the GSE29676 dataset. The clustering results showed that the total expression profiles of these genes or proteins may not distinguish patients with AD and controls (Figure 4(a) and (b)). Three hub E3 genes (CUL1, EIF3I, and NSMCE1) were significantly expressed at low levels in patients with AD compared to controls in blood, which is consistent with the expression trend in the brain (Figure 4(c)). However, the protein expression of CUL1 and RNF175 showed the opposite trend between AD and controls in blood (Figure 4(d)). We constructed prediction models to explore the diagnostic accuracy of these hub E3 genes and proteins in AD. The optimal multigene model is the combination of five hub E3 genes, including NSMCE1, PAFAH1B1, CUL1, RNF175, and EIF3I (Figure 4(e)), which had the highest AUC of 0.726 (Figure 4(f)). The optimal multiprotein model is the combination of five hub E3 proteins, including RNF175, PAFAH1B1, CUL3, CUL1, and UCHL1 (Figure 4(g)), which had the highest AUC of 0.789 (Figure 4(h)). Unfortunately, neither the multigene nor the multiprotein model achieved high prediction accuracy.

Expression of hub E3 genes and proteins in the blood of AD and diagnostic model construction: (a) heatmap of the combined differentially expressed E3 genes in the GSE63060 dataset, (b) heatmap of the combined differentially expressed E3 proteins in the GSE29676 dataset. The gene and protein expression values were z-score converted, and the color bar indicates the z-score, (c) gene expression of the hub E3 genes in the blood between patients with AD and controls, (d) protein expression of the hub E3 genes in the blood between patients with AD and controls (no protein expression data of EIF3I or NSMCE1). Statistical significance: *p < 0.05, **p < 0.01, ***p < 0.001, (e) stepwise screened prediction models using hub E3 gene expression values in blood transcriptome data. From left to right on the x-axis (stepwise screened genes), each additional gene corresponds to a model (for example, the gene of NSMCE1 represents model 1, which contains one gene of NSMCE1, PAFAH1B1 represents model 2, which contains two genes including NSMCE1 and PAFAH1B1). The red arrow shows the optimal model, (f) ROC curve of the screened optimal multigene model, (g) stepwise screened prediction models using hub E3 protein expression values in blood proteome data, and (h) ROC curve of the screened optimal multiprotein model.
Hub E3 and its substrates aggravate AD by affecting transcription functions
The interactive network of the hub E3 genes and the predicted substrate genes showed that there were eight substrates that were regulated by multiple E3 (Figure 5(a)). The heatmap showed that there were four differentially expressed substrate genes: EDF1 was downregulated in the EC, HIP, MTG, and PC; TAF7 was downregulated in the HIP, PC, and PVC; TAF3 was upregulated in the HIP, MTG, and SFG; and PIK3C2B was upregulated in the MTG (Figure 5(b)). The KEGG enrichment results showed that these substrate genes are involved in transcription functions (Figure 5(c)). Pearson correlation analysis of the hub E3 genes and the differentially expressed substrate genes showed that EIF3I and UCHL1 positively correlated with EDF1 in all brain regions; EIF3I, NSMCE1, and UCHL1 positively correlated with TAF7 in most brain regions; NSMCE1 negatively correlated with TAF3 in the HIP and MTG; and PAFAH1B1 negatively correlated with PIK3C2B in the MTG and PC (Figure 5(d)). Based on the above results, we concluded that the downregulated E3 genes may affect the substrate genes, damage the transcription functions and aggravate AD (Figure 5(e)). In the validation dataset, there was no difference in the expression of Taf3 or Taf7 after Nsmce1 was overexpressed (Supplemental Figure 3).

Network and function of hub E3 and their substrate genes: (a) hub E3 and their substrate gene interactive network. The red color indicates E3 genes, and the blue color indicates substrate genes, (b) heatmap of the hub E3 substrate genes in six brain regions. The color bar indicates the log2 (fold-change), and the yellow point indicates statistical significance, (c) top 15 enriched GO biological processes of the hub E3 substrate genes. The dashed line indicates statistical significance, and the bar width indicates the enrichment percentage, (d) Pearson correlation of hub E3 genes and differentially expressed substrate genes (represented by S). The R2 indicates the square of the Pearson correlation coefficient. Statistical significance: *p < 0.05, **p < 0.01, ***p < 0.001, and (e) the potential mechanism of down regulated hub E3 genes aggravating AD.
Discussion
This study showed varied impairment of the UPS in different brain regions in AD. The UPS was seriously damaged in the HIP and PC, moderately damaged in the EC and MTG, and slightly damaged in the SFG and PCV. The seven identified hub E3 genes were downregulated in most brain regions, and three of these genes were also expressed at low levels in blood. These hub E3 genes and their substrate genes may affect transcription functions and then exacerbate AD.
Different brain regions have specific functions, and there are strong connections among one another. The EC is the main channel between the HIP and neocortex and is involved in the formation of long-term memory. 29 EC receives information from the HIP and transmits it to the neocortex through neurotransmitters such as glutamate and is one of the brain regions affected in the early stages of AD. 30 The HIP is a part of the temporal lobe, which is essential for the formation of new memories. Usually, HIP function is impaired earlier than other cortices in patients with AD, suggesting that the first process in AD is memory impairment. 31 The MTG involves many cognitive processes, such as semantic memory and language processing, and integrates information from different senses. Studies have shown that there is active neuronal loss in the MTG in AD.32,33 The PC is a part of the cingulate cortex, which is a highly connected and metabolically active brain region and is functionally involved in learning and spatial memory. It has been identified that there was amyloid deposition and decreased metabolism in PC during AD progression, and the volume of the PC in patients with AD is smaller than that of healthy controls.34,35 The SFG is located in the upper part of the prefrontal cortex, accounting for approximately one-third of the frontal lobe. Impaired SFG will lead to disorders of working memory and self-awareness.36,37 Several studies have shown that reduced metabolic functions in FC are associated with AD. 38 The PVC occupies the entire surface of the occipital lobe and acts as a receiver of visual data. Some evidence suggests that the changes in PVC are associated with normal aging, and Aβ plaques and neurofibrillary tangles usually occur in the late stages of AD.39,40 Our previous study found that multiple learning and memory-related genes were affected in the HIP and temporal lobe in AD. 12 Combined with the findings in this study that UPS showed the most serious damage in the HIP and PC, we speculate that there may be a causal relationship between UPS impairment and reduced learning or memory functions.
The number of E1, E2, and E3 has a pyramid structure, and a previous report showed that there were approximately 2 E1 genes, 30-40 E2 genes and more than 600 E3 genes in humans. 11 Recent studies have revealed more genes in the human ubiquitination pathway (including E1, E2, E3, and DUB). 21 E3 has substrate specificity and is the most critical enzyme in the UPS. This study identified seven hub E3 genes, including CUL1, CUL3, EIF3I, NSMCE1, PAFAH1B1, RNF175, and UCHL1. The proteins encoded by CUL1 and CUL3 belong to the cullin protein family. Multisubunit Cullin-RING structure ligase is the most diverse E3 and plays important roles in AD pathology. The CUL1-dependent ubiquitination process is activated by the Neddylation process, which regulates the degradation process of APP and causes APP to be degraded by endocytosis. Studies have shown that downregulated CUL1 leads to APP aggregation and promotes Aβ production. 41 Under normal conditions, the KEAP1-CUL3 complex polyubiquitylates NRF2 and is subsequently degraded by the proteasome. However, the interaction between the KEAP1-CUL3 complex and NRF2 is unstable under oxidative stress conditions, 42 which may cause NRF2 aggregation and inhibit its downstream gene expression in AD. 43 EIF3I encodes eukaryotic translation initiation factor 3 subunit I and is involved in the transcription process of Aβ23. 44 NSMCE1 encodes a subunit of the SMC5-SMC6 complex and plays an important role in DNA repair, and overexpression of NSMCE1 inhibits APP and other AD marker genes in mice. 24 A previous study showed that heterozygous mutations in PAFAH1B1 cause learning and behavior disorders in mice. 45 Compared with cerebral malaria-resistant mice, PAFAH1B1 was reduced in cerebral malaria-susceptible mice and was associated with AD. 46 Several studies reported that UCHL1 mRNA and protein levels were reduced in AD.47–50 A previous study showed identified UCHL1 was deregulated in four out of six brain regions, suggested that there were region-specific changes in UPS components. 50 Overexpression of UCHL1 in APP23 transgenic mice delayed AD progression. 51 However, a correlation between RNF175 and AD has not yet been reported. Furthermore, studies have reported that the substrate genes of hub E3 have certain correlations with AD, such as EDF1, 52 TAF7, 53 and TAF3. 54 These substrate genes are correlated to transcription functions.
There were several limitations to this study. Firstly, the potential substrate genes of hub E3 genes were obtained through database mining and literature search, the interactions between hub E3 genes and the substrate genes still need experimental verification. Secondly, the combination of multiple E1-E2-E3 axes is still unknown, and more in-depth research is needed. Lastly, this study performed only transcriptome level analysis. Whether the protein expression of these E3 or substrates are consistent with gene expression remains to be confirmed.
Conclusion
In summary, the damaged UPS extensively and persistently exacerbates the AD process. This study identified seven hub E3 genes (CUL1, CUL3, EIF3I, NSMCE1, PAFAH1B1, RNF175, and UCHL1) and their substrate genes (EDF1, TAF3, TAF7, etc.) affect transcription functions and then exacerbate AD. Among these E3 genes, CUL1, EIF3I, and NSMCE1 were both downregulated in blood and brain and may be used as potential markers for AD diagnosis. However, the underlying mechanism of the interactions between E3 and substrates affecting AD remains unclear. Therefore, revealing the E3-substrate regulatory mechanisms in future works will help develop diagnostic biomarkers and therapeutic targets for AD.
Supplemental Material
sj-docx-1-sci-10.1177_00368504211001146 – Supplemental material for Identification of hub ubiquitin ligase genes affecting Alzheimer’s disease by analyzing transcriptome data from multiple brain regions
Supplemental material, sj-docx-1-sci-10.1177_00368504211001146 for Identification of hub ubiquitin ligase genes affecting Alzheimer’s disease by analyzing transcriptome data from multiple brain regions by Dahai Liu, Shao-Xing Dai, Kan He, Gong-Hua Li, Justin Liu, Leyna G Liu, Jing-Fei Huang, Lin Xu and Wen-Xing Li in Science Progress
Footnotes
Declaration of conflicting interests
The author(s) declared no potential conflicts of interest with respect to the research, authorship, and/or publication of this article.
Funding
The author(s) disclosed receipt of the following financial support for the research, authorship, and/or publication of this article: This work was supported by the National Basic Research Program of China (No. 2013CB835100), the Strategic Priority Research Program of Chinese Academy of Sciences (No. XDBS01020100), the National Natural Science Foundation of China (No. 81570376, No. 81870307), the University Special Innovative Research Program of Department of Education of Guangdong Province (No. 2017KTSCX189), the Start-up Fund of Kunming University of Science and Technology (No. KKZ3201927005), and Yunnan Fundamental Research Projects (No. 2019FB050).
Supplemental material
Supplemental material for this article is available online.
Author biographies
References
Supplementary Material
Please find the following supplemental material available below.
For Open Access articles published under a Creative Commons License, all supplemental material carries the same license as the article it is associated with.
For non-Open Access articles published, all supplemental material carries a non-exclusive license, and permission requests for re-use of supplemental material or any part of supplemental material shall be sent directly to the copyright owner as specified in the copyright notice associated with the article.