
Abstract
This paper proposed a multi-layered bi-directionally corrugated plates structure (BCPS) for energy absorption. Quasi-static compression experiments and finite element method (FEM) were used to investigate the crushing performance of the multi-layered BCPS. The results showed that the multi-layered BCPS had very small initial peak crushing force, and the fluctuation of force was very small during the whole compression process. These characteristics made the multi-layered BCPS more advantageous in crashworthiness than traditional structures. It was also found that the crushing performance of the multi-layered BCPS was very sensitive to the geometrical parameters, such as the number of the cellular structures along the width nc, the number of plates nl, and the ratio of width of small square ws to width of big square wb of the pyramid cell η. Therefore, parameters optimization was carried out using the Multi-Objective Genetic Algorithm to find the best geometrical configuration of the structure. After optimization, the optimum parameters nc = 5, nl = 11 and η = 0.38 was obtained. The specific energy absorption increased by 143.76% compared with the initial configuration.
Introduction
Energy-absorbing structures play a very important role in the field of passive security protection. Thin-walled metallic structures are the most common energy-absorbing structures and have been used in several industry fields, especially in automobile and railway industry.1–4 In the past few decades, researchers and engineers devoted to developing lightweight design to achieve better energy absorption capacity.5,6 Corrugated arrangement is a good choice for lightweight structure design and have attracted much attention in recent years.1,7–9 The application of corrugated design is not only limited on metal materials but can be used for composites to improve the mechanical property.10–13 Common corrugated structures can be divided into two types, namely, tubular structures and plate structures. For tubular structures, the purpose of corrugated design is to improve the crushing stability and decrease initial peak crushing force (IPCF).14–17 The corrugated tubular structures have been studied extensively and will not be discussed here.
The mechanical performance of corrugated plate structures (CPS) has also been investigated by many researchers. The most common CPS is unidirectional corrugated plate structure (UCPS). The corrugated shape of UCPS can be designed to triangular, trapezoidal, square and sinusoidal profile, among others. Cao et al. 18 experimentally and numerically studied the impact behavior of sandwiched single- and multi-layered triangular UCPS. In their work, the bending of interlayer was observed. It leaded to a better extra layer interaction and reduced the force oscillation during the successive folding. It is a beneficial feature from the viewpoint of energy absorber designer. Hou et al. 19 exemplifies corrugated sandwich panels with trapezoidal and triangular cores to determine the relationship between the structural parameters and the crashworthiness under low-velocity local impact and planar impact. The crashworthiness of the two corrugated sandwich panels were also compared. It was found that the crashworthiness of sandwich panels with triangular core was slightly better than the trapezoidal ones under the loading conditions considered. Rong et al. 20 investigated the planar compression performance and low-speed local impact response of corrugated sandwich panels with various core shapes, that is, sinusoidal, rectangular, trapezoidal, triangular and arc-shape. It was found that geometric configurations of the corrugated cores had significant influences on the dynamic response and energy absorption capacity of the sandwich panels. Zhang 21 designed four types of UCPS with different corrugated shapes, namely, V-type, U-type, X-type, and Y-type, and performed experiment and finite element (FE) simulations to investigate their compressive behaviors. The results showed that the U-type core, V-type core, and X-type structures showed excellent crushing resistance performance and energy absorption characteristic, and the crush performance of the Y-type core structures was relatively poor because of bending mode. Kılıcxaslan 22 et al. and Sarıkaya 23 et al. investigated two types of multi-layered trapezoidal zig-zag corrugated cores, in which the two adjacent plates were bonded or brazed together. The effects of sandwich specimen assemble methods, the geometric imperfection on the mechanical performance were addressed in their work.
In recent years, negative Poisson’s ration design draws more and more attention for improving the mechanical performance of structures. Some researchers also applied it in UCPS design. Ma 24 examined the mechanical performance of one kind of auxetic double-arrow corrugated sandwich panels. Gao 25 analyzed crashworthiness of a novel multi-layered UCPS based on the cylindrical cellular structure with negative Poisson’s ratio. The optimal configuration of the structures, which was obtained from performing multi-objective optimization, had better performance in energy absorption compared with thin-walled circle structure.
Compared with UCPS, the study on the bi-directionally corrugated plate structure (BCPS), especially in mechanical property, was reported relatively less because the manufactory process is complicated. Nguyen 8 introduced a novel cold-roll forming process method to manufacture a BCPS. Cai 26 described a forming method to manufacture an egg-box-like BCPS. Liang27,28 manufactured a hemisphere cellular shaped bi-directionally corrugated steel plates using the method similar to Nguyen’s and then rolled the plates to square columns. The crushing performance of this type square columns under axial and lateral loading were investigated separately. Yang 29 investigated the crashworthiness of a single-layered bi-directionally corrugated core sandwich panel with double-sine profile under quasi-static crushing load. The results showed that the crashworthiness of bi-directionally corrugated panels was better than unidirectional ones.
In the present study, we proposed a multi-layered BCPS and investigated its crashworthiness. As far as we know, there is little study on the mechanical properties of multi-layered BCPS from literature. Three quasi-static compression tests were performed to study the crushing performance of the multi-layered BCPS. Then a FE model was developed and validated with the experimental results. Afterwards, approximate mode was constructed based on the numerical results of full fractural design of experiment (DOE). Moreover, the effects of geometric parameters on crashworthiness was investigated based on DOE results. Finally, a multi-objective optimization was used to find the optimum configuration for the multi-layered BCPS.
Materials and methods
Geometric description
Figure 1(a) displays the geometric schematic of the multi-layered BCPS. Each layer plate is a periodic cellular structure with an arrangement of frusta and inverted frusta of pyramidal shapes with square bases. The edges between adjacent surfaces are rounded and all rounded corners have the same radius, which is represented with r. The width of each plate is w, the number of the cellular structures along the width nc, and the thickness of the cellular structure t. Furthermore, the width of the small and big square of the pyramid are represented with ws and wb. The multi-layered BCPS consists of nl plates, therefore the relationship between the total height of the multi-layered BCPS ht and the cellular structure hc can be represented as: ht = 2nl·hc.

Schematic diagram of multi-layered BCPS: (a) geometric dimensions and (b) physical figure.
Each layer of steel plate was fabricated from a flat plate with a cold-roll forming method, as displayed in Figure 2. One can refer to Ref 8 to learn more about the forming method. The square bases of frusta from adjacent plates were brazed together and finally formed the multi-layered BCPS, as shown in Figure 1(b).
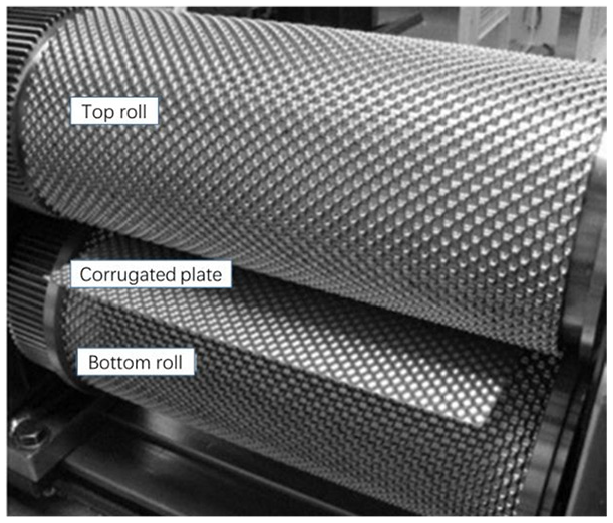
Corrugated plate forming process. 8
Experiment setup
The quasi-static compression test was utilized to investigate the crashworthiness performance of the multi-layered BCPS. In order to ensure the repeatability of the test, three specimens were prepared, as displayed in Figure 3. The three specimens had same geometric dimensions, which are shown in Table 1.

Test specimens.
Geometric dimensions of test specimens.
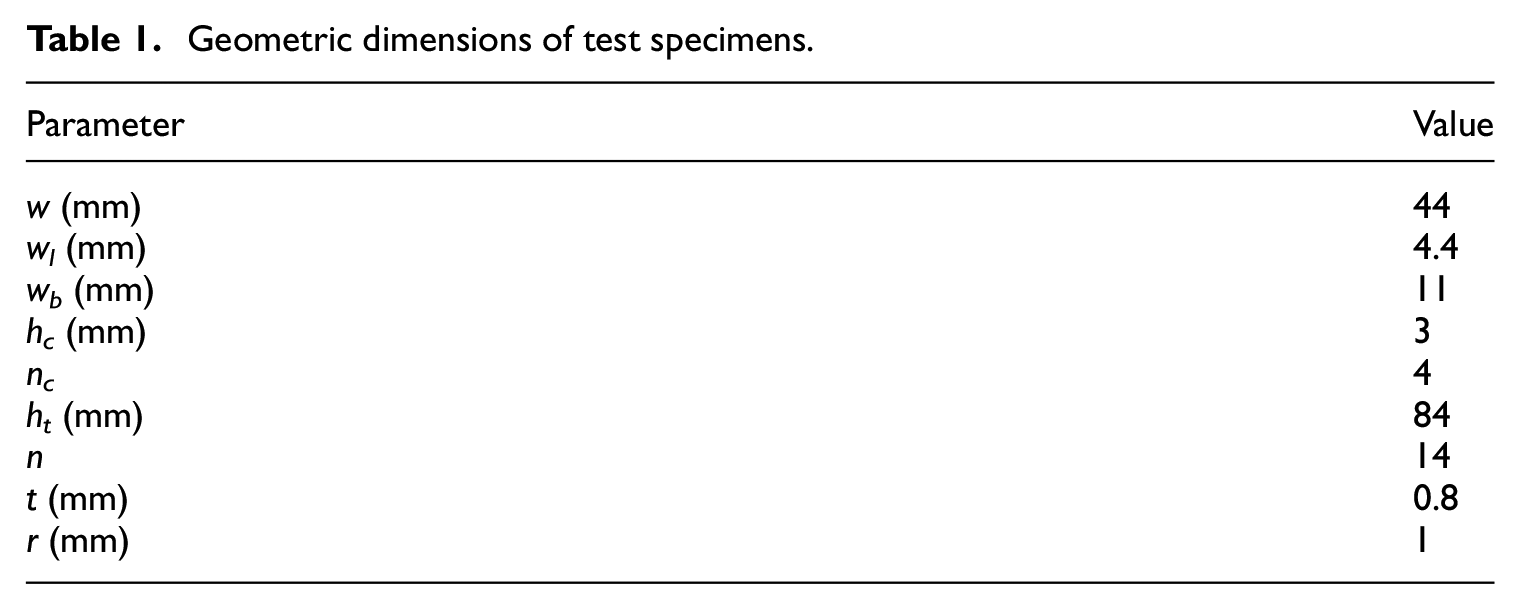
Figure 4 exhibits the experimental schematic of the specimen under quasi-static loading. The tests were conducted referring to the national standard of China GB/T 1453, which corresponds to the international standard ASTM C365. A universal material testing machine was used to crush the specimens. The specimen placed on a fixed steel plate and a movable hydraulic jack was loaded to compress the specimen with the velocity of 2 mm/min. The load force and displacement can be obtained directly from the computer that control the material test machine, and the test process was recorded with the camera placed in front of the specimen.

Schematic of quasi-static compression test.
FE modeling
The crashworthiness analysis for the multi-layered BCPS was also conducted using FEM. The nonlinear explicit finite element analysis (FEA) program LS_DYNA was adopted to perform the simulation. The FE model consisted of three components: a moving plate, a stationary plate and a multi-layered BCPS, as displayed in Figure 5. Since the two steel plates that sandwiching the multi-layered BCPS showed no deformation in the experiments, they were modeled as rigid with shell elements. The multi-layered BCPS was modeled with fully integrated shell elements with five through-thickness integration points. After mesh convergence analysis we found that an element size of 0.8 mm × 0.8 mm for the multi-layered BCPS could ensure the computational accuracy. The adjacent plates were joined together by brazing, which is a welding technique. This kind of connections between the adjacent plates were modeled with rigid elements because the connections showed only very minor failures, which can be observed in Figure 10(c). Each plate constructed with 3904 shell elements and the multi-layered BCPS had totally 54,656 shell elements. Besides, a pair of jointing surfaces was connected with 25 rigid elements, therefore, there was totally 2860 rigid elements in the FE model. The ‘AUTOMATIC_SURFACE_TO_SURFACE’ contact algorithm was used to account for contacts between adjacent steel plates of multi-layered BCPS and the contacts between the two rigid plates and the multi-layered BCPS. The coefficients of friction for all contacts were set to 0.3. 25
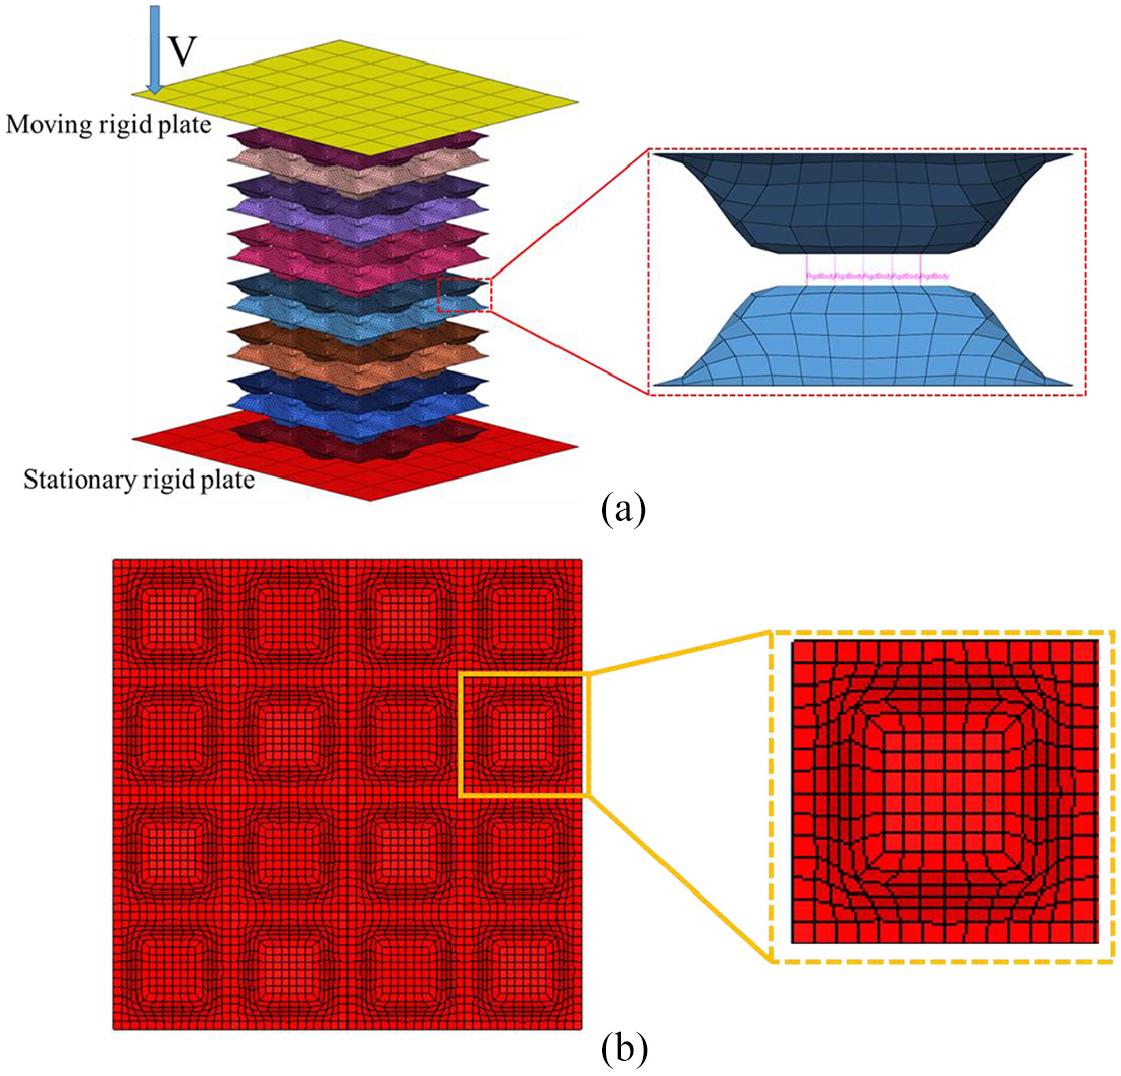
Finite element model of multi-layered BCPS: (a) Isometric side view and rigid elements and (b) top view.
The material used in the multi-layered BCPS was 20# steel, which was a mild steel. Figure 6 shows the true stress-strain relationship of the material. The material had density ρ = 7800 kg/m3, yield strength σy = 200 MPa, Young’s modulus E = 207 GPa and Poisson ratio ν = 0.3. MAT_24 (*MAT_PIECEWISE_ LINEAR_PLASTICITY) was adopted to define the material of multi-layered BCPS.

True stress-strain relationship of the material used for multi-layered BCPS.
In order to improve computational efficiency, a constant velocity, which was larger than the loading velocity in experiment, was applied on the moving rigid plate to crush the multi-layered BCPS. This method has been approved efficiently to handle quasi-static problems using explicit program. 30 However, some conditions should be satisfied to guarantee the accuracy when explicit method was adopted to deal with quasi-static events: (i) the ratio between the total kinetic energy and the total internal energy should be less than 5% over the total compression process; (ii) the crushing force-displacement response should be independent of the loading velocity. 30 The force-displacement curves under different loading velocities and the energies over the total compression process are displayed in Figures 7 and 8, respectively. It was clear that the two conditions mentioned above were satisfied. Moreover, in order to save computational time, the loading velocity of 3 m/s was chosen in the FE model.

Numerical force-displacement curves of multi-layered BCPS under different loading velocities.

Energies over the total compression process in simulation.
Validation of FE model
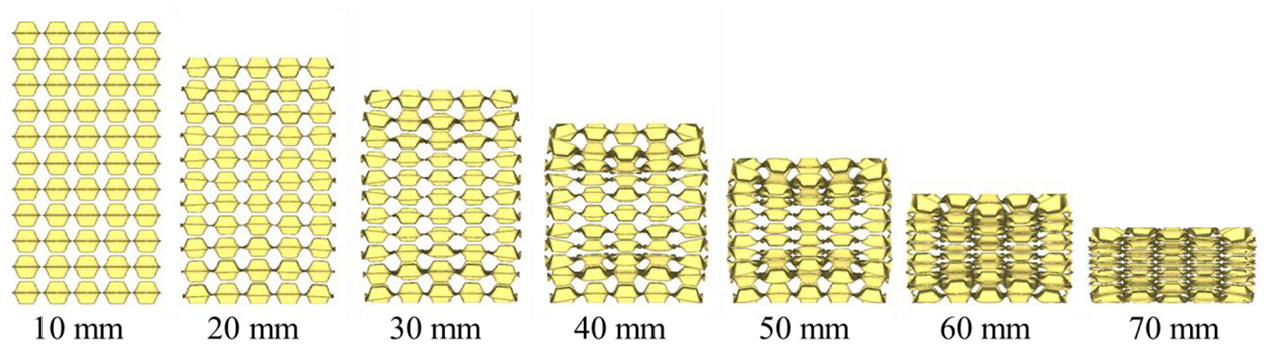
To validate the accuracy of the FE model, the deformation processes at different displacements from simulation and experiment were compared firstly, as displayed in Figure 9. It was found that the multi-layered BCPS in both simulation and experiment deformed with progressive mode and all steel plates deformed almost simultaneously. The final states of the multi-layered BCPS after compression in simulation and experiment are exhibited in Figure 10(a) and (b). Obviously, the deformation of FE simulation and experiment had good agreement. The failure modes were also compared, as shown in Figure 10(c). In compression process of experiment, the edges of jointed pyramids deformed in the direction of separation (marked with red arrows), while the edges of hollow parts deformed in the direction of jointing (marked with yellow arrows). The same phenomenon was also found clearly in the edge view in the FE simulation. In addition, some minor failures occurred at the brazing welds of corner parts (Figure 10(c)), but as compression continued, the torn weld was deformed towards the joint direction. Generally speaking, the influence of weld failure on the deformation of the whole structure was very small. However, in simulation, as the welds were modeled with rigid elements, the failure was not occurred.

Comparison of deformation process at different displacement between simulation and experiment: (a) experiment and (b) simulation.

Comparison of final state of multi-layered BCPS after compression: (a) top view, (b) front view, and (c) failure mode.
Figure 11 depicts the force-displacement curves from simulation and experiment. It was clearly that the three experimental curves had good repeatability. Furthermore, the simulation force curve can agree well with the experimental results except from 0 to 20 mm. In this stage, the simulation curve was slightly lower than the test curves. Considering the manufacturing error for specimens and experimental complexity, we believed the difference between simulation and experiment can be acceptable.

Comparison of force-displacement curves between simulation and experiment.
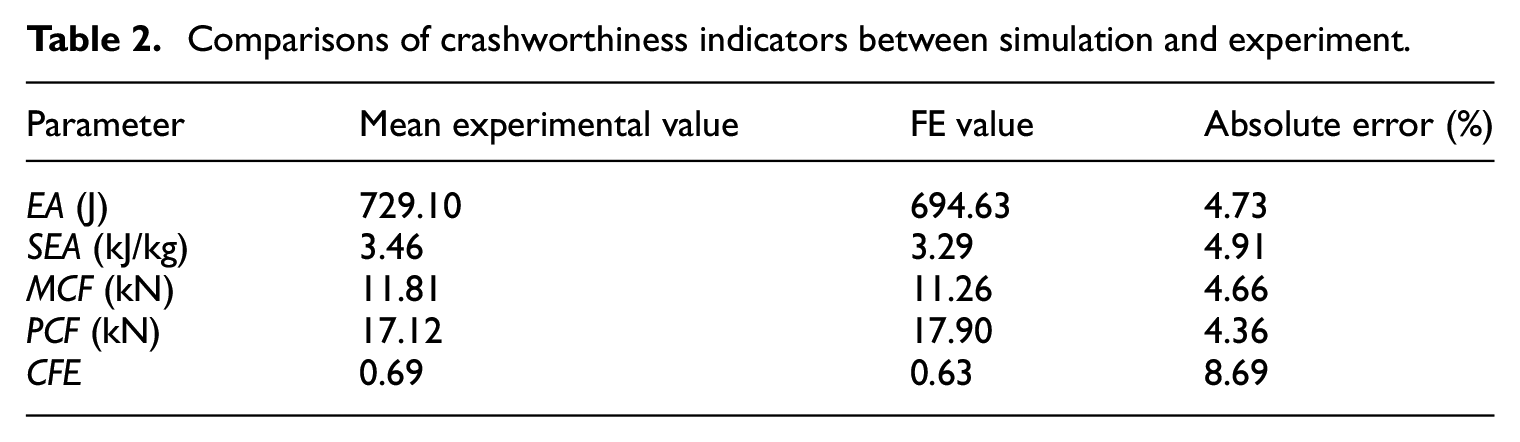
To further validate the FE model, some crashworthiness indicators should also be compared. From Figure 8 we found that the force curves increased sharply at elastic stage, and then developed a plateau stage until the specimens were compressed to densification. In the plateau region, the fluctuation of force is very small but still have a certain increase. The multi-layered BCPS has a relatively ‘flat-topped’ curve, and therefore, it belongs to type I structure. 31 As the type I structures don’t have an initial peak crushing force (IPCF), the very important indicator, that is, IPCF, is inappropriately used to access the crashworthiness of the multi-layered BCPS. Except for IPCF, other important crashworthiness indicators, namely, mean crushing force (MCF), peak crushing force (PCF), crush force efficiency (CFE), energy absorption (EA) and specific energy absorption (SEA) can be calculated to access the crashworthiness of the multi-layered BCPS. These indicators are defined below.
EA means the amount of energy absorption within the crushing range and can be defined as:
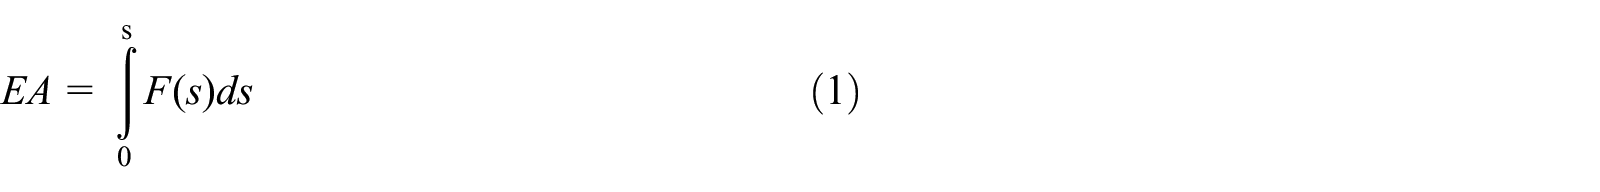
where F(s) is the instantaneous crushing force function of the displacement s.
SEA specifies the energy absorption per unit mass and can be calculated as:

where m is the mass of considered energy absorption structure. Generally, the higher the SEA, the higher the energy-absorbing efficiency.
MCF is defined as the ratio of EA to crushing distance s:

PCF is the maximum force in the crushing process.
CFE is defined as the ratio of MCF to PCF:

These indicators should be calculated within the effective stroke, which is the displacement between 0 and densification displacement. Because it was difficult to directly observe the densification point, we used an intercept method 23 to determine it. In this method, a tangent line is drawn to the densification part of force-displacement curve and the intercept of this line with the instantaneous mean crushing force was taken as the densification displacement. By using this method, the effective compression ratio ε was determined as 0.72∼0.74, as shown in Figure 11. For the convenience of calculation, we took ε as 0.7 throughout the study. The values of these crashworthiness indicators from simulation and experiment are listed in Table 2. The maximum absolute error was 8.69%, which was within an acceptable range. Above all, the FE model had high accuracy and can be used for further analysis.
Comparisons of crashworthiness indicators between simulation and experiment.
Approximate model and factorial analysis
Design of experiment (DOE)
The crashworthiness performance of the multi-layered BCPS was related to some geometric parameters, such as w, wb, ws, nc, among others. The relations of the crashworthiness responses and geometric parameters are always complicated and may not be expressed mathematically. To this end, surrogate models, such as response surface (RS) models,32,33 can be used to express these relationships. To construct accurate models, DOE method is always used to take sample points in the design space.34,35
Variables and responses
In the present study, the width w, total height ht, and wall thickness t of the multi-layered BCPS are considered as constant. The number of the cellular structures along the width nc, the width of small square ws and width of big square wb of the pyramid cell, the height of cell structure hc, and number of plates nl were regarded as design variables to investigate the crashworthiness of the multi-layered BCPS. As mentioned in Section 2.1 that there was a relationship between hc and nl, namely, ht = 2nl·hc. Since ht had been considered as a constant, it was only need to take one between nl and hc as an active variable, another one will be a dependent variable. Here nl was regarded as the active variable. Similarly, since we had wb = w/nc, when we set w as a constant and nc as an active variable, wb also became dependent variable like hc. However, in this situation it was hard to determine the scope of ws because the change range of ws will be different for different values of wb. Therefore, another parameter η = ws/wb was introduced here to deal with this problem. Finally, the variables we needed to consider were nc, nl, and η. In the present study, the scopes of the three variables were set as 2 ≤nc≤ 8, 8 ≤nl≤ 20, and 0.2 ≤η≤ 0.6. Noting that nc and nl must be integers.
Sampling design
For the multi-layered BCPS, the variables nc and nl must be integers in certain ranges, and therefore the two variables were discrete. There are many DOE methods available to handle discrete problems, such as Full Factorial design (FFD), 36 Central Composite design (CCD), 36 Latin Hypercube design (LHD), 37 Taguchi design (TD), 38 among others. Cao 18 and Kılıcxaslan 22 et al. and Sarıkaya 23 et al. reported the crushing behaviors of multi-layered corrugated steel plates with triangle and trapezoid profile, respectively, they both found that the relationships between crushing responses and geometric parameters were complicated, and the deformation modes differed a lot for structures with different geometric parameters. To the end, the FFD method was adopted in the present study to take sampling points to ensure the accuracy of surrogate model, even though much time would be consumed for FE simulation. By setting the levels of the variables nc, nl, and η respectively to 4, 4, and 5, a total of 80 sampling points was obtained. The levels and values of each variable are listed in Table 3.
Values of design variables in full factorial design.

In addition, another matrix should be used to validate the accuracy of the surrogate models. The validation sampling points should be produced randomly. Because artificial control was difficult to guarantee randomness, the validation sampling points were also obtained using a DOE method. Here, the LHD method, which is also used widely in structure optimization, 39 was adopted. Totally 25 validation sampling points were produced and are shown in Figure 12. The values of the variables are also listed in Table 4.
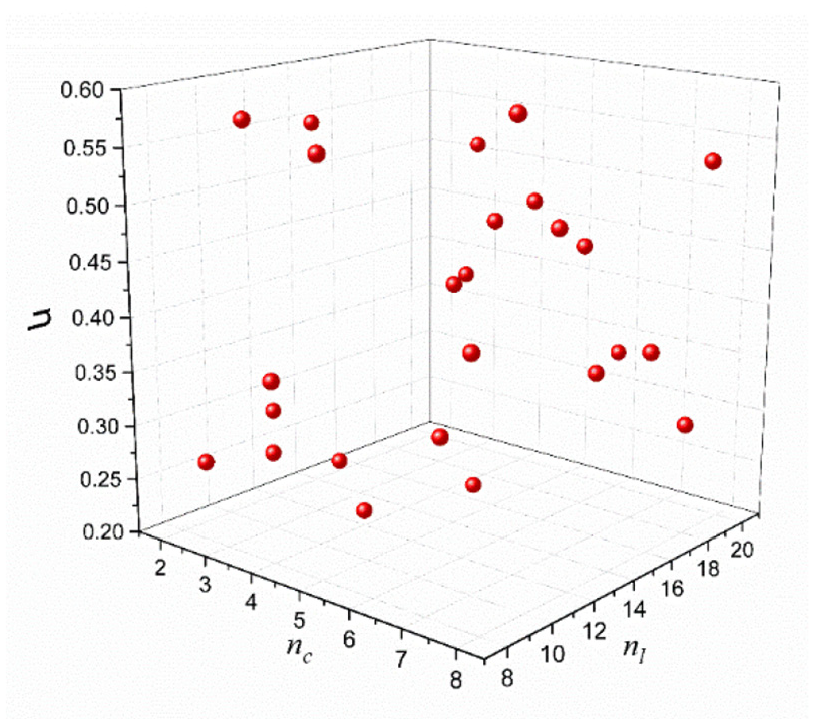
Points sampling using LHD method.
Comparisons of various responses from FE simulation and RBF fit in validation matrix.

Approximate model
Radial basis function (RBF) method was employed to fit the approximate model. RBF method is a fit method that uses linear combinations of basis functions. Typical basis functions are linear, cubic, thin-plate spline, Gaussian, multiquadric, and inverse-multiquadric. These basis functions are observed to be accurate for highly nonlinear output responses but not for linear output responses. To remedy this deficiency, the RBF model is augmented with a polynomial function:

where n is the number of sampling points, x is a vector of input variables, xi is the ith sampling point, ||x-xi|| is the Euclidean norm, Φ is a basis function, and λi is the coefficient for the ith basis function. pj(x) is a low-order (constant or linear) polynomial function; cj (j = 1,2…k) are the unknown coefficients and k is the total number of terms in the polynomial.
RBF method is always used for structural optimization and has been approved as an efficient way.40–42 Furthermore, the RBF has good performance for nonlinear problems. Therefore, the RBF method was recommended for construct surrogate model for the multi-layered BCPS.
Based on the result of FFD, the fitting surfaces for the three responses constructed using RBF method are plotted in Figures 13–16. It can be seen that the PCF, EA and SEA had the almost same change trend. The influences of the geometric parameters on the four responses will be discussed later.

Response surface of EA: (a) nc = 2, (b) nc = 5, and (c) nc = 8.

Response surface of PCF: (a) nc = 2, (b) nc = 5, and (c) nc = 8.

Response surface of CFE: (a) nc = 2, (b) nc = 5, and (c) nc = 8.
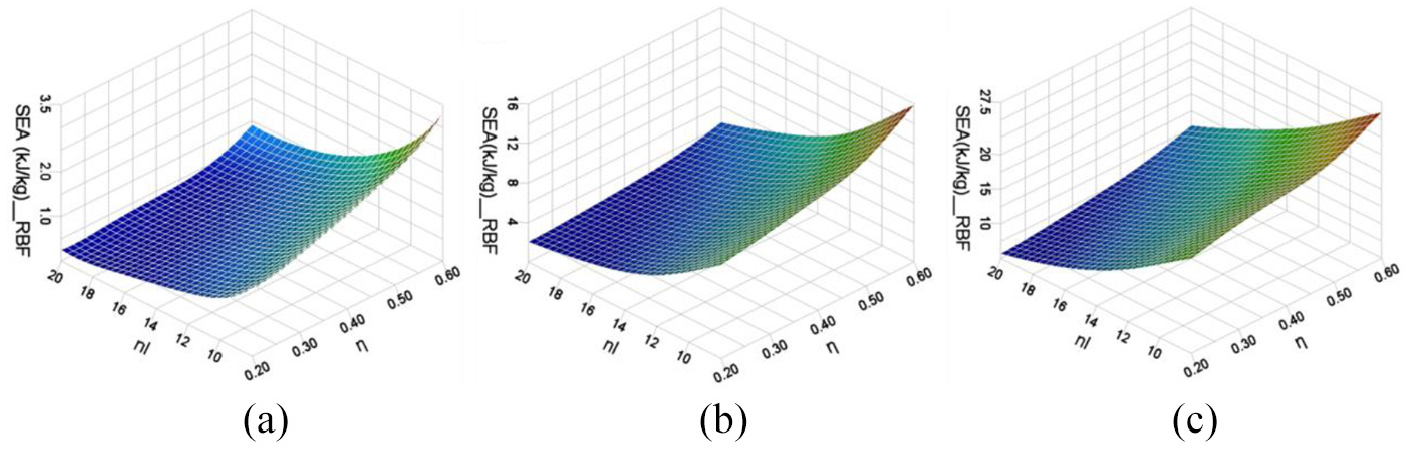
Response surface of SEA: (a) nc = 2, (b) nc = 5, and (c) nc = 8.
Error analysis of approximate model
Two parameters, namely, R-Square (R2) and Relative Average Absolute Error (RAAE), were adopted to access the accuracy of the surrogate models. The two parameters are defined as follows:


where n is the number of sample points, yi denotes values of the ith point,
R2 is a measure of how well the Fit can reproduce known data points. The value of R2 typically vary between 0 and 1. The higher the value of R2, the better the quality of the fit. In practice, a value of R2 above 0.92 is often very good. RAAE indicates the ratio of the average absolute error to the standard deviation. A low ratio is more desirable as it indicates that the variance in the Fit’s predicted value are dominated by the actual variance in the data and not by modeling error. Table 5 lists the values of the two accessing parameters of the fit results. It can be seen that the fit had good accuracy.
Accessing parameters of fit results.

In addition, the value of every response from FE simulation and RBF fit of validation matrix are compared in Table 5. It was clear that the results were in a reasonable agreement. Above all, it can be concluded that the approximate model had high precision and the optimization based on the surrogate models can be believable.
Main effect analysis
Figure 17 shows the main effects of the geometric variables on responses. The effects were calculated for normalized input variable ranges of [0, 1], and each curve was obtained by fixing the other two variables as 0.5. It was found that PCF, EA, and SEA all increased with increasing nc and η, but decreased with increasing nl. It was also found that nc had more significant influence on the three responses than η. Moreover, when nl and η were larger than 0.5, the curves for PCF, EA, and SEA became more steeper than that when the two variables were smaller than 0.5, which indicated that nl and η had more significant influence on the three responses when they were larger than 0.5. Oppositely, nl influenced the three responses larger when it was smaller than 0.5. The effects of the three geometric parameters on CFE response were relatively complex. When 0 ≤η≤ 0.3, CFE was positively correlated to η; while when η > 0.3, CFE decreased with increasing η. With nc increased, CFE increased first when nc≤ 0.3, then decreased when 0.3 < nc≤ 0.7, and then increased when nc was larger than 0.7. CFE varied in a small range [0.57, 0.65]. The variable nl had roughly positive effect on CFE response, which was opposite to that on the other responses. In addition, with nl increased, the CFE varied in an interval of [0.43, 0.71], which is 3.5 times of that when nc changing. Obviously, nl had the most significant on CFE response.

Effects of geometric variables on responses: (a) PCF, (b) EA, (c) CFE, and (d) SEA.
Optimization
Description of optimization problem
Multi-objective optimization (MOO) was adopted here to obtain the optimum configuration of the multi-layered BCPS. Among the responses analyzed in previous section, the SEA and PCF were particular important and are always been regarded as optimization objectives because an ideal energy-absorbing structure is always expected to absorb as much energy as possible with relatively as low peak crushing force as possible. 30 Besides, since the three parameters nc, nl, and η had evidently effects on the crashworthiness performance of the multi-layered BCPS, they were regarded as optimization variables. Therefore, the MOO problem of the multi-layered BCPS under axial loading can be formulated mathematically as follows:

Optimization algorithm
In the present study, the software Hyperstudy was used to perform the optimization work. Multi-Objective Genetic Algorithm (MOGA) was utilized to solve the MOO problem. MOGA is an efficient optimization method and is used widely in structure optimization. More importantly, MOGA can handle discrete problem. MOGA is an extension of Genetic Algorithm to solve MOO problems. In MOO problems, there is more than one objective function to be minimized or maximized and as such the goal is not to find an optimum but to find the Pareto front instead. Pareto front is a collection of non-dominated designs. Non-dominated designs are better than other designs because at least one of the objective functions are considered. The flowchart of the MOGA process is shown in Figure 18. In MOO methods, the challenge is to find a homage MOGA that uses a crowding distance evaluation to help create a good distribution of the points on the Pareto front. MOGA terminates if one of the conditions below are met:
The convergence criterion is satisfied. This occurs when the minimum number of allowable iterations are run, feasible designs are found, and the non-dominated designs did not change in the last iteration.
The maximum number of allowable iterations is reached.
An analysis fails and the ‘Terminate Optimization’ option is the default.

Flowchart of the MOGA process.
Results and discussion
Adopting MOGA method, the pareto fronts for the crashworthiness optimization of multi-layered BCPS was obtained as displayed in Figure 19. It can be seen that a large number of optimum solutions were included in the pareto fronts, and the two objectives, namely, -PCF and SEA, compete against each other obviously. The most satisfactory solution was selected by using the ‘distance minimization’ criterion, which is formulated mathematically as follows:

where m is the number of the objective function,
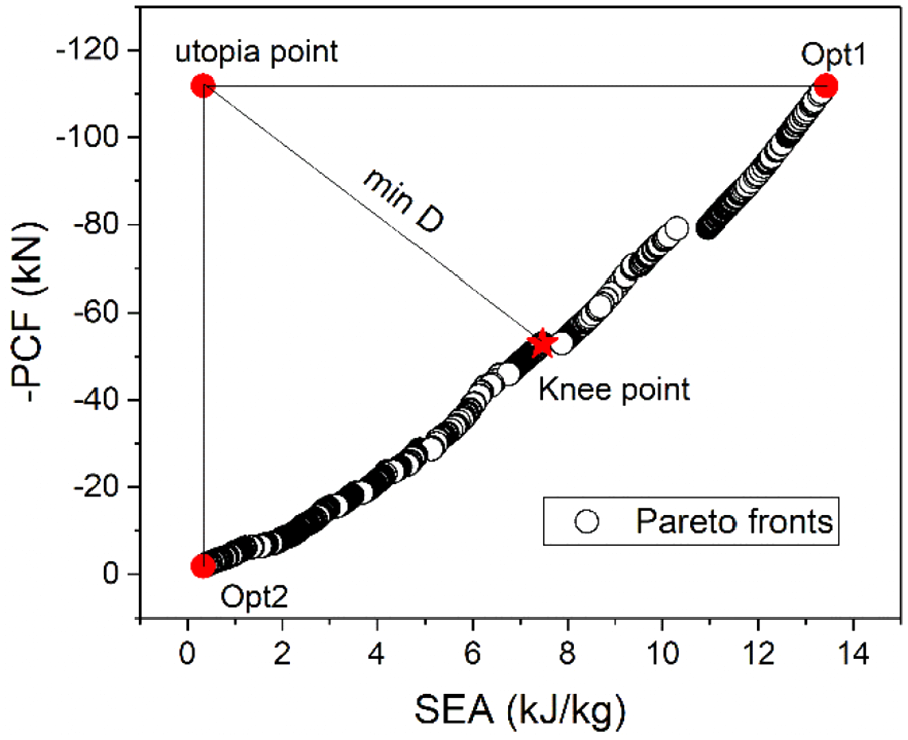
Pareto fronts for the crashworthiness optimization of multi-layered BCPS.
It was observed from Figure 19 that the values of PCF were almost 10 times of SEA. To ensure the accuracy of selecting the most satisfactory solution, the values of two objectives were both set to a normalized range of [0, 1]. Then the most optimum solution (Knee point) was obtained using the ‘distance minimization’ criterion, as shown in Figure 19.
The values of variables nc, nl, and η of the most optimum configuration of multi-layered BCPS were 5, 11, and 0.38, respectively. Then a FE simulation was conducted by using the optimum parameters to validate the optimized results. Table 6 shows the comparison between the predicted and numerical results. It can be seen that the percent errors were within acceptable range, hence the optimized results were validated. The deformation process at different displacements of the optimal configuration were listed in Figure 20, it can be seen that the deformation was still stable after optimized. The comparison of the force-displacement curves between the optimized and original results are presented in Figure 21. The plateau stage of the optimized curve increased a lot compared with the original one. The mass of the optimized and original multi-layered BCPS were 200.6 g and 211.0 g, respectively. Therefore, the SEA response improved much after optimized. The original and optimized SEA are 3.29 kJ/kg and 8.02 kJ/kg, respectively. The value increased by 143.76% after optimization.
Confirmation experiment of optimal solution.

Various stages of deformation of the optimum configuration.
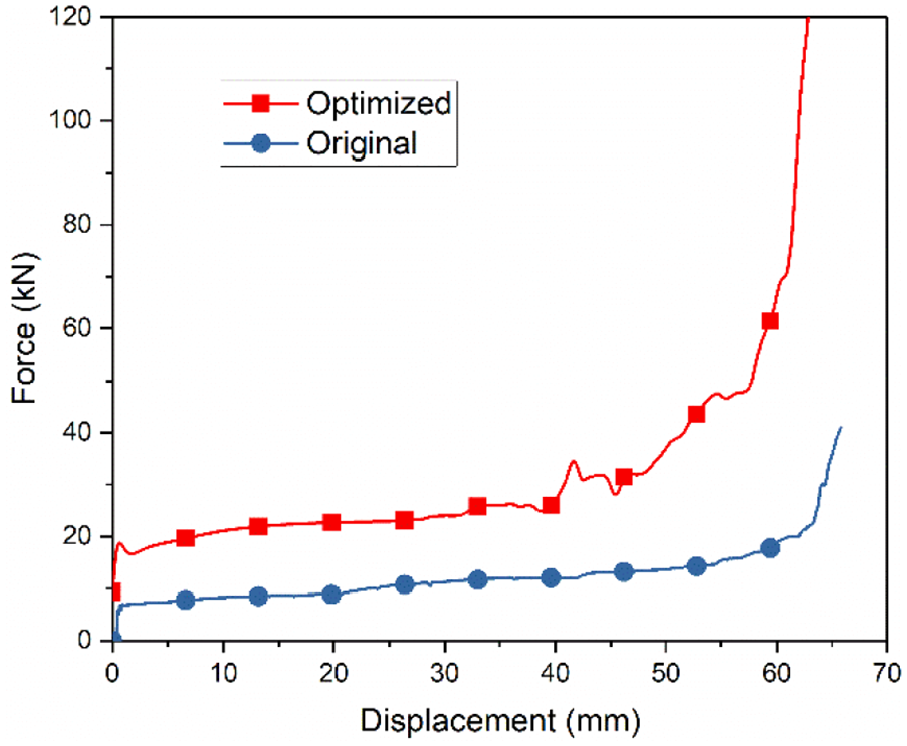
Comparison of original and optimized results.
Conclusion
In this paper, a multi-layered BCPS was proposed for energy absorption. Quasi-static compression tests and FEM were adopted to investigate its crashworthiness performance. Besides, a multi-objective optimization was performed based on the FE results to find the optimum configuration of the multi-layered BCPS. Based on the results, some important conclusions were drawn and listed as follows:
The multi-layered BCPS showed very small initial peak crushing force, and the fluctuation of force was very small during the whole compression process. These characteristics made the multi-layered BCPS more advantageous in crashworthiness than traditional structures.
The crashworthiness indicators PCF, EA, and SEA all increased with increasing nc and η, but decreased with increasing nl. Besides, nc had more significant influence on the three crashworthiness indicators than η.
The optimum configuration obtained from the multi-objective optimization was nc = 5, nl = 11, and η = 0.38. The original and optimized SEA were 3.29 kJ/kg and 8.02 kJ/kg, respectively. The SEA increased by 143.76% after optimization.
Footnotes
Declaration of conflicting interests
The author(s) declared no potential conflicts of interest with respect to the research, authorship, and/or publication of this article.
Funding
The author(s) disclosed receipt of the following financial support for the research, authorship, and/or publication of this article: The present work was supported by the National Key Research and Development Program of China (grant number 2016YFB1200404-04), the Fundamental Research Funds for the Central Universities of Central South University (grant number 2019zzts269), the National Natural Science Foundation of China (grant number 51675537), and the Project of the State Key Laboratory of High Performance Complex Manufacturing (grant number ZZYJKT2018-09).