
Abstract
It is observed that T-bolt fracture of DT III fastener affects the safety of railway operations. The present study is aimed at finding solution to this critical issue of DT III T-bolt fracture. The paper is based on outcomes of field studies and analysis of relationship between bolt installation torque and stress. A refined DT III fastener model is established based on test data and nonlinear contact theory as per the actual size of each component. It is being observed that head-shank joint is a critical area during service. With respect to fatigue and stress, when the installation torque is less than 300 KN-mm, the bolt is prevented from yielding during installation. To a certain extent it also improves the fatigue life of bolt. From the frequency spectrum point of view, the vibration sensitive frequency band (1050–1100 Hz, 1230–1270 Hz) of bolt in service is very close to the main frequency of bolt vibration (1200 Hz). It may cause bolt fracture. In order to avoid resonance, the train operational speed should be strictly controlled between 115 km/h and 120 km/h.
Introduction
As an infrastructural subsystem of urban rail transit system, a good railway track is the basis of smooth and safe train operations. Fastener being one of the key components of railway track, its key role is to provide elasticity for the track structure and maintain good track geometry. This is essential for the stability and safety of train operations. DT III fastener system is widely used in urban rail transit lines of China because of its ease of installation and disassembly, good elasticity, track gauge and height adjustment ability. However, the operational practices in recent years shows that some metro lines have developed fastener failure because of T-bolt fractures, which seriously affects the safety of train operations.
Numerous scholars have investigated the failure of fastener system from the angle of frequency domain and stress. A new method using time and frequency related transformations was developed firstly by J Smutny 1 to evaluate the dynamic response relationship of the fastening system. Javad et al. 2 studied the influence of train speed and axle loads on rail fastening clips and proposed that increase in an axle loads cause increase in the clip plastic deformations. Xiao et al. 3 analyzed the modal shapes and harmonic response of fastener system, and demonstrated that the corrugation frequencies agreed with resonance frequencies of clip. Shang et al. 4 simulated the different install states of clip and thought the reasonable installation state can avoid the fastener failure effectively. An on-site test and numerical simulation were conducted by Choi et al. 5 The study opined that the deformation of the base plate and large shear stresses on the anchor bolts causing bolt fracture. The microstructure, metallographic examination and hardness testing of material was analyzed6–9 and the authors proposed the main cause of fracture is relevant to complex stresses and treatment process.
Also, the fatigue life analysis of the fastener has been conducted by many scholars. Casado et al. 10 designed fatigue tests on the fastener system and proposed the model to identify the key stages of the fatigue process. Deshimaru et al. 11 developed a method for predicting the fatigue life of clips by establishing the relationship between load and stress on the spring clip. A combined solution of ABAQUS and FE-SAFE was used by Xiao et al. 12 to evaluate the performance and the fatigue life of the e-clip in metro fastener system. Park et al. 13 evaluated the fatigue strengths of the clamps SKL15 using Goodman and Gerber curves, and thought the greater stress amplitude resulting in fatigue cracking. A novel model was proposed by Li et al. 14 to analyze the mean stress effect on fatigue performance of fastener bolt and they demonstrated the new model is closer to fatigue test date. As for fatigue standard or code of railway fastener, the fatigue property and test condition of the parts of fastener is specified by these standards.15–17 The industry standard TB/T 2491-94 Fatigue test method of fastening assembly 18 and the high-speed railway standard TB/T 3396.4-2015 19 elaborate the test methods of fatigue performance of fastening assembly.
It can be observed from the research done so far in China and abroad that, scholars have analyzed the cause and mechanism of clip fracture in fastener system. However, as far as we know there are few studies on fracture of bolt in fastener failure and existing studies focused mainly on experimentation, traditional FEM methodology and stress analysis. Further research is needed on T-bolt failure. Moreover, due to the complex shape, less volume, operational boundary conditions, stress conditions of fasteners, the traditional method of modeling is done by constraining the boundary of contact part between experimental part and surrounding parts. Then external force is applied at a certain point or surface to simulate the real time situation. This methodology is very simple in nature. It does not reflect the stress state and fracture mechanism of fastener.
According to analysis above, the refined fastener model, based on the nonlinear contact theory, was established in real size for the analysis and verified by a novel on-site test method. The refined model can exactly reflect the interaction of the parts in fastener and reveal the fracture mechanism of bolt. In the present study, initially field tests on DT III fastener are carried out. Later, based on model verification, a refined model of fastener is proposed to identify the reason for fastener bolt fracture from three perspectives namely: (1) Frequency Analysis (2) Stress Analysis, and (3) Fatigue Analysis.
Frequency response analysis: Analyze the modal vibration mode and natural frequency of the bolt in service, carry out frequency sweep analysis on the fastener system and explore whether the bolt fracture is caused by resonance based on the field measured data.
Stress analysis: Analyze the bolt stress after fastener assembly and explore the possibility of bolt fracture because of improper installation.
Fatigue analysis: Analyze the fatigue life of bolt under long-term train load and analyze whether the bolt fracture is caused by repeated train load.
Field tests
According to Figure 1, the DT III type fastener is mainly composed of elastic clip, bolts, iron tie pate, insulator, washer, etc. and is suitable for 60 kg/m rails. The clip is made of clip steel with 60Si2Mn material and the T-bolt model is T30×157 Q235 steel. The buckle pressure of a set of fasteners is not less than 22 kN and the range is 13 mm. The gauge can be adjusted by the insulator. The adjustment range is −12 mm to +8 mm. A 10mm thick TPEE under-rail composite pad is placed under the rail. A16 mm thick elastic pad is placed under the base plate and the height is adjusted in the range of 0–20 mm. The fastener node has a comprehensive vertical static stiffness of 20–35 kN/mm.
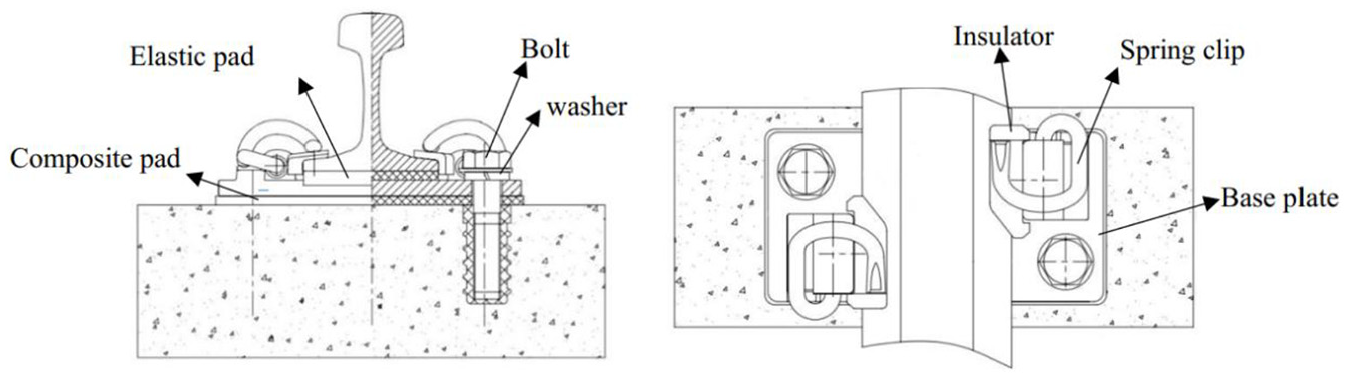
DT III Fastener design drawing.
Static test
Fastener assembly bolts need to be pre-tightened before assembly. The pre-tightening force can enhance the tightness and anti-loosening ability of the fastener system. The pre-tightening force has a direct impact on the bolt stress during its service span. In the field static test, the relationship between the bolt stress and the installation torque of the bolt can be obtained. By static test, the accuracy of the refined fastener model can be checked. The field static test setup is shown in Figure 2.

Field static test.
As shown in the Figure 2, the pin sensor is used to test the fastener bolt stress in the field tests. Before the test, drill a central hole with a ϕ 2 mm in the bolt at its top. In order to eliminate the influence of complex stress on the test results, install the needle shaped strain gauge into the hole at a diameter depth below junction of the bolt head and shank. Seal it completely with special glue and make waterproof treatment. During the tests, the bolt and the temperature compensation plate are connected to the Wheatstone bridge. To analyze the relationship between the bolt stress and installation torque, consider the randomness of field installation, we need to get the strain of bolt when the installation torque is equal to 100, 200, 300, 400, and 500 kN-mm respectively. In on-site test, the bolt micro-strain is measured using strain gauge and the relationship curve between bolt installation torque and micro-strain is obtained, as shown in Figure 3:


The relation between installation torque and micro-strain.
Knowing E and micro-strain values of bolt from field tests, the stress could be determined and plot of installation torque V/s stress is developed as shown in Figure 4:
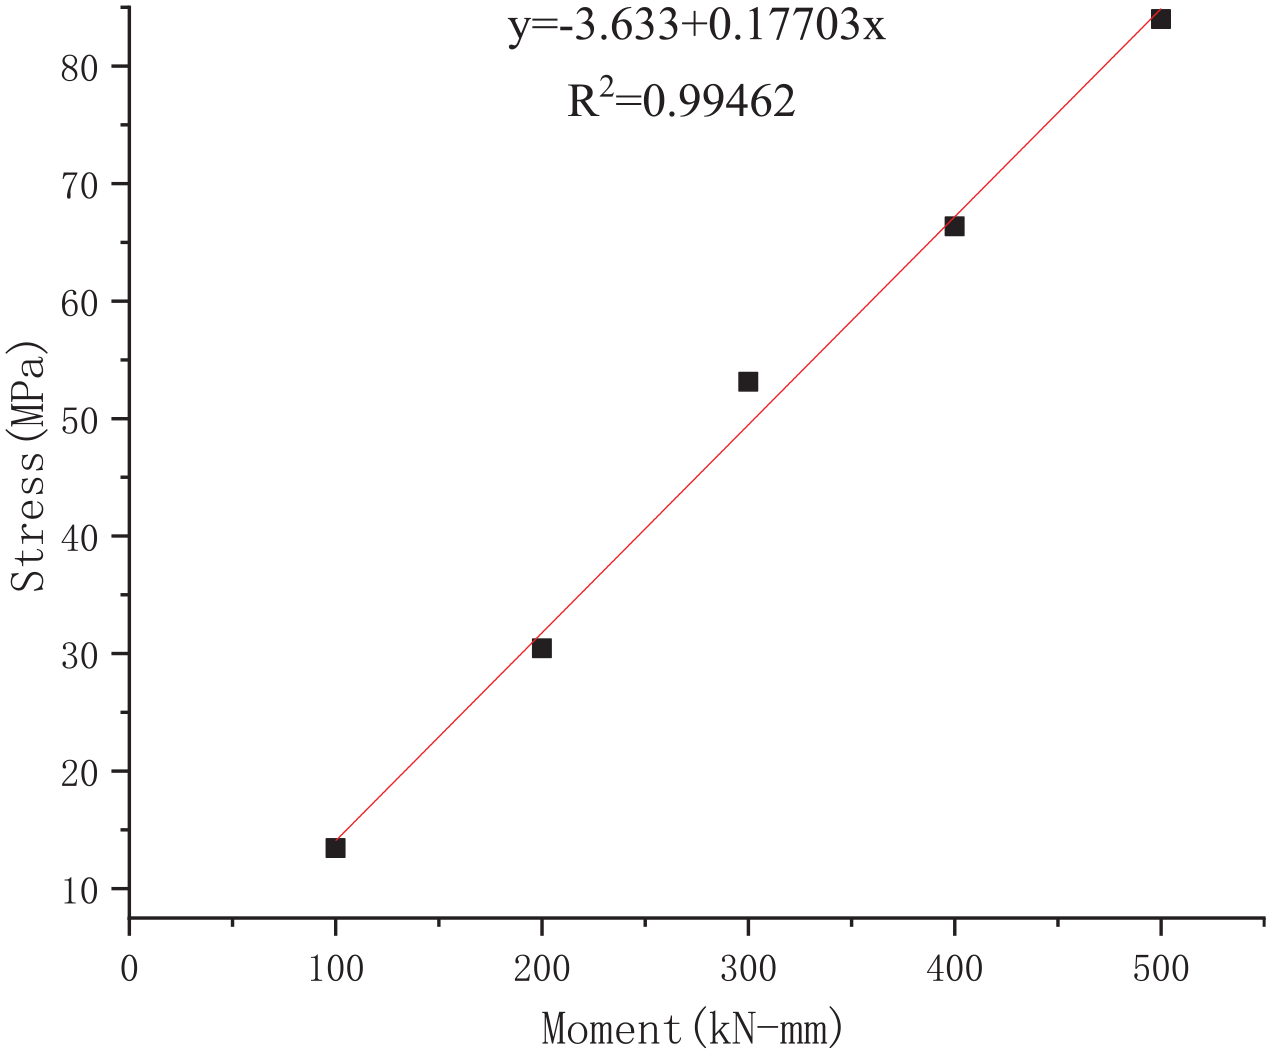
The relation between installation torque and stress.
The relationship between the installation torque and the stress is
Dynamic test
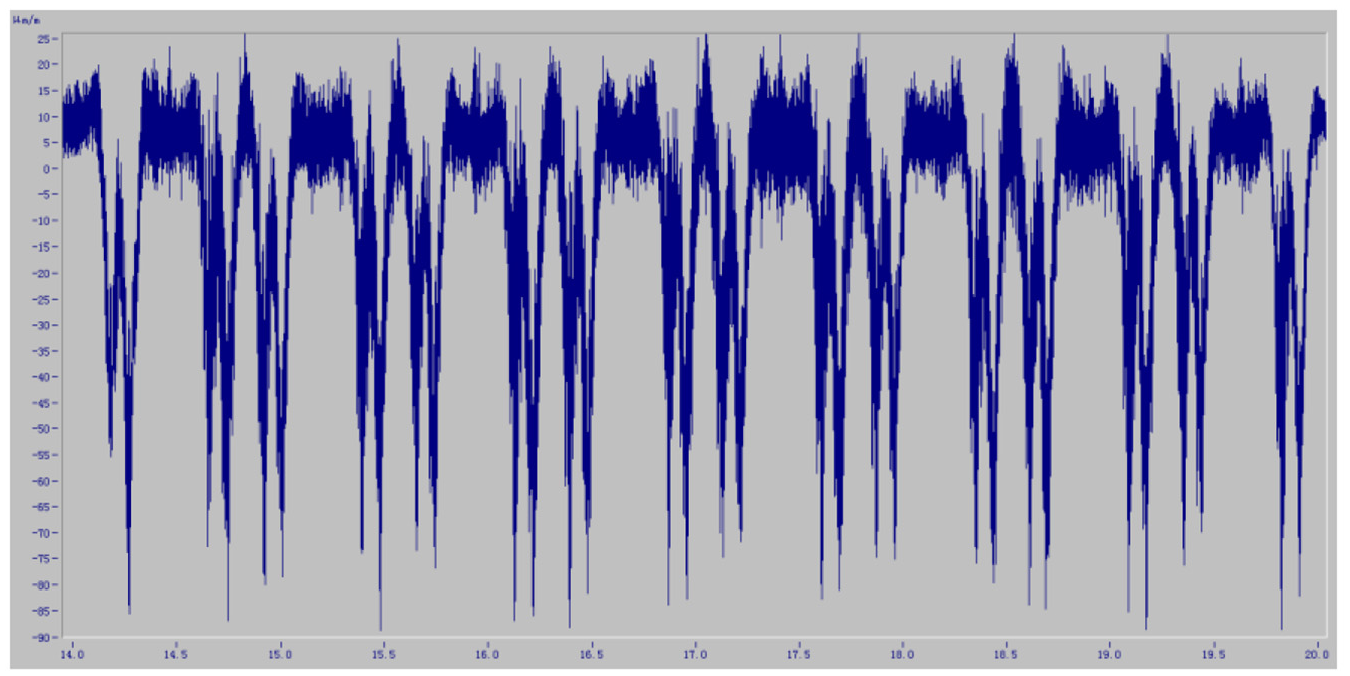
The straight-line section with the most observed failures of DT III fastener was selected as the test site. A-type metro vehicle whose axle load is 16 t has an eight-car formation and the speed is 120 km/h in this section. The dynamic test gives the vibration acceleration of fastener and vertical displacement of rail under the train load. Using appropriate conversion factors, for test acceleration values, the operating frequency of T-bot can be obtained. The vertical displacement of the rail can provide the load application conditions for the subsequent fatigue analysis model. As shown in Figure 5, while testing the vertical vibration acceleration of the bolt, fix the piezoelectric acceleration sensor on the nut surface. Connect the coaxial cable to the charge amplifier and Data Acquisition System (DAQ) for testing.

Bolt acceleration test diagram.
The set of valid data obtained in the field tests (Figure 6) is converted into the amplitude-frequency curve by the Fast Fourier Transform (FFT) using the Famous platform programming. The main frequency of the bolt acceleration vibration obtained is shown in Figure 7:

Time history graph of bolt acceleration.

Frequency-amplitude curve of bolt acceleration.
When the train travels at high speeds, the rail produces a certain amount of vertical displacement because of vibrations induced. This vibration displacement has a great influence on the stress state and fatigue life of the bolt. Therefore, it is necessary to carry out experimental research on the spot. Figure 8 shows on-field experimental setup along with arrangements for fixing elastic-type displacement gauge which in turn are connected to DAQ system for measuring vibrations caused by train movements. Figure 9 shows time-history graph of rail displacement.

Field dynamic test.
Time history diagram of the rail displacement.
According to the experimental data, the rail displacement varies periodically. There will be some reciprocal vibrations from the rail to the trains during the train movement. On-site data is calibrated to obtain the vertical displacement of the rail. The statistics of the specific calibration results are shown in Table 1.
Vertical displacement of rail (mm).

Fastener simulation
The fastener model
In this paper, for the model establishment and analysis of the fastener systems, the finite element analysis software ABAQUS is selected, which mainly assumes that the elastoplastic model features can truly reflect the bolts’ on-site condition. The two main solver modules: Standard and Explicit have advantage in solving non-linear problems. Even the post-processing visualization is relatively easy. In addition, the software FE-SAFE is used to analyze the fatigue. Data interface is used for interfacing with FEM application and post-processing. Also, considering that the research object of is metal materials, FE-SAFE is used to analyze the fatigue of fasteners in this paper. The FE-SAFE module has an advanced single-axis fatigue calculation method that allows calculation of elastic or elastoplastic load history. The software has good applicability to fatigue analysis of bolts.
When performing fastener refinement modeling in ABAQUS, according to the actual size, the solid element is used to model the components of the DT III fastener. The components include: T-bolt, rail, spring clip, base plate, insulator, washer and sleepers. In order to compare with on-site test data and avoid the boundary effect caused by the symmetry constraint at both ends of the rail, establish a refined fastener model with a rail length of 3.6m and a fastener spacing of 0.6 m. Finally, the central fastener is taken as the sample specimen for the current research, as shown in Figure 10.

Model diagram of DT III fasteners.
It can be seen from the field observation that the fracture occurs at the bolt shank and bolt head interface as shown in Figure 11. The mesh is further refined for making the computations more accurate. Considering the bolts’ on-site condition, binding constraints on the T-bolt threaded portion during modeling.

Mesh diagram of T-bolt model.
Material properties
To ensure the accuracy of the calculation, the material properties in the fastening systems are defined according to the factory index.
E-clip
E-clip is made by 60Si2Mn steel, according to Chinese Standard GB/T1222-2007 clip steel, 20 the chemical composition of the clip is mainly Fe, 1.5% −2% Si, 0.7–1% Mn, and 0.56–0.64%C, etc. The material properties in the standard are shown in Table 2.
The material properties of the clip.

The clip adopts a theoretical elastoplastic model, based on the material characteristics and processing technology and also combined the elastoplastic model in ABAQUS. When the elasto-plasticity of the model is defined in ABAQUS, the material constitutive relation of the clip adopts the ideal linear reinforcement elastoplastic model. The characteristic of this model is that after the material yields, the stress is still increasing. The yield strength of the elastic clip is 1200 MPa, the ultimate strength is 1300 MPa, and the strengthening elastic modulus is E1 = 0.1E. The constitutive relationship is shown in Figure 12.
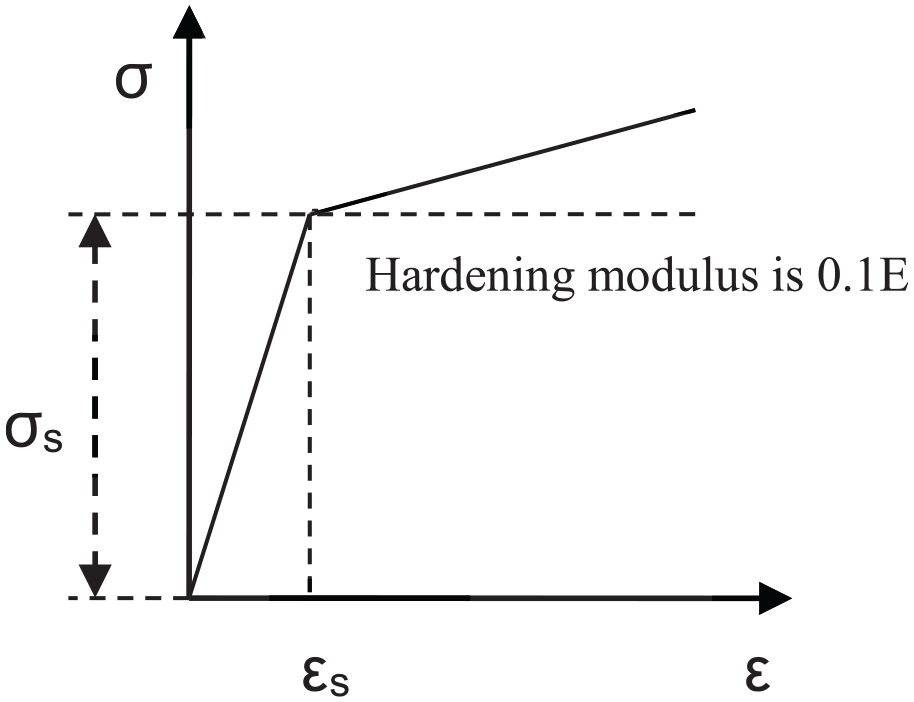
Bilinear model.
In the Figure 12, OA indicates the elastic stage of the material, while line AB represents the material in the linear strain-hardening elasto-plastic process. The stress-strain relationship is as follow:

T-bolt
The main function of the bolt is to connect the rail to the sleepers and fix the fastener. The bolt type is T30×157, and is made of Q235 low carbon steel. According to Chinese Standard, GB/T 700-2006, 21 the chemical composition of the bolt is mainly Fe, 1.4% Mn, 0.35% Si, and 0.2%C, etc. The T-bolt adopts the ideal linear reinforcement elasto-plastic model and the reinforced modulus assumes E2 = 0.1E. The material properties of T-bolt in the standard are mentioned in Table 3.
Material characteristics of bolt.

In addition, the base plate is made by KTH350-10 ductile iron; the insulator is made of glass reinforced polyamide 66; the rail type is 60N, made with U71Mn alloy steel; the sleeper is made of C50 concrete. A summary of the material properties for each part of the model are mentioned in Table 4.
Material characteristics of model.

The contact and boundary
In order to simulate the actual stress state more realistically, the contact relationship between various components adopts the nonlinear contact theory to deal with the ‘face-to-face’ contact in the model. Some examples could be: spring clip and base plate, spring clip and insulator, bolt and base plate, washer and base plate, rail, and insulator, etc. (Figure 13). Among them, the normal contact adopts the ‘hard contact’ in ABAQUS, which means the normal contact force between the contact faces is of only pressure. The two parts are not allowed to invade or penetrate each other; while the tangential contact adopts the Coulomb friction model, with the introduction of penalty friction formula, which allows the ‘elastic slippage’ as shown in dotted lines in Figure 14. The ‘elastic slippage’ is a small amount of relative movement occurring between the contact surfaces. When it occurs, ABAQUS can automatically choose the penalty stiffness. By such contact settings, the discontinuity caused by the bonding and the slip in fastening system can be solved. The boundary condition of the two ends of rail adopts the symmetrical constraint, along with the bolt thread and the bottom of the sleepers.
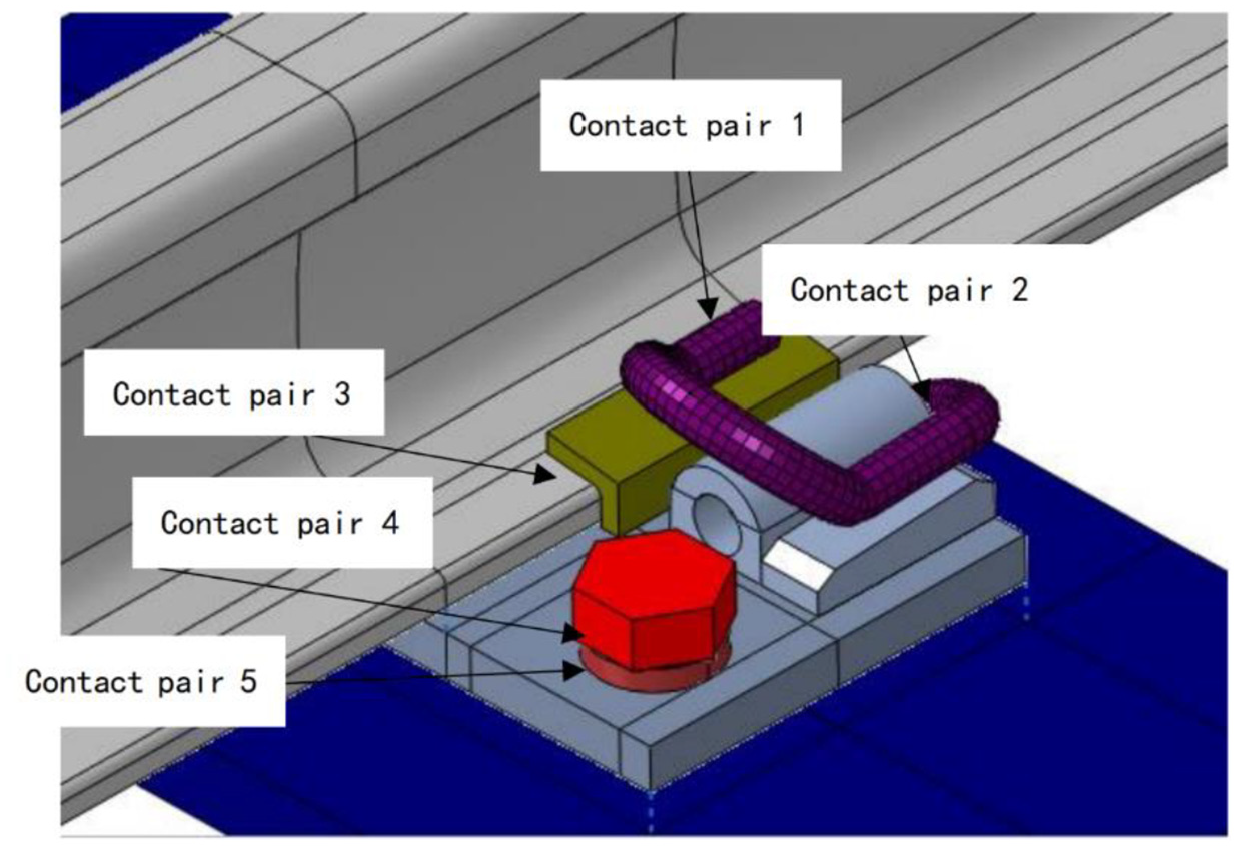
Contact relationship of components.
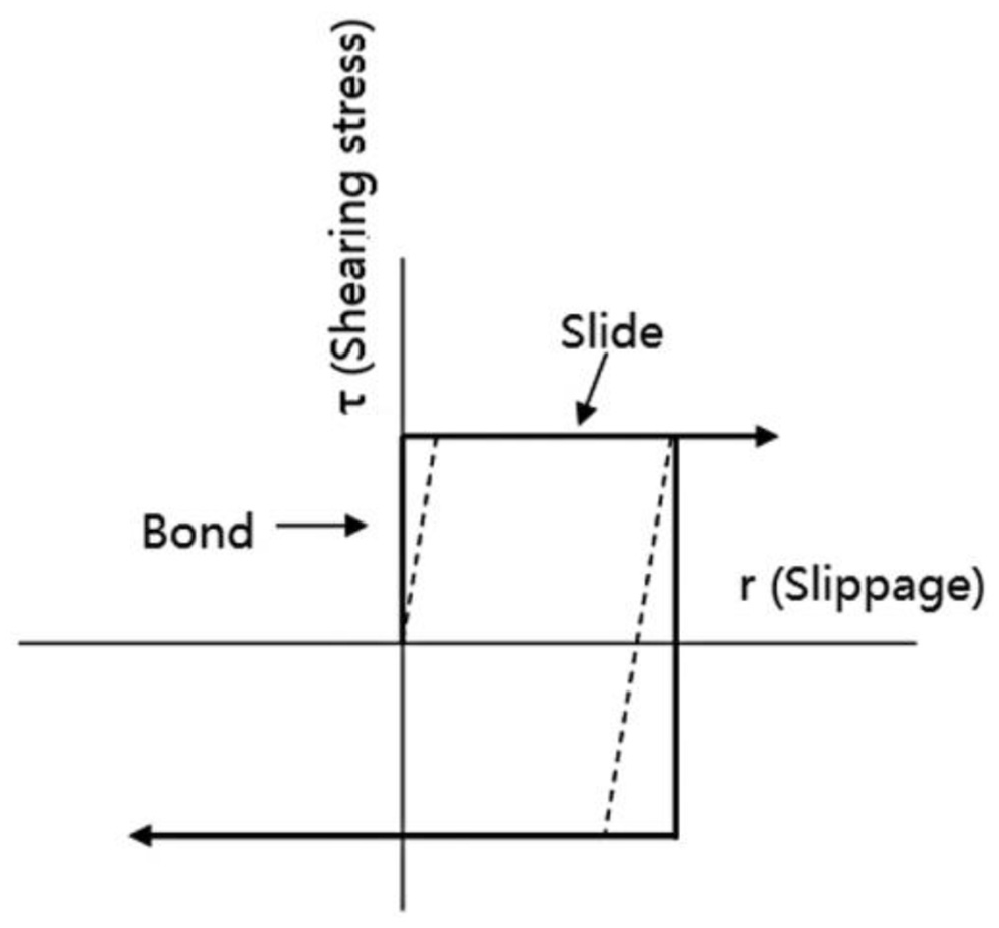
Friction behavior.
Model verification
In ABAQUS, the bolt preload can be simulated by applying ‘bolt load’. As shown in Figure 15, according to the Reference article Yu et al., 22 the installation torque T is the sum of the frictional resistance torque T1 and T2:


Indication of bolt installation torque.
Frictional resistance torque between head and washer T1 is:

Frictional resistance torque in spiral pair T2 is:

Substituting (3) and (4) into (2):

In equation (4)

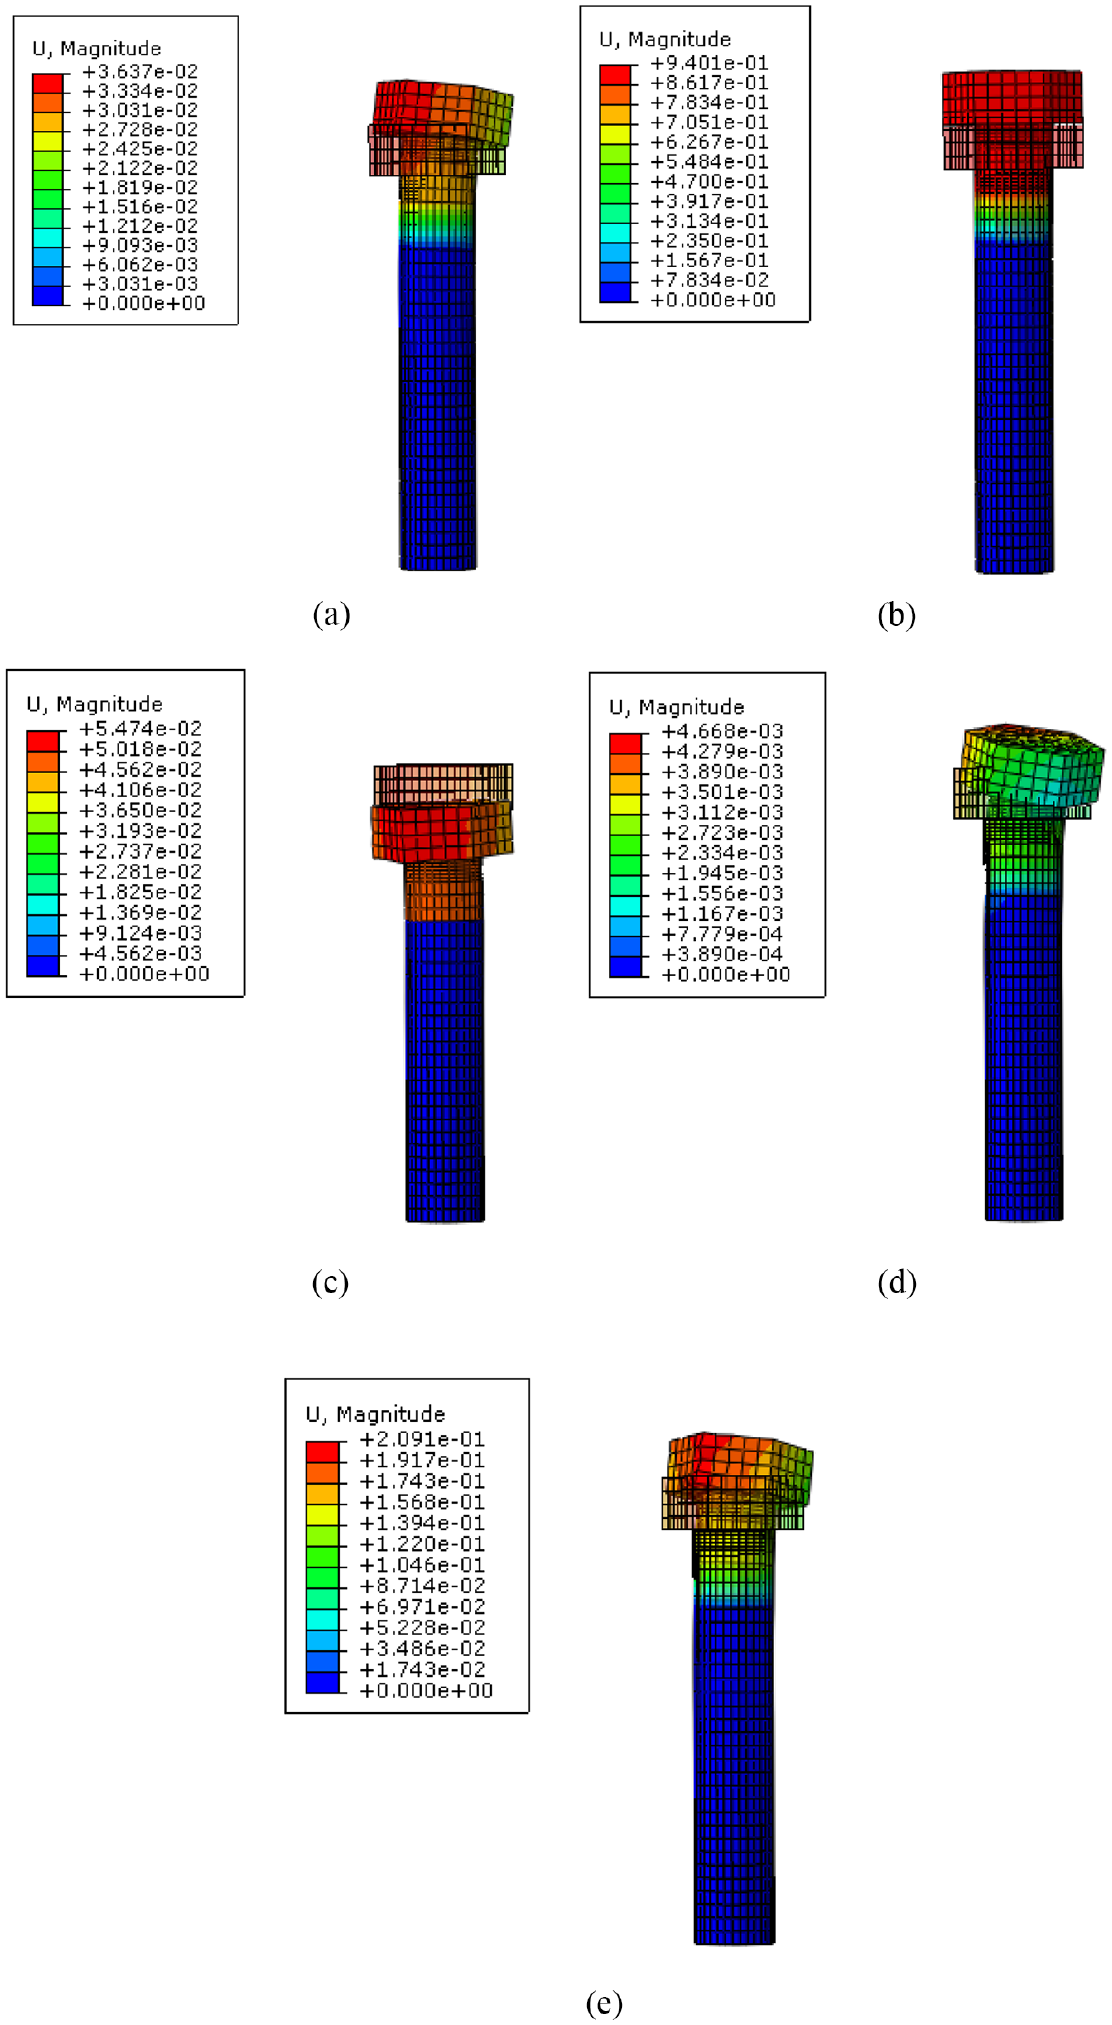
According to the on-site test data, the bolt installation torque is selected at 5 intervals: 100, 200, 300, 400, 500 kN-mm, the results from bolt stress calculation is shown in Figure 16.

Theoretical calculations: (a) Installation torque is 100 kN-mm, (b) Installation torque is 200 kN-mm (c) Installation torque is 300 kN-mm (d) Installation torque is 400 kN-mm, and (e) Installation torque is 500 kN-mm.
Comparing the data of theoretical data with the test data (Figure 17):

The relationship between installation torque and stress.
It can be seen from Figure 17 and Table 5 that the difference between the theoretical data and the test data does not exceed 5%, indicating that the model can accurately reflect the stress state of the bolt.
Difference comparison chart.

Spectrum response analysis
Fasteners are impacted by the vehicle load during service and may be destroyed by resonance under certain conditions. The acceleration frequency response of the fastener system under the action of sinusoidal excitation force can reflect the sensitive frequency band of the bolt. Combined with the mode shape, the damage mechanism of the bolt can be analyzed from the frequency domain perspective. In addition, the variation of bolt installation torque may lead to the change of its sensitive frequency. In this paper, the acceleration admittance is selected as the evaluation index of frequency response analysis.
Modal analysis
Mode refers to the inherent vibration characteristics of the structure. Each mode has a specific natural frequency, damping ratio and mode shape. The vibration mode is an inherent and integral characteristic of the structure. If the modal analysis method is used to clarify the characteristics of the main modes of the structure in a susceptible frequency range, actual vibration response of the structure can be estimated in this frequency band under various vibration sources. Therefore, modal analysis is an important method for structural dynamic design and equipment fault diagnosis. The ultimate goal of modal analysis is to identify the modal parameters of the system, and to provide a basis for verifying the vibration characteristics analysis results of the structural system, structural dynamic response analysis, vibration fault diagnosis, prediction and optimal design of structural dynamic characteristics.
The vibration equation of the structure is:

In the equation (5),
When the bolt is under free vibration, external load vector

Characteristic equation:

In equation,
In this paper, the natural frequency of the bolt within 2000 Hz is considered. Taking the installation load of 200 kN-mm as an example, the first five vibration modes and natural frequencies of bolts in service are shown in Figure 18:
Modal analysis: (a) First vibration mode (73.623 Hz), (b) Second vibration mode (417.47 Hz), (c) Third vibration mode (1086.2 Hz), (d) Forth vibration mode (1254.8 Hz), and (e) Fifth vibration mode (1414.9 Hz).
In the Figure 18, the light grid part represents the original state of the bolt, and the dark grid part represents the variable vibration mode of the bolt. According to the modal analysis, the bolt has five modes in the range of 0–2000 Hz. Its natural frequencies are 73.623 Hz, 417.47 Hz, 1086.2 Hz, 1254.8 Hz, and 1414.9 Hz respectively. Because the threaded part is fixed in the bolt hole, the deformation of the bolt is mainly concentrated in the bolt head and bolt shank part above the thread level. When the bolt vibrates, according to the first, second, fourth and fifth mode vibration modes, it can be seen that the force in the joint area of the bolt head and the bolt shank is complex, and vertical tension and bending deformation will occur in varying degrees. The third mode vibration mode bolt is mainly in vertical compression state.
Sweep frequency analysis
Admittance can reflect the sensitivity of the system under the excitation. The magnitude of admittance value can indicate the severity of the track structure vibration. When the admittance value is high, the vibration level is likely to increase. This may result in the track structure damage. Admittance is mainly divided into displacement admittance and acceleration admittance. However, because acceleration is more sensitive to the excitation, acceleration admittance is selected for analysis in the present research. By applying sinusoidal loads of different frequencies for frequency sweep analysis, the steady-state response of the structure at different frequencies can be obtained.
The expression of the system transfer equation is:

In equation (8),
In ABAQUS the unit sine excitation load perpendicular to the rail head is applied on the rail surface, with the load frequency of 10–2000 Hz. The acceleration admittance is taken as the evaluation index, and the joint of head and shank is selected as the research position. Considering that the installation torque is generally not more than 400 kN-mm in the actual assembly process of bolt, therefore the working conditions of installation torque is respectively 100kN-mm, 150 kN-mm, 200 kN-mm, 250 kN-mm, 300 kN-mm, 350 kN-mm, 400 kN-mm, observing the frequency response calculation results.
According to Figure 19, there are four obvious peaks in the spectrum, respectively at 73 Hz, 414–420 Hz, 1080–1100 Hz, and 1230–1270 Hz. It can be observed that, when the installation torque changes, the vibration sensitive frequency band of the bolt does not change much with the installation torque. This is because the bolt is fixed in the bolt hole. Increase of installation torque has limited effect on the sensitive frequency band of the bolt but the increase of installation torque could reduce the peak frequency amplitude which represents reduction of the bolt acceleration.
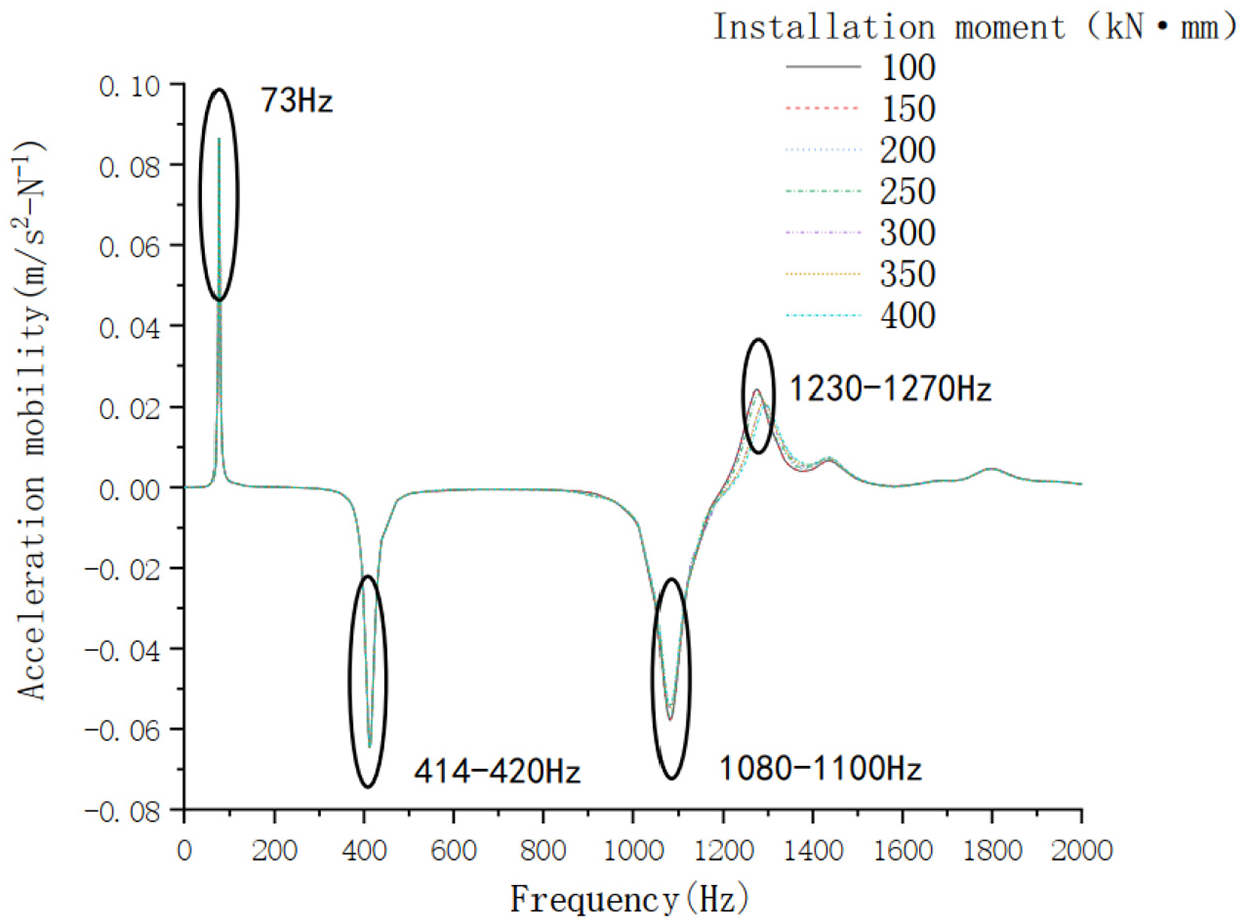
Acceleration spectrum of bolt.
From the measured main frequency of bolt acceleration (Figure 7), the test speed of the train is 120 km/h and the vibration frequency of the bolt is mainly 1200 Hz. This is very close to the two sensitive frequency bands of the bolts: 1050–1100 Hz and 1230–1270 Hz. The results of modal analysis show that in the sensitive frequency band, the joint between the bolt head and the bolt shank will produce large bending deformation and vertical tensile deformation, resulting in excessive stress in the region, which may easily lead to bolt fracture.
According to the relationship between frequency γ and vehicle speed
Stress analysis
Considering that the actual installation torque of the bolt would not exceed 400 kN-mm, the installation torque is 100 kN-mm, 150 kN-mm, 200 kN-mm, 250 kN-mm, 300 kN-mm, 350 kN-mm, 400 kN-mm working condition, calculate the force cloud diagram of the bolt under different working conditions, as shown in Figure 20.

Stress Nephogram of bolt: (a) Installation torque is 100 kN-mm, (b) Installation torque is 150 kN-mm, (c) Installation torque is 200 kN-mm, (d) Installation torque is 250 kN-mm, (e) Installation torque is 300 kN-mm, (f) Installation torque is 350 kN-mm, and (g) Installation torque is 400 kN-mm.
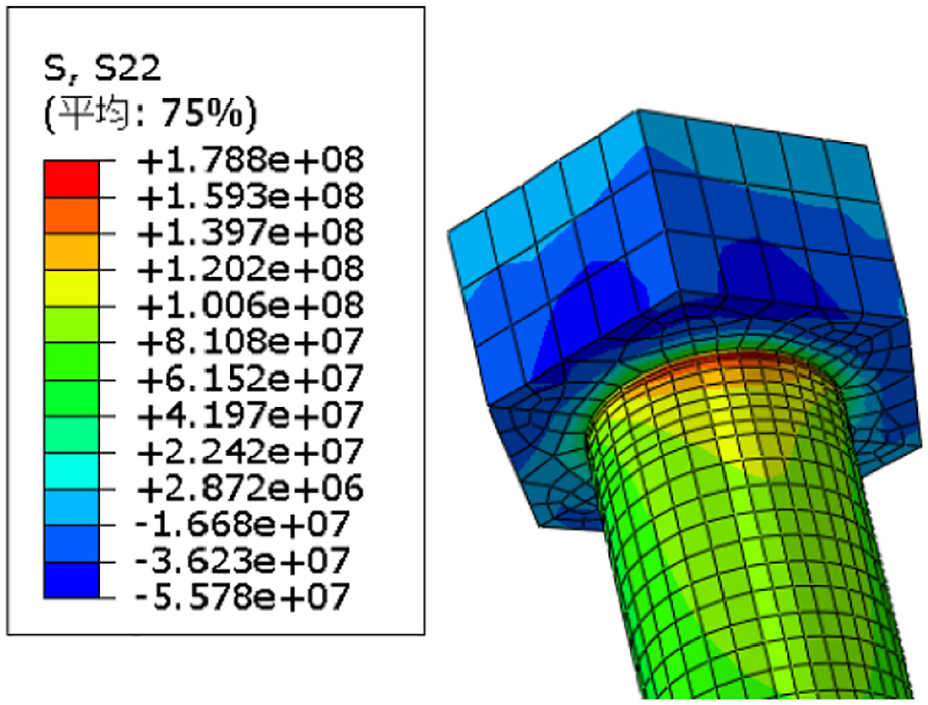
It can be seen from the Figure 20 that stress concentration occurs at the junction of the bolt head and the bolt shank, which is the critical area of damage. As the installation torque increases, the stress value of the area also increases. In particular, when the installation torque reaches 300 kN-mm, the value of Von Mises stress at the junction of the bolt head and shank is 240 MPa, which is higher than the yield limit of the material. In strain hardening stage, the strength of material has been increased. Considering the difficulty of repair after the bolt fractures, the maximum stress of the bolt usually cannot exceed the yield strength in design. 23 Therefore, according to calculation result, it is recommended that the installation torque should be less than 300 kN-mm. Along with the compulsion of bolt installation torque to be more than 100 N-mm in DT III fastener design, the bolt mounting torque in DT III bolt should be maintained between 100 and 300 kN-mm.
In order to further reveal the deformation of the bolt, an installation torque of 200 kN-mm on the bolt was taken for analysis for calculation of stress and deformation of the bolt in the normal working state. The results are shown in Figures 21–24.
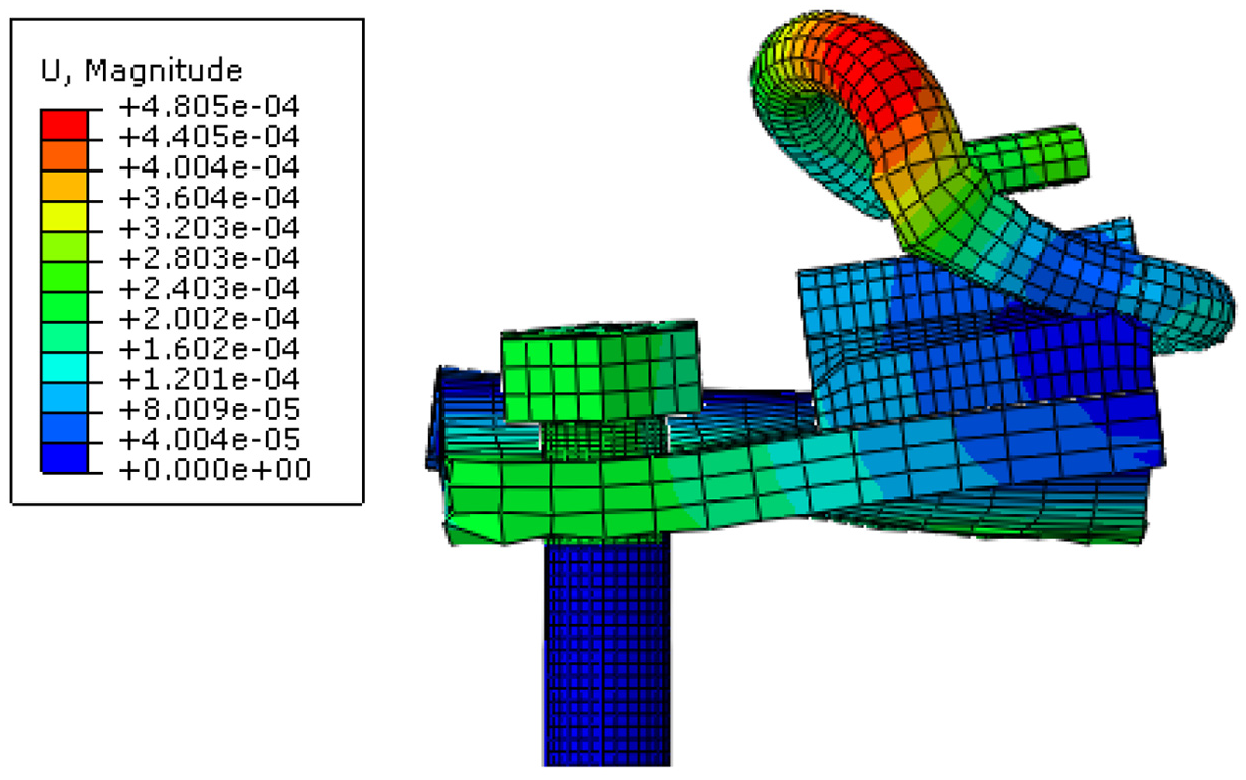
Bolt service diagram (magnification factor 80).
Bolt deformation diagram (magnification factor 80).
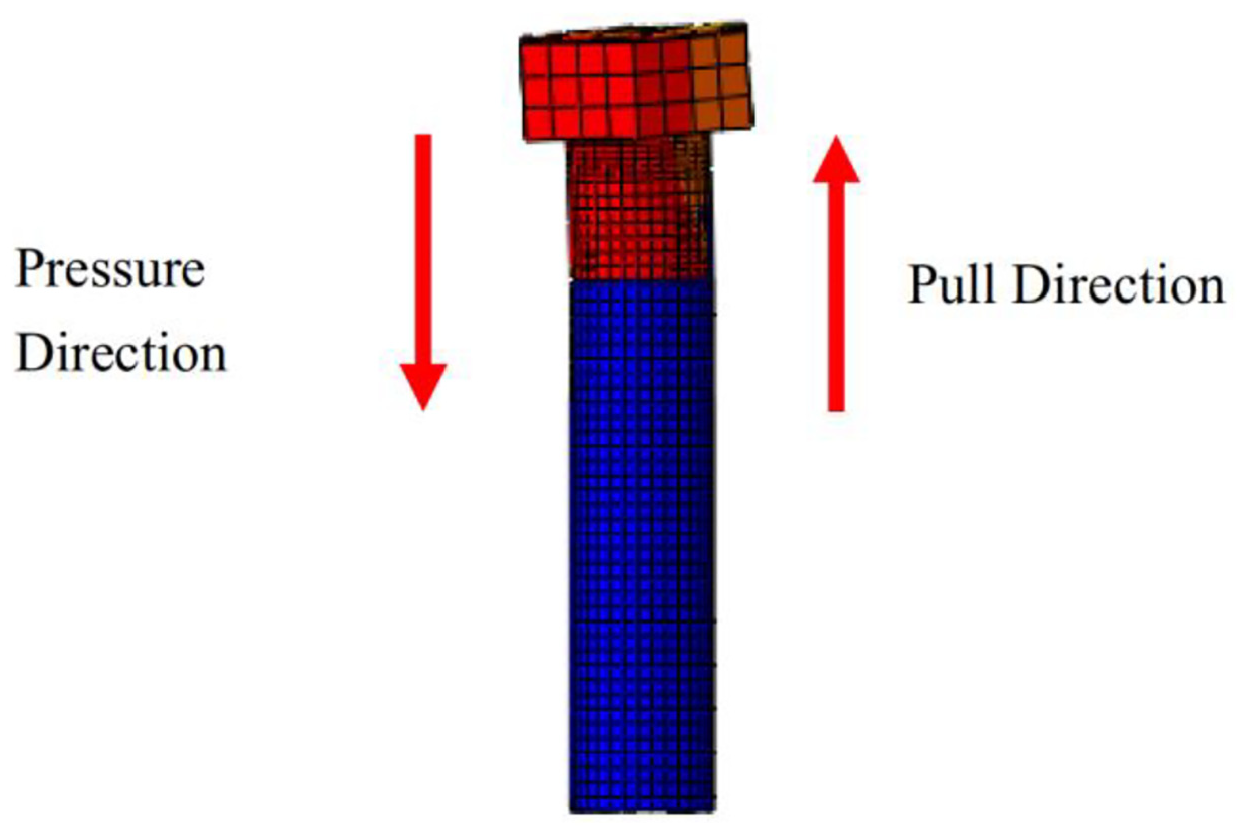
The side near the clip is pulled.

The side away from the clip is pressed.
From the previous discussions, when the bolt is tightened, the washer presses the side of the head under the action of the elastic clip. Hence the head is subjected to a large compressive stress. Since the bolt suffers an eccentric load (Figure 21), the force at the head and the shank junction is characterized by tensile stress on the side close to the clip and compressive stress on the side away from the clip. Under the train load, the bolt, due to repeated bending, may break. This will lead to the separation of bolt head and bolt shank. From the field studies, it could be observed that the results are consistent with the bolt fracture characteristics as observed on site (Figure 25).

Bolt crack diagram.
Fatigue analysis
The mechanical property and fatigue life of material can be affected by many factors, such as chemical composition, internal structure, exterior loads and service environment. In this study, only considering the effect of the train load and installation torque.
The effects of stress amplitude

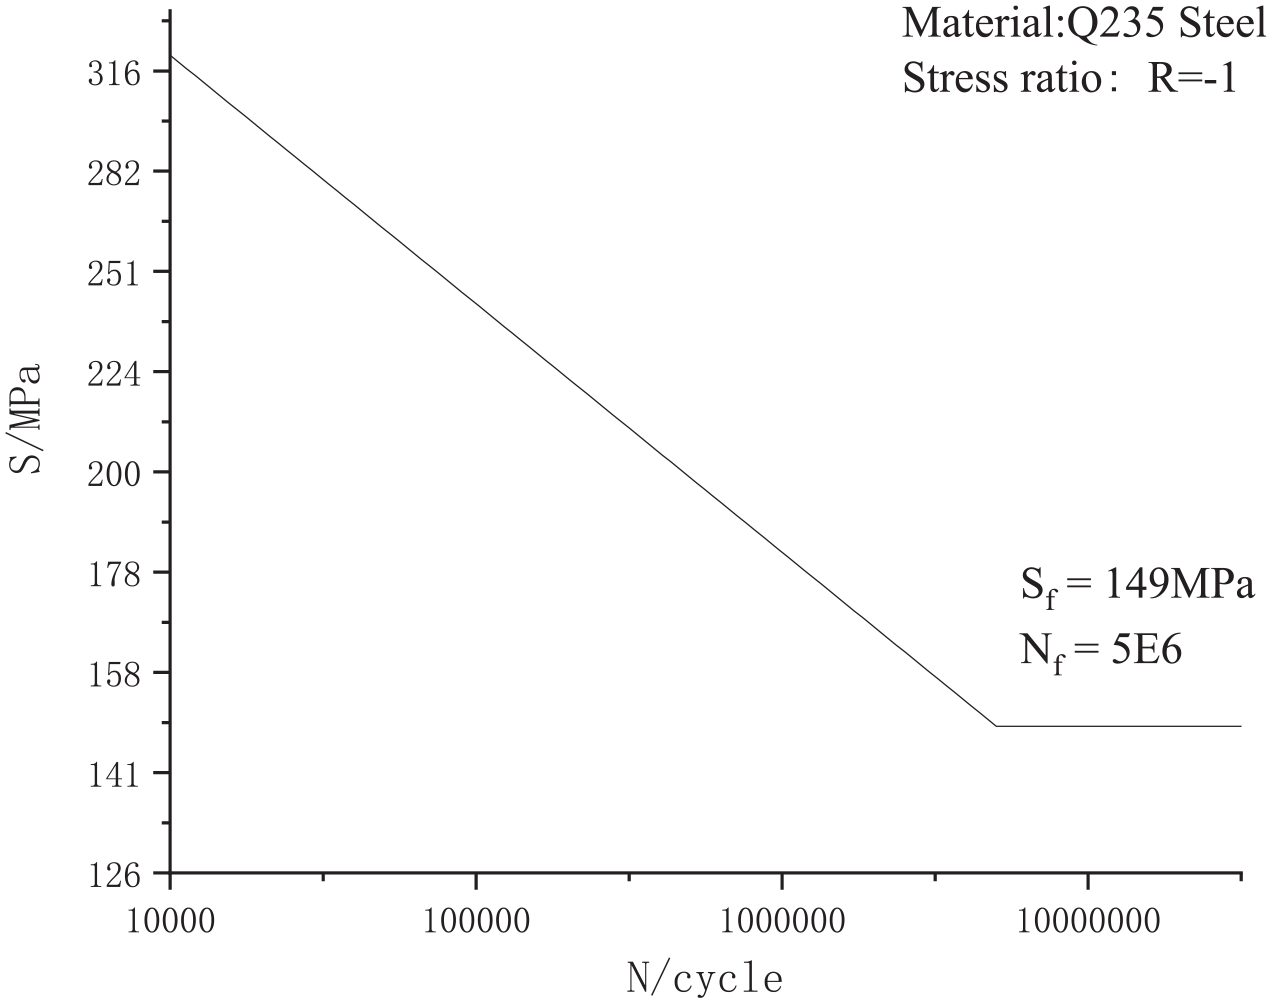
S-N Curve of Q235 Steel.
But in the design of parts and connections, the external load is often non-symmetrical and non-cyclic. In other words, the mean stress may not necessarily be equal to zero. In general, under the condition of the similar stress amplitudes, the increase in mean stress of the part under pulling will reduce the fatigue life of the part while in the part under compression, the mean stress plays a beneficial role on the fatigue strength and life. Therefore, the mean stress
Fatigue limit stress models.

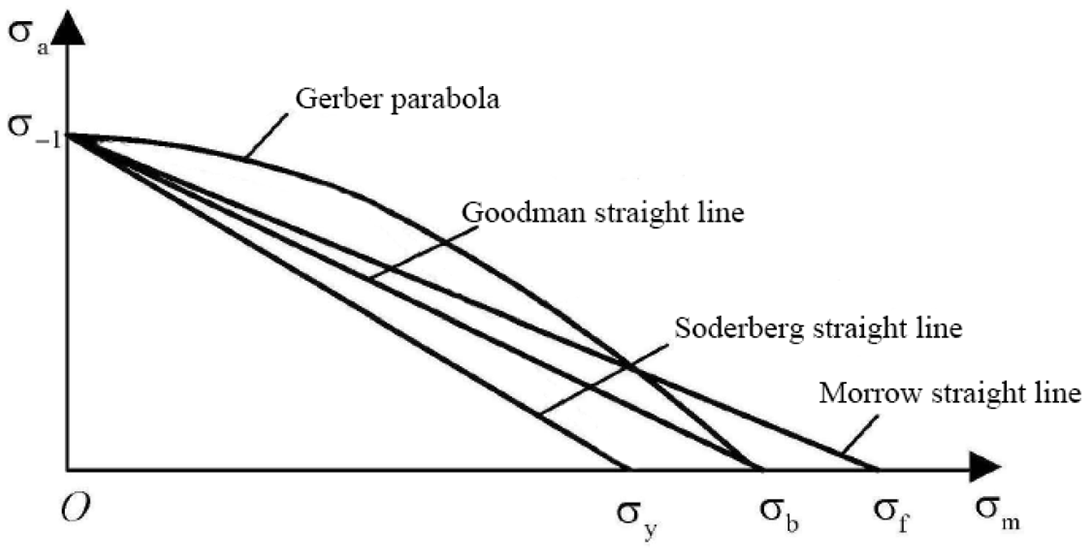
Fatigue limit stress models.
In Table 6,
As shown in the Table 6 and Figure 27, although the expressions of Goodman model and Morrow model are simple, the results are relatively conservative; the results of Gerber model are close to the experiment data, but it has a complicated expression. The results of Soderberg model are also conservative, however they may introduce larger the deviation. Considering the accuracy of results and convenience of the calculation, the default algorithm in FE-SAFE, Morrow model, is selected to be modified.
In FE-SAFE, the Brown Miller- Morrow algorithm has good accuracy in calculating fatigue in ductile metals. Hence, this algorithm is selected for fatigue calculation in the present study.
ABAQUS is used for pre-processing and post-processing visualization. The ODB files of the transient condition analysis under varying operating conditions are the inputs to FE-SAFE for fatigue life calculation. The prediction results are computed in ABAQUS for visual analysis to display the fatigue life distribution.
According to the working principle of fastener, its fatigue load is mainly caused by train load. Hence analysis of bolt fatigue because of rail displacement is done in the present research. According to the on-site data (Table 1), selecting the most critical condition, the vertical displacement of the rail is −1.5 mm and 0.5 mm respectively. The displacement application method is shown in Figure 28.

Diagram of load applied.
Considering the conditions of field tests: the train is organized into 8 cars and the speed is 120 km/h. In the actual assembly process of the bolt, the installation torque generally does not exceed 400 kN-mm, so the installation torque are selected : 100kN-mm, 150 kN-mm, 200 kN-mm, 250 kN-mm, 300 kN-mm, 350 kN-mm, 400 kN-mm. Analysis of the fatigue performance of the bolt, and the computation results are shown in Figure 29.

Fatigue analysis results: (a) Installation torque is 100 kN-mm, (b) Installation torque is 150 kN-mm, (c) Installation torque is 200 kN-mm, (d) Installation torque is 250 kN-mm, (e) Installation torque is 300 kN-mm, (f) Installation torque is 350 kN-mm, and (g) Installation torque is 400 kN-mm.
As we can see, under various working conditions, the bolt is most susceptible to fatigue at the junction of head and shank. It is the critical position and conforms to the actual situation on the yield. As the installation torque increases, the fatigue life decreases exponentially (Figure 30) and the fatigue risk range (red area) in junction of the bolt head and shank also increases. According to GB/T 13682-92, 26 the fatigue life of steel thread fasteners is required as 5×10⁶.

The relationship between installation torque and fatigue life.
If the interval between successive train departures is about 3min, and the daily operational hours are about 17.5 h, the fatigue life specified in GB/T 13682-92 is supposed to be 5 × 10⁶ / (12 × 17.5 × 60 × 30/3) = 39.7 years. Similarly, the fatigue life of the fastener system under varying installation torques could be computed. As shown in Table 7, it can be seen that an increase of installation torque will reduce the fatigue life of fastener exponentially. In particular, when the installation torque is 300 kN-mm and 350 kN-mm, the corresponding fatigue life is 170.6 years and 28.4 years respectively. Considering some safety factor, the installation torque of the bolt should not exceed 300 kN-mm during installation.
Fastener theoretical normal fatigue life.

Conclusion
(1) The present study analyzes the stress characteristics of bolts based on on-site tests. Through the static tests, the relationship between the torque and the stress of the T-bolt was computed as:

This indicates that as the torque increases, the bolt stress also increases and is almost linear in nature. The dynamic test measured vibration acceleration of the bolt when the train traversed. Using FFT, the vibration frequency of bolt was found to be 1200 Hz.
(2) Highly simplified traditional fastener model does not reflect the true characteristics of bolt stress and contact conditions of fasteners. Hence the present paper considers interaction between various parts of fastener system through non-linear contact theory for thorough analysis. A complete finite element model of DTIII fastener was developed and the model was verified using on-site data. The refined finite element model of DTIII fastener can accurately reflect the contact stress and deformation of components such as bolts.
(3) The main vibration frequency of the bolt is close to the two sensitive frequency bands of 1050–1100 Hz and 1230–1270 Hz. When the train speed varies slightly, the bolt will resonate because of the vibrations induced by moving trains. As per the modal analysis, it could be observed that, at head and shank junction, large bending deformation and vertical displacement occurs. This causes excessive stress at the junction which could easily lead to bolt fracture.
(4) When Type DT III fastener bolts are installed, if the torque reaches 300 kN-mm, the stress developed in the bolts exceeds the yield limit of bolt material. When the fastener is in service, the junction between head and shank is the critical area for fastener failure. The bolt near the clip is subject to tensile stress and the side far from the clip is subject to compressive stress. Under repeated train loads, the bolt will fracture. Fault feature is consistent with field observations.
(5) Select rail vertical displacements of −1.5 mm and 0.5 mm for fatigue analysis. When the installation torque is changed in the range of 100–400 kN-mm, increase in installation torque will vastly reduce the fatigue life of bolt. Based on GB/T 13682-92, the installation torque of the bolt should not exceed 300 kN-mm during installation.
Therefore, when the train is operating in this range, in order to avoid resonance caused by the vibration frequency and the bolt service sensitive frequency, the speed should be controlled in the range of 115–120 km/h.
Also, considering the stress features and fatigue life of the bolt during service, it is recommended that the installation torque of the bolt should be maintained between 100 kN-mm and 300 kN-mm during installation.
Footnotes
Declaration of conflicting interests
The author(s) declared no potential conflicts of interest with respect to the research, authorship, and/or publication of this article.
Funding
The author(s) disclosed receipt of the following financial support for the research, authorship, and/or publication of this article: This work was financially supported by Shenshuo Science and Technology Development Project ([2017] No.7) and Fundamental Research Funds of China Academy of Railway Sciences (Grant No. 2017YJ166)