
Abstract
The beam pumping unit is widely used in oil fields as an oil extraction machine. However, due to its structural characteristics and the changing conditions of underground reservoirs, there are many factors affecting the efficiency of the beam pumping unit. How to quickly and accurately reflect the inefficient factors, and whether the efficiency of the pumping unit is reasonable, it is an urgent problem to be solved. In this article, we propose a pumping unit efficiency evaluation model consisting of the scoring model and the predictive model. The scoring model reflects the inefficient factors, and the predictive model judges whether the efficiency of the pumping unit is reasonable. Finally, the actual production data of the oilfield were used to verify the effectiveness of the method.
Keywords
Introduction
Oil and gas are one of the main energy resources that are difficultly replaced in the modern society. They are called black gold to economic and are the main materials for the petrochemical industry. With the development of economy, the target of energy-saving, emission-reduction, green and low-carbon production are our goal. 1
Oilfields are great customers for power consumption, and had the responsibility to design the beam pumping units in order to improve their performance. The total consumed power of the Daqing Oilfield is 9900 million kW h, where the artificial lift occupied one-third. The “big motor drive small rodpumping” always existed in the past, which was constantly denounced. 2
Electric motors are operated with cyclical loading on Nodding Donkey oil pump. This varying load impacts motor efficiency, energy consumption which is the largest part cost for the operation of oil-well pumping units. And high loss of energy is a common and urgent problem in all oil fields. 3
Studying efficiency of beam pumping unit, the people completed the following work.
In order to keep initiating and operating the prime motor smoothly and safely, its actual rated power is high much more than the needed. With the intention of improving the efficiency of the prime motor and decreasing the cost of rod pumping, a set of rated power calculated methods and a set of matching templates was built up under the regarding conditions such as the changing rule of the system load, the heating of the prime motor, and the overload torque in the initiate processing. 4
Calculating the efficiency of the beam pumping unit by analyzing the pattern of motion of the sucker rod and using the dynamometer card. 5
In petroleum exploitation, the beam pumping unit is used widely. But the phenomenon “the motor power is greater than the power required by the pumping unit” exists, which is caused by the reasons to satisfy the starting requirements of pumping unit and ensure sufficient overload capacity. Therefore, eventually it enhances the efficiency of electric motor of the unit, and causes the pumping unit to often work in light load. People have developed many kinds of energy-saving beam pumping unit at home and abroad. What’s more, the technology of power factor correction, soft start, adjustable speed motor, thyristor voltage regulator has appeared in the sphere of saving energy control beam pumping unit studies. 6
Analyzing the impact of balance on beam pumping unit of efficiency. At the same time, a self-balancing beam pumping unit was designed. 7
The predecessors studied the effects of motors, balance and sucker rod power on the efficiency of the pumping unit. Single factor analysis of pumping unit efficiency has certain limitations, ignoring the direct or indirect interaction between various factors. What’s more, the factors that affect the degree of the pumping unit efficiency cannot be directly reflected. Therefore, the principal component method in the statistical category is used, the principal component analysis is carried out on many factors, the primary and secondary relations of each factor are scientifically determined, and the deviation caused by subjective randomness is avoided.
In this article, the scoring model and the prediction model of pumping unit efficiency are established by principal component analysis of measured parameters. Model coefficients are trained and revised to ensure the accuracy of the model. The scoring model is used to judge inefficient factors, and the predictive model is used to predict system efficiency. The scoring model and the predictive model constitute the efficient evaluation model.
Principal component analysis is a dimensionality reducing multivariate statistical method. By means of principal component analysis, the original multiple related variables can be transformed into several principal components, usually expressed as a linear combination of the original related variables. The information principal components contain does not overlap and is unrelated to each other, and most of the information of the original variable is reflected. In general, when the question involves many variables, and the information contained in the variables overlaps, that is, there is a clear correlation between the variables, then principal component analysis can be considered, which can more easily capture the main contradiction of things and simplify the problem.8,9
Parameter selection and data acquisition that affect the efficiency of the beam pumping unit
The choice of parameters and the acquisition of data are related to the accuracy of the evaluation model.
Parameter selection
The calculation formula of the beam pumping unit efficiency can be calculated by


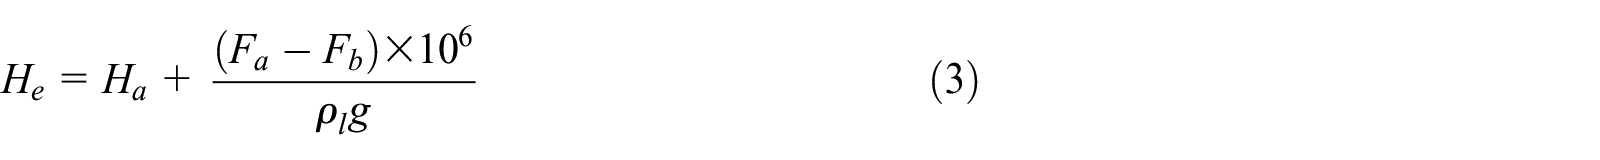

where P1 is the motor input power, P2 is the output power, Q is the daily production of oil well, He is the effective lift,
The above formula can directly derive the efficiency of the pumping unit. However, there is no explanation for the indirect factors affecting the efficiency of the beam pumping unit. In the previous studies, the pumping unit was divided into a ground part and a downhole part, and the ground part was composed of a motor part and a transmission part; the downhole part was mainly a reservoir characteristic. Zhang et al. 10 analyzes the influencing factors of pump efficiency, and introduces factors that are closely related to reservoir characteristics, such as pumping depth, pump diameter, sinking degree, daily liquid volume, crude oil density, and so on. Feng et al. 4 proposes the matching of the polished rod power of the pumping unit with the rated power of the motor, which is related to active power, reactive power, apparent power, power factor, and current. The predecessors mainly studied the efficiency of the pumping unit from the ground part or the downhole part, but the factors of the ground part and the downhole part are mutually influential. Therefore, it is necessary to comprehensively consider the efficiency of the pumping unit, summarized as follows. 11
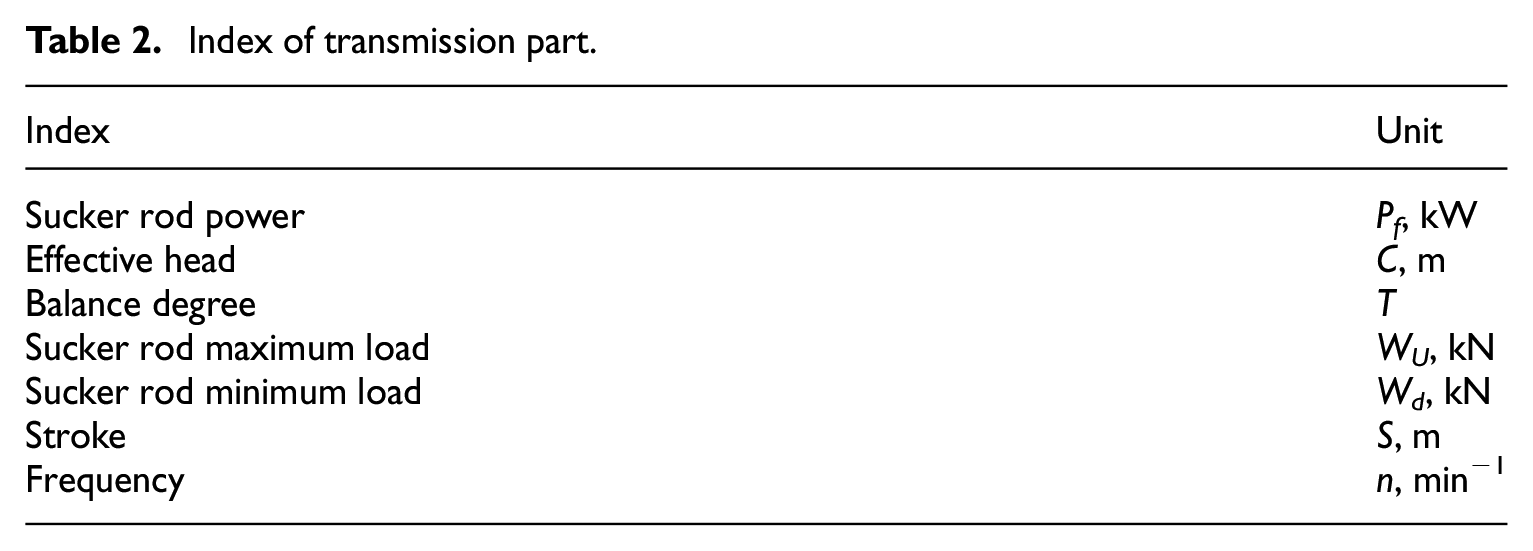
The factors affecting the efficiency of the beam pumping unit are mainly divided into three categories, the first type is the power source part, which is mainly the motor. The second type is the transmission part, which is mainly the pumping unit and the sucker rod. The third type is working part, which is mainly reservoir characteristics, including parameters shown in Tables 1–3.
Index of power source part.

Index of transmission part.
Index of working part.

Through the above summary, the factors affecting the efficiency of the beam pumping unit are 22 indicators.
Selection of data
These data were selected from the production data of 45 oil wells by the 22 kW motor unit of the 10 type pumping unit in the Xinjiang Oilfield of PetroChina. See Table 4 for details.
Statistical value of 22 indicators in 45 oil wells.
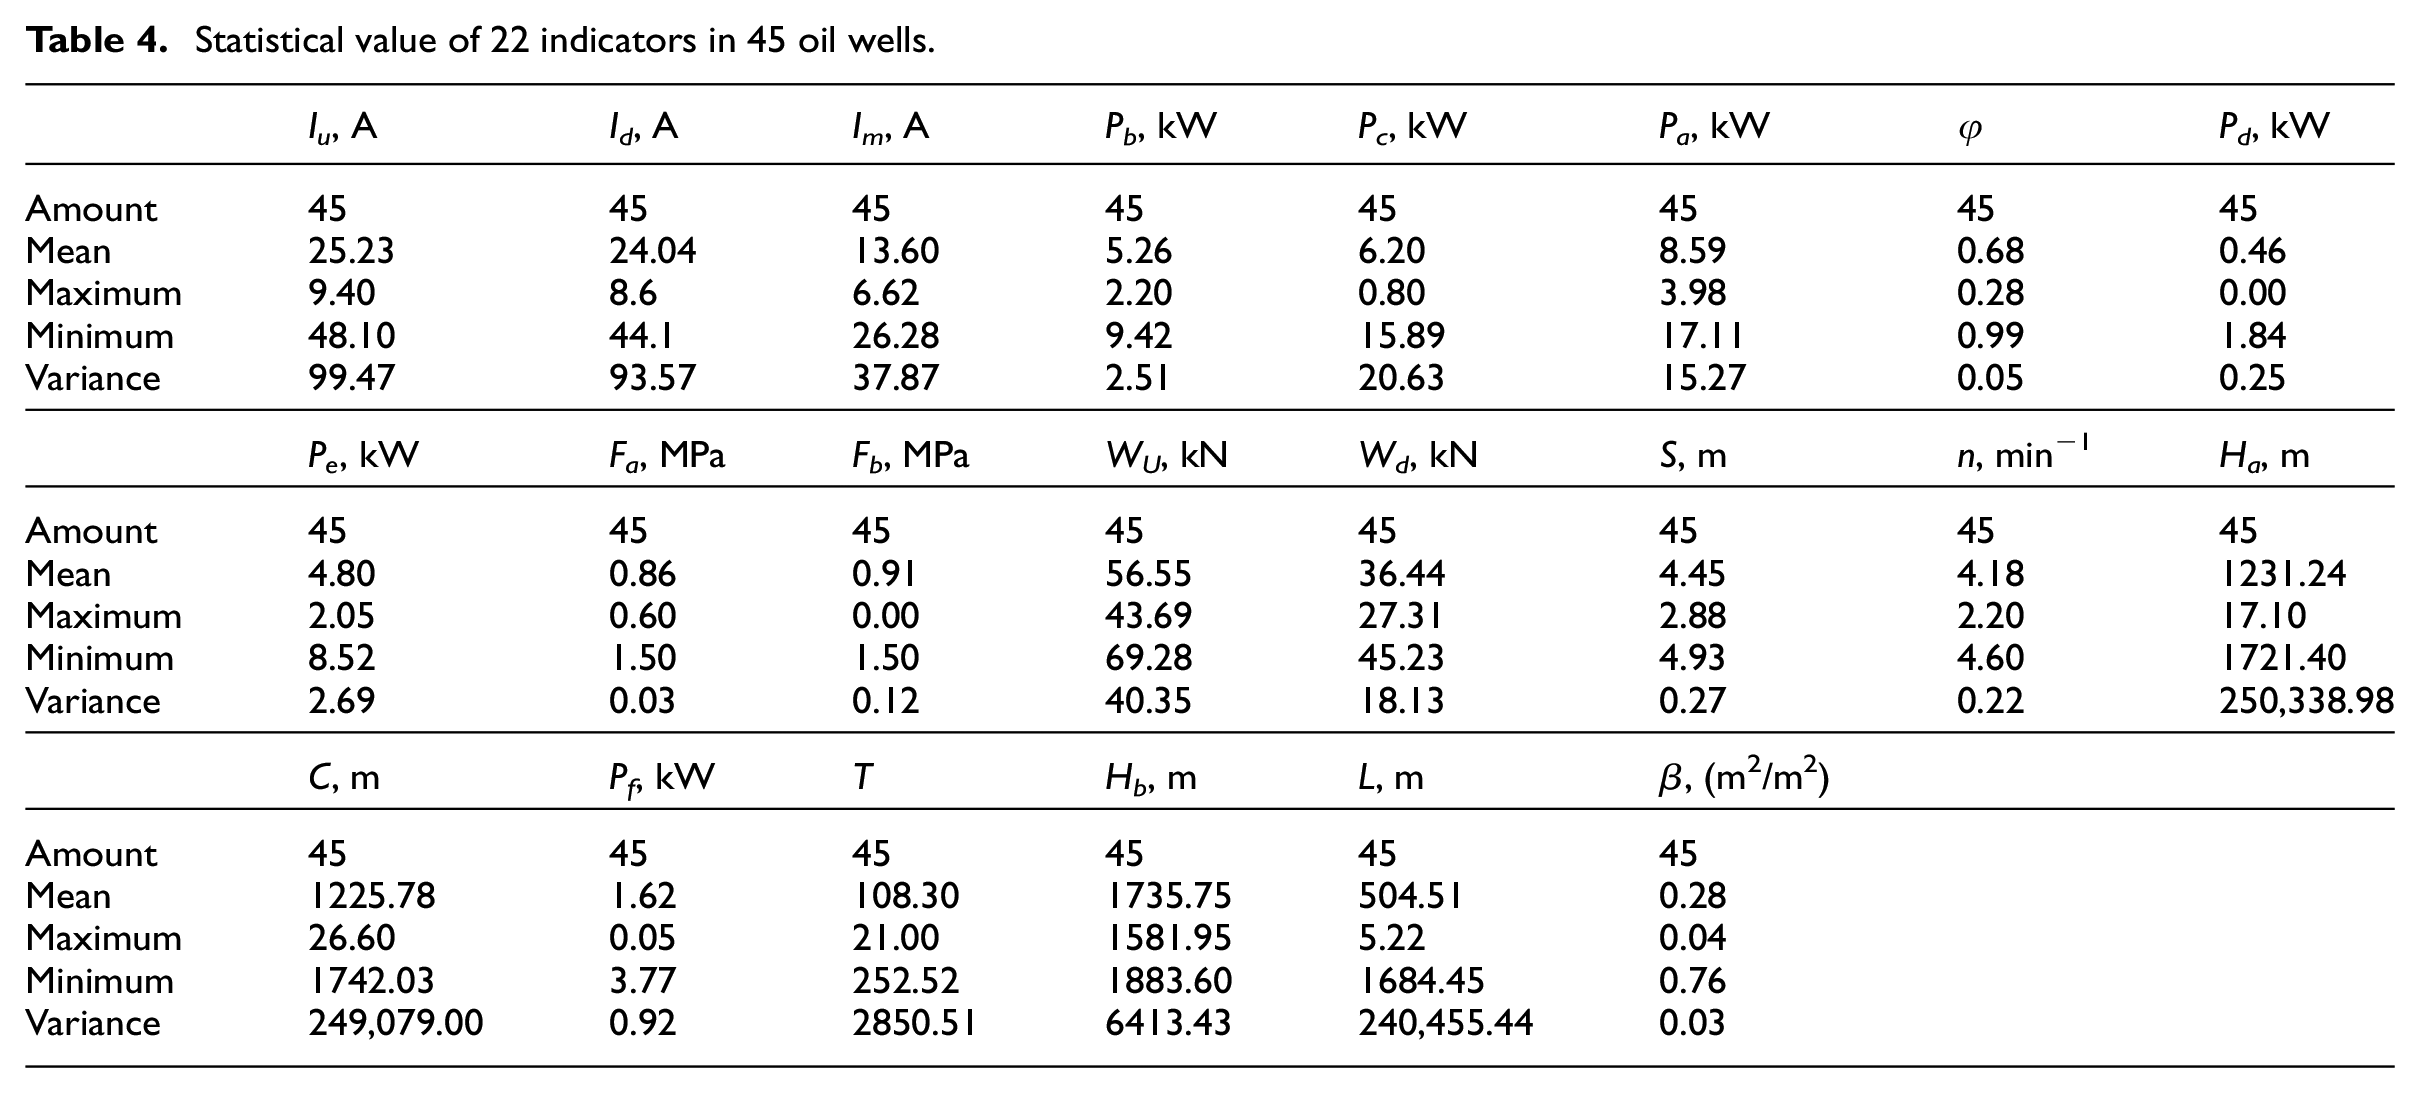
It can be seen from Table 4 that the original data has large differences and many influencing factors, and it is difficult to conduct comprehensive and systematic analysis by conventional methods. Therefore, the principal component analysis method is used to establish the evaluation model to achieve more objective and accurate analysis.
Logical block diagram of the evaluation model
In Figure 1, starting from the sample parameters, the principal component analysis is performed, and the comprehensive evaluation function equation and the regression equation can be obtained, respectively. Through the data training of the coefficients of the comprehensive evaluation function equation and the regression equation, the scoring model and the predictive model which can objectively and accurately reflect the efficiency of the target pumping unit pumping unit are obtained. The two models together constitute the efficiency evaluation model of the beam pumping unit.
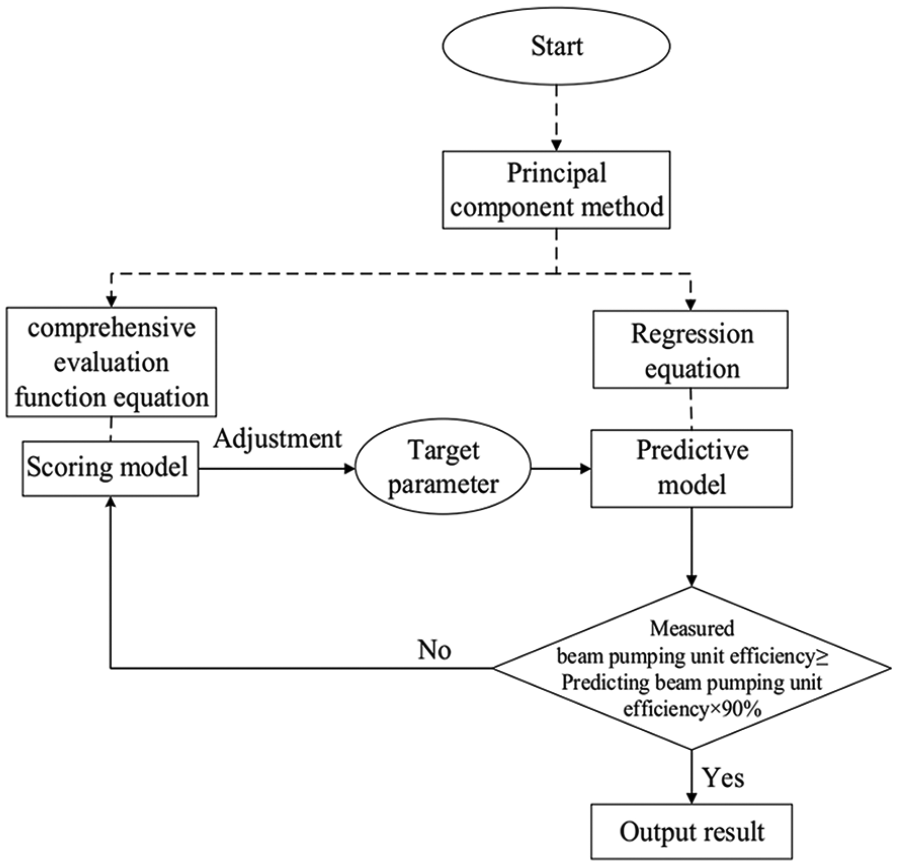
Logical block diagram of the evaluation model.
Substituting the target parameters into the prediction model, the efficiency of the predicted beam pumping unit is obtained, and the efficiency of the actual beam pumping unit and the efficiency of the predicted beam pumping unit are judged. If the actual beam pumping unit efficiency is greater than or equal to predicting the efficiency of the beam pumping unit by 90%, the output is that the actual beam pumping unit efficiency is in line with expectations. If the actual beam pumping unit efficiency is less than the forecasting efficiency of the beam pumping unit by 90%, the target parameters are substituted into the scoring model to find the inefficient factors, and then the adjusted target parameters are substituted into the forecasting model until the actual beam pumping unit efficiency is greater than or equal to the forecasting efficiency, output result.
Establishing the scoring model based on principal component analysis
Solving the principal component from the correlation matrix
In Table 4, n = 45 oil wells (samples), p = 22 parameters (variables), so that a total of n × p = 45 × 22 data, the original data matrix are

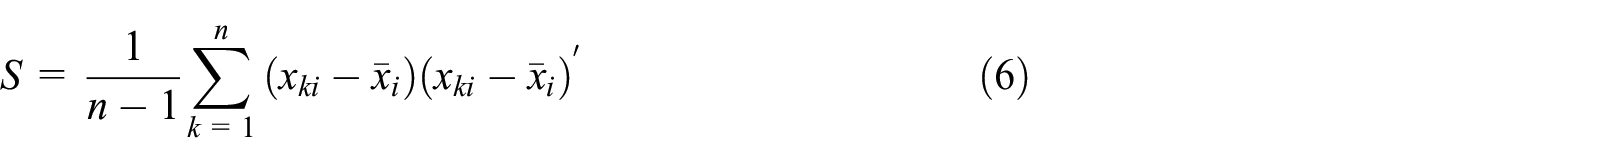


where S is the sample covariance matrix, as an unbiased estimate of the overall covariance matrix, and R is the sample correlation matrix, which is the estimate of the overall correlation matrix. According to the definition of the overall principal component, the covariance of the principal component Y is

where Λ is the diagonal array

For Y1, there is a maximum variance, Y2 has a large variance, …, and the covariance is
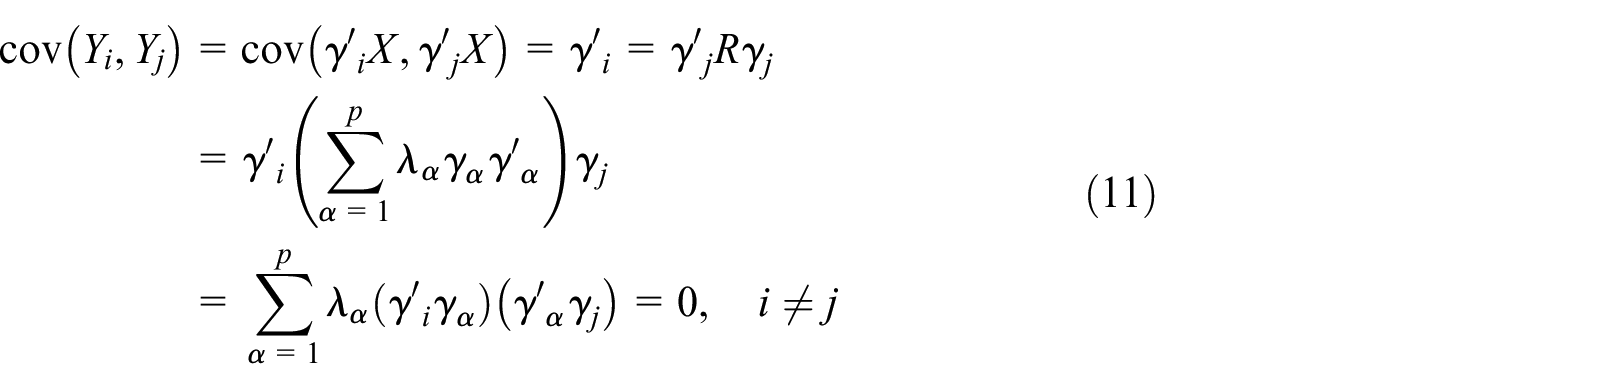
It can be seen that the new comprehensive variables (principal components)
The sum
The calculation process of the principal component is implemented in SPSS software, and results are shown in Table 5.
Index correlation coefficient matrix.

The correspondence between the correlation coefficient and the correlation degree is as follows.
Corresponding Table 5 correlation coefficient matrix and Table 6 correlation coefficient can be obtained according to the correlation degree.
Corresponds to the degree of correlation.

There is a strong correlation between the upstroke maximum current (Iu), downstroke maximum current (Id), motor input active power (Pb), motor input reactive power (Pc), and motor input apparent power (Pa), and they reflect the efficiency of the motor output.
There is a strong correlation between the sucker rod maximum load (WU), sucker rod minimum load (Wd), liquid depth (Ha), effective head (C), and pump setting depth (Hb), and they reflect the output power of sucker rod.
There is a strong correlation between the liquid depth (Ha) and effective head (C), and they reflect the rise in crude oil.
As shown in Table 7, the top seven principal components whose eigenvalues are greater than 1, the cumulative contribution rate reaches 86.013%. The first seven principal components represent most of the information for the 22 indicators. Therefore, 22 indicators affecting the efficiency of the pumping unit can be integrated into seven principal components.
Eigenvalue, variance contribution rat, and cumulative.

Based on the selected seven comprehensive indicators, the initial factor load can be calculated. The principal component load matrix needs to divide the data in the initial factor load matrix by the eigenvalue corresponding to the principal component and then find the square root, and obtain the principal component load value corresponding to each index of the seven principal components. The principal component loads are shown in Table 8.9,16
Principal component load.

Establishment of a scoring model
According to the main component load of Table 8, the analysis of the seven principal components is as follows (Table 9 to Table 15).
First principal component analysis.

Second principal component analysis.

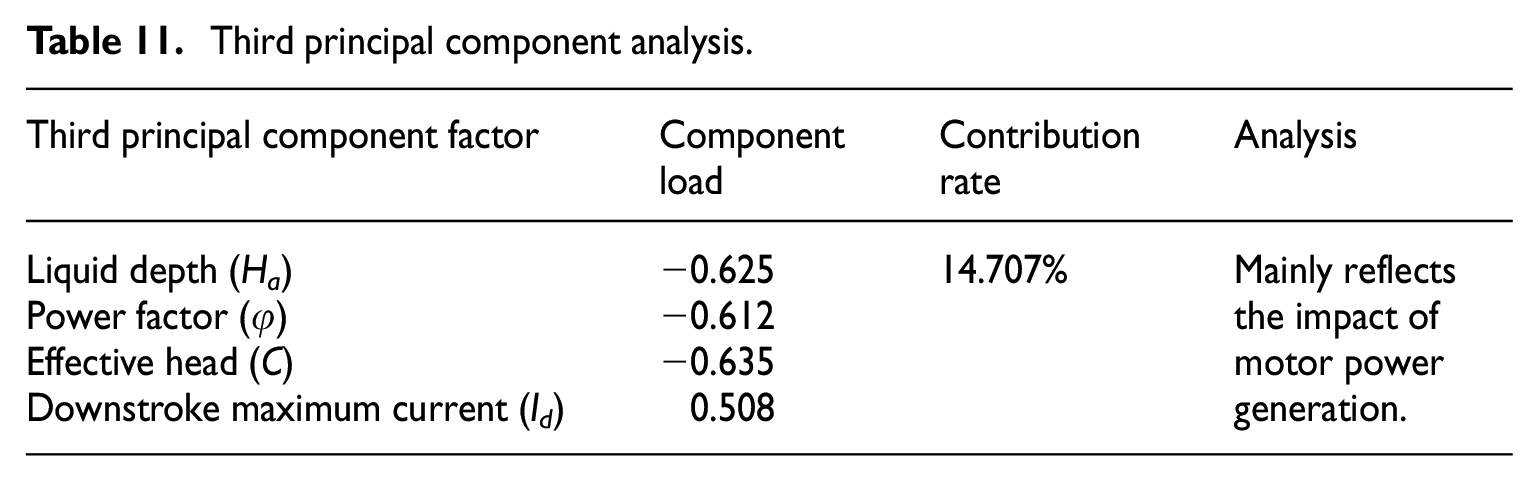
Third principal component analysis.
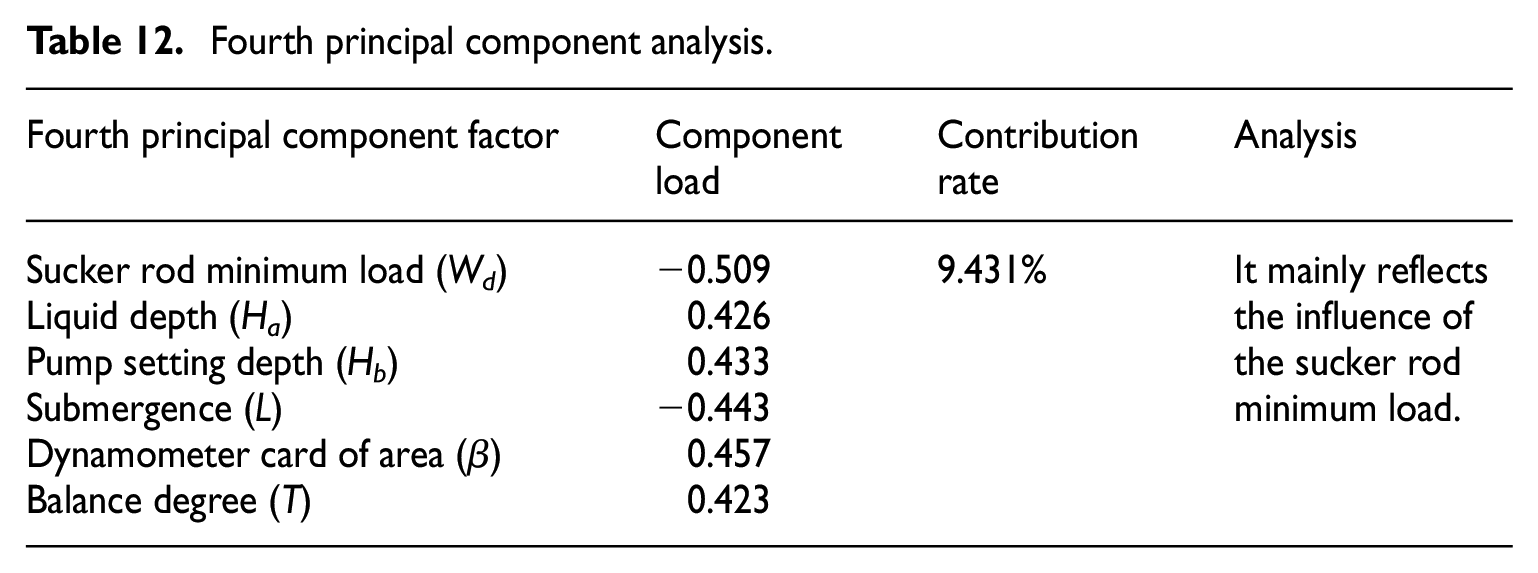
Fourth principal component analysis.
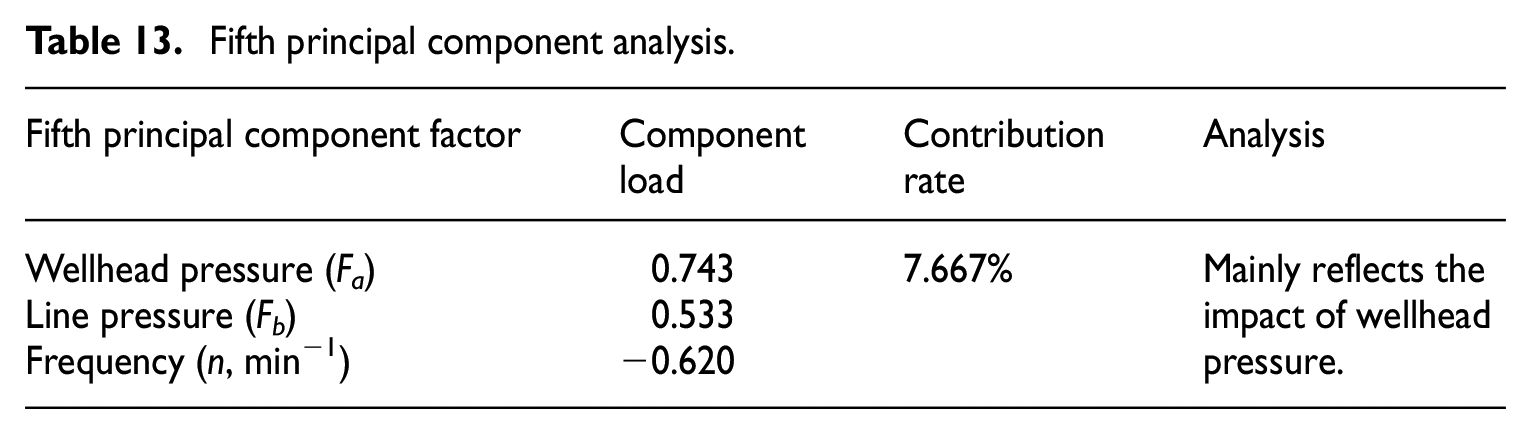
Fifth principal component analysis.
Sixth principal component analysis.

Seventh principal component analysis.
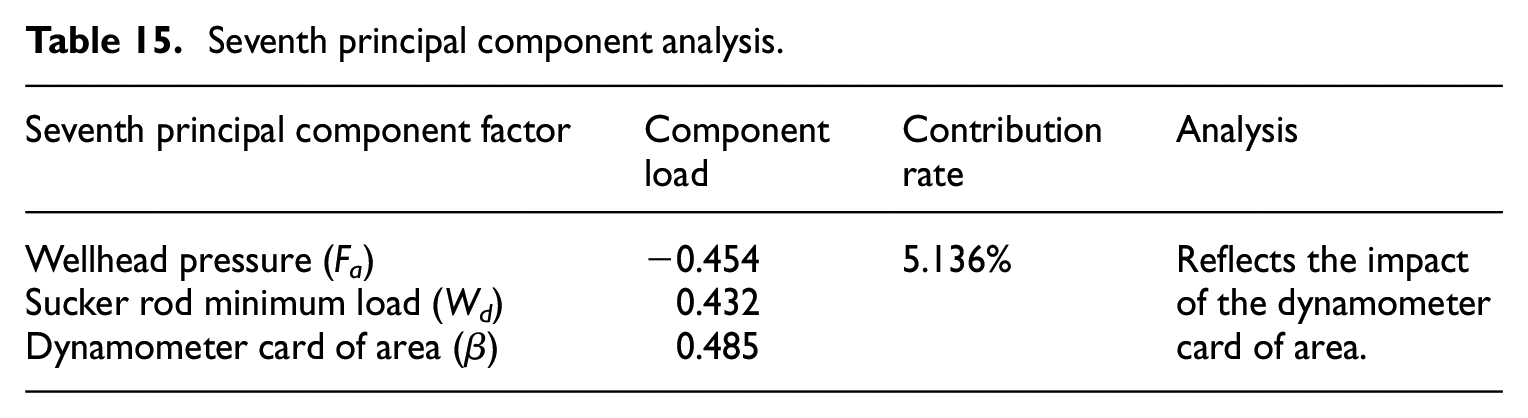
According to the principal component load value and the normalized data of each original index, the corresponding principal component expression and comprehensive evaluation function can be obtained. Due to space limitation, just the calculation expression of the first principal component can be listed

where Y1 represents the first principal component, and the index

Comprehensive value analysis
Substitute the data of 40 oil wells into the comprehensive evaluation function equation (12), and the comprehensive value ranking was obtained (as shown in Table 16).
Comprehensive score ranking.
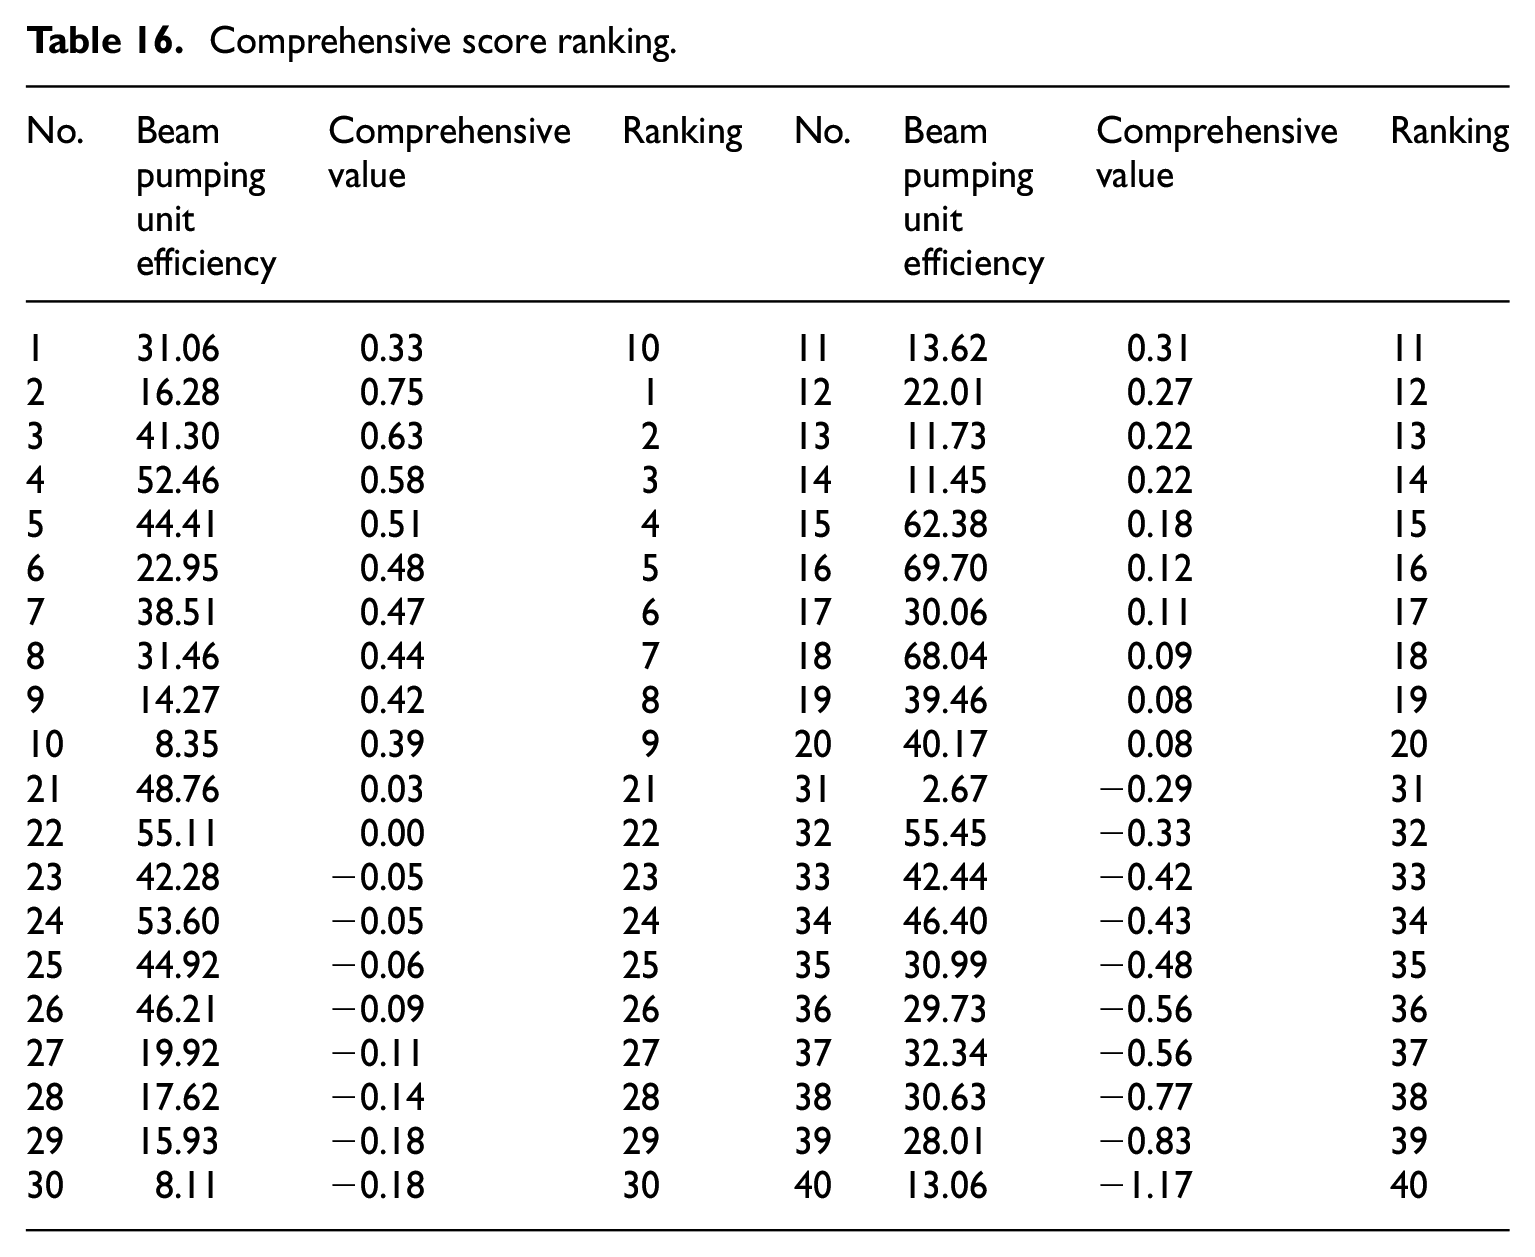
Figure 2 is the corresponding relationship between the comprehensive value Y of the No. 40 oil well and the efficiency of the pumping unit of the pumping unit.

Beam pumping unit efficiency and comprehensive score.
As shown in Figure 2, the comprehensive score interval is divided into A (−1.0 to −0.5), B (−0.5 to 0), C (0 to 0.5), and D (0.5 to 1.0). The efficiency range of the beam pumping unit is divided into I (0%–20%) low efficiency zone, II (20%–40%) medium efficiency zone, III (40%–60%) high efficiency zone, and IV (60%–100%) extremely efficiency zone, and the distribution points of each interval are shown in Table 17.
Comprehensive score and efficiency distribution of beam pumping unit.

As shown in Table 17, 66.7% of the distribution points in B zone are concentrated in the I (0%–20%) low zone; 84.6% of the C zone distribution points are concentrated in the II (20%–40%), III (40%–60%), and IV (60%–100%); 100% of D zone distribution point concentrated in II (20%–40%) and III (40%–60%).
As illustrated in Figure 3, When the comprehensive score is located in Zone C or Zone D (the comprehensive score is greater than 0), the probability of pumping unit efficiency reaching 20% (or above 20%) is significantly improved. Revealing that in the current working conditions, the higher comprehensive score corresponds to the higher probability of the beam pumping unit efficiency, especially when the composite score is greater than 0.
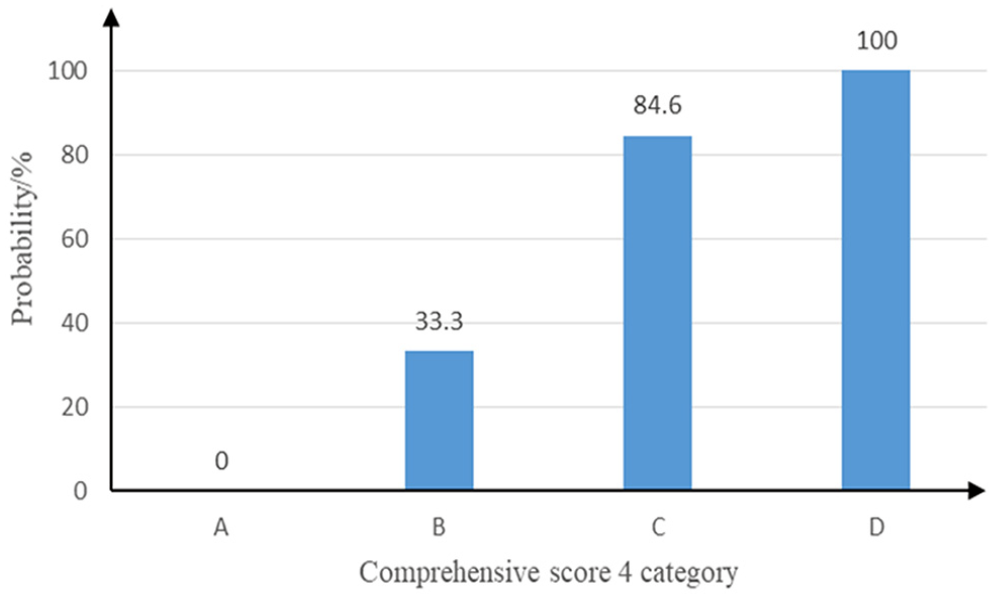
The probability that the data points of the four category of scoring areas fall in the efficiency II zone and above zone.
The purpose of the scoring model is to find the inefficient factors that affect the efficiency of the beam pumping unit, and the prediction model is used as a means of judging whether the target well is meeting the efficiency of the expected beam pumping unit.
Establishing the predictive model based on multiple linear regression equation
Establishment of regression equation based on principal component
The raw data of the No. 40 oil well were used to establish a predictive model that is the efficiency of the beam pumping unit by suing multiple linear regression analysis. And the Nos 41–45 oil well was used as the inspection data.
The multiple linear regression analysis was performed using the first seven principal component load scores of Nos 1–40 oil wells in Table 18, and the regression equation coefficients were obtained, Table 19.
Top seven main components of 45 wells.

Regression equation coefficients.

As illustrated in Table 19, listing the significance test results of independent variables (using Student’s t-test). Regression factor 1, regression factor 3, regression factor 4, and regression factor 5 pass the t-test with a significance level of 0.05, indicating that the above regression factors have significant effects on the dependent variables. 8
The regression equation can be obtained

The regression equation needs to be verified by data before it can be used as a predictive model.
Inspection and application of predictive models
The error of the prediction model of the beam pumping unit efficiency is not clearly defined in the seniors’ research. Therefore, we delimit the relative error of the predicted pumping unit efficiency is less than 10%, which is considered to be in line with expectations. The error of the prediction model can be calculated by


where
Using the above regression equation, the efficiency of the beam pumping unit of the Nos 41–45 well of the 22 kW motor group is predicted, and the relative error is shown in Table 20.
Comparison between test results and predicted results.

The method is used to predict the efficiency of the beam pumping unit of five wells, and the average relative error is 7.4%. It shows that the regression equation can accurately predict the efficiency of the beam pumping unit of the 10 type 22 kW motor unit.
As illustrated in Figure 4, no. 43 is located above 10% of the relative error line and is considered to be much lower than the predicted beam pumping efficiency. This point can be placed in the scoring model to find out the inefficient factors of the well, and then improve beam pumping unit efficiency.

Relative error of beam pumping unit efficiency.
Conclusion
For the oil well parameters adopted in this article, the following conclusions are obtained:
A total of 22 original indicators affected the efficiency of the pumping unit. Through principal component analysis, this article selects the top seven for regression analysis (the total contribution rate of the top seven principal components has reached 86.013%). This not only reduces the number of indicators that need to be considered and the dimension of the problem but also reflects the information of the original parameters as much as possible, and the components are independent of each other, which lays the foundation for the next step to establish an evaluation model.
Based on the principal component eigenvalues, the established scoring model, the integrated value obtained by the data, reflects the correspondence between the comprehensive value and the efficiency of the beam pumping unit. When the comprehensive score is greater than or equal to 1.0, the probability of the corresponding medium-high beam pumping unit efficiency is significantly improved; for oil wells with a comprehensive score less than 1.0, it can be considered to find the inefficient factor from the seven principal component components.
Based on the principal component components, the multi-step linear regression method was used to predict the efficiency of the pumping unit. The results show that the prediction model has higher accuracy and provides a reference standard for judging the efficiency of the beam pumping unit.
The efficiency evaluation model of the beam pumping unit is composed of a scoring model and a predictive model, and can judge and improve the pumping unit efficiency of the target oil well.
According to the pumping unit model, motor power, reservoir characteristics, and other parameters to refine the classification, and then establish an evaluation model, can more accurately and reasonably evaluate the efficiency of the target beam pumping unit.
Footnotes
Declaration of conflicting interests
The author(s) declared no potential conflicts of interest with respect to the research, authorship, and/or publication of this article.
Funding
The author(s) disclosed receipt of the following financial support for the research, authorship, and/or publication of this article: This work is supported by the key Laboratory of Oil and Gas Equipment Foundation of Ministry of Education.