
Abstract
Objectives:
Increases in absenteeism among schoolchildren may precede increases in incidence of community-level respiratory diseases. This study assessed the correlations and predictive values between all-cause absenteeism among kindergarten through grade 12 students and community-level increases in influenza and COVID-19.
Methods:
We used absenteeism data from 4 school districts (1 each in Arizona, California, Nevada, and Wisconsin) between fall 2018 (starting approximately late August) and spring 2022 (typically ending in May) to calculate correlations between school absenteeism and community-level cases of influenza, percentage of influenza-like illness, and COVID-19. We estimated the positive predictive value (PPV) of a ≥20% increase in school absences to predict a ≥20% increase in community respiratory disease 1 or 2 weeks later.
Results:
We observed a median correlation of 0.4 between absenteeism and influenza cases across school years and districts, with a maximum of 0.8. COVID-19 cases had a median correlation of 0.1 with school absenteeism during the 2021-2022 school year. The median PPV for predicting increases 2 weeks ahead was 0.4 for influenza and was 0.3 for COVID-19.
Conclusions:
Correlations and PPVs between all-cause school absenteeism and respiratory disease were variable, often <0.5. School and public health officials may find absenteeism an inconsistent predictor of community-level respiratory diseases, limiting its utility for syndromic surveillance. Standardizing absence definitions and improving reporting timeliness may enhance its effectiveness.
Absences by students in elementary, middle, and high schools may be suitable for syndromic surveillance of near-term (ie, 1-2 weeks ahead) community-level increases in communicable diseases. Syndromic surveillance involves collecting information on symptoms and clinical signs of disease in a population, rather than relying on laboratory or clinically confirmed cases.1 -4 It uses signs, symptoms, and clinical first impressions to enable real-time detection of the spread of an illness, allowing for faster-than-previous public health responses.1,3 However, syndromic surveillance that relies on data originating in health care settings presents challenges because cases are detected only among those who seek care. For example, during the COVID-19 pandemic, people with mild illness were advised to avoid emergency departments and urgent care facilities, especially during periods of high stress on health care systems. 5 Additionally, respiratory diseases often cause mild illness in children, which may not require health care services, leading to underrepresentation in clinical case–based surveillance systems. 6
Alternative data sources, such as pharmacy purchases and internet search trends, have recently been explored as potentially more accurate means of tracking community health conditions. 7 School absenteeism data have also been studied as a form of syndromic surveillance for respiratory diseases, including influenza and COVID-19.8 -15 Previous studies have used statistical models to assess school absenteeism as a predictor of the onset of seasonal influenza waves or to estimate the number of influenza cases.16,17 However, translating such data into actionable measures during the school year is challenging.
In this study, we assessed whether school absenteeism (all causes) can predict community-level increases in respiratory diseases 1 to 2 weeks in advance. We focused on readily available data that school supervisors and public health officials with limited analytical resources could use, emphasizing practical application at the district and local public health jurisdiction level. Rather than isolating specific causes of absenteeism, we examined whether the aggregated data contain a sufficient “signal” (ie, a detectable indication of a change in incidence) to predict trends in community respiratory disease. In short, we evaluated absenteeism as a real-world surveillance tool across diverse settings that naturally vary in influenza seasonality, vaccine uptake, school district characteristics, community interventions, and other factors that affect patterns of absenteeism and disease transmission.
Methods
Data Sources
We recruited 4 school districts, 1 each in Arizona, California, Nevada, and Wisconsin, to share data for this project. In the United States, most school districts are independent local government institutions whose jurisdictions often coincide with county boundaries. Each district provided 4 years of deidentified attendance data (2018-2022), creating retrospective cohorts of kindergarten through grade 12 (K-12) schools. In the collaborating districts, elementary school includes kindergarten through grade 5 (K-5; ages 5-11 y) and middle and high school include grades 6-12 (ages 12-18 y). Overall, 275 schools participated (9 from Arizona, 103 from California, 114 from Nevada, and 49 from Wisconsin) serving >170 000 students. We obtained data on county populations for the US Census Bureau 18 (Table). These were all the schools in each collaborating school district. The school districts from California and Nevada have approximately 73 000 and 66 000 enrollees, respectively, placing them in the 100 largest school districts in the United States. 19
List of counties and school districts in Arizona, California, Nevada, and Wisconsin, as well as county populations, number of schools, and student enrollment, used to evaluate school absences as a predictor of community-level respiratory disease, 2018-2022
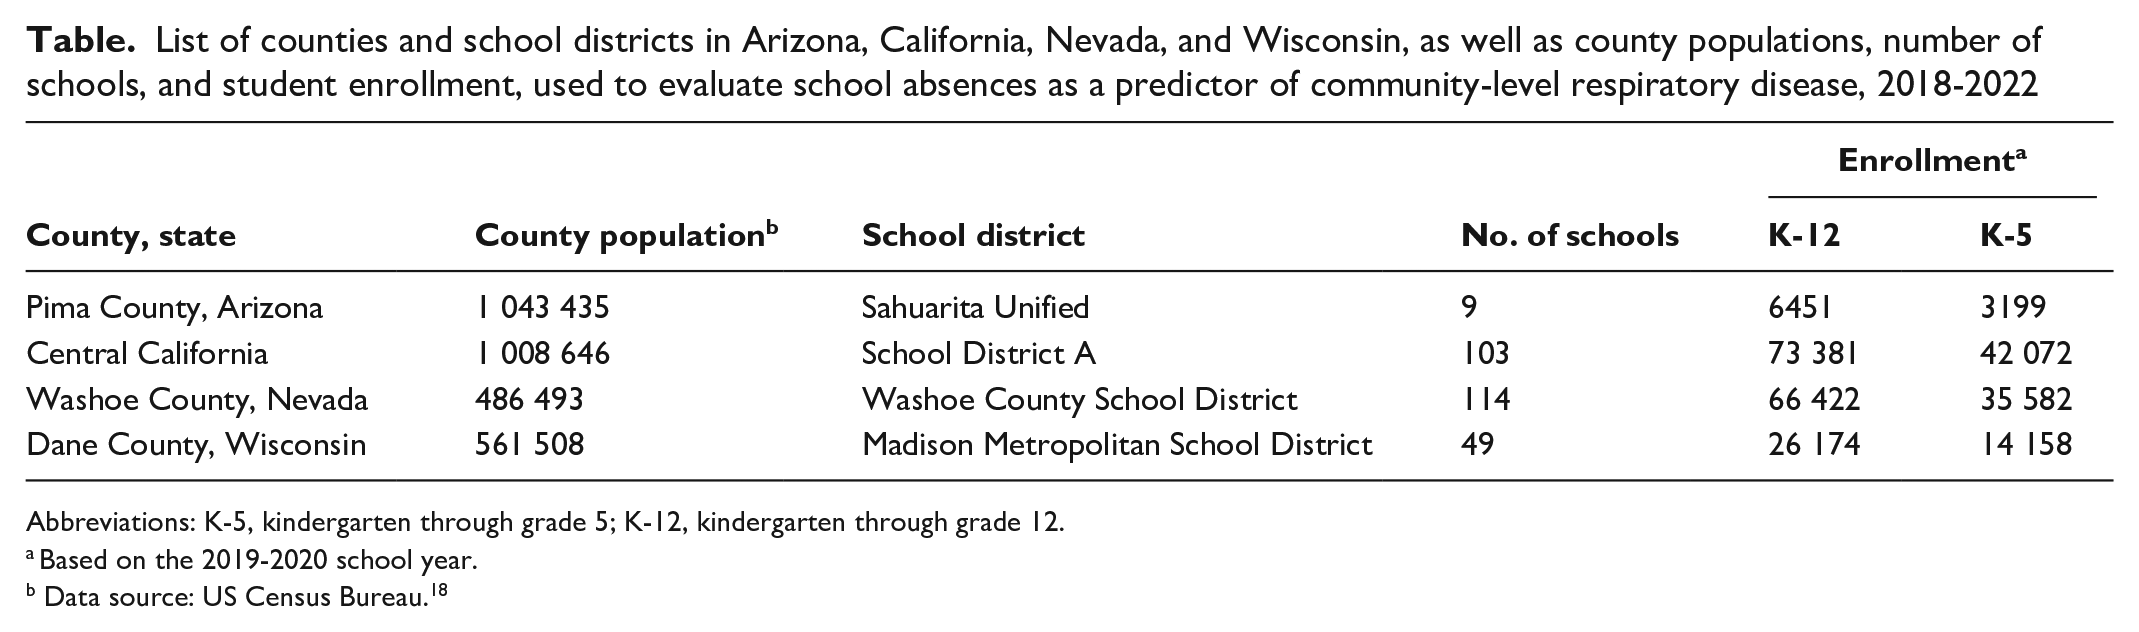
Abbreviations: K-5, kindergarten through grade 5; K-12, kindergarten through grade 12.
Based on the 2019-2020 school year.
Data source: US Census Bureau. 18
The attendance data included daily counts of the number of students absent, encompassing total absences and counts for each category of absence type. Absence categories varied across the districts but generally included excused and unexcused absences as well as illness-related and non–illness-related absences (eTable 1 in Supplemental Material). Because of varying absenteeism codes across districts and to make our methodology potentially universally applicable, we included all types of absenteeism in the analysis except for the Nevada district, which provided only illness-related absences. Three of the 4 collaborating districts recorded absences only in whole-day units, even for partial-day absences. The Madison Metropolitan School District in Dane County, Wisconsin, was unable to provide absenteeism data for the 2018-2019 school year.
Community-level influenza case data (2018-2022) were provided by corresponding local and state health departments for each county in which the school districts are located. Participating health departments included the Arizona Department of Health Services, the California Department of Public Health, the Nevada-Washoe County Health District, and the Wisconsin Department of Health Services. Nevada provided the percentage of patients with a chief complaint of influenza-like illness (ILI; percentage ILI cases) seen by medical practitioners, while other health departments provided laboratory-confirmed influenza cases captured by sentinel surveillance systems (eg, the surveillance system in California 20 ) (eTable 2 in Supplemental Material). We obtained COVID-19 data (2020-2022) from existing Centers for Disease Control and Prevention (CDC) data collected during the emergency response. 21
Weekly Absenteeism
To quantify absenteeism, we calculated the percentage of school days lost per week by dividing the total number of weekly absences by 5 times the student enrollment. We assumed that each week consisted of 5 school days; we did not account for federal or state holidays. We calculated weekly absenteeism, measured in Morbidity and Mortality Weekly Reports (MMWR) weeks for each grade and for each school type (elementary, middle, and high school) across the school year. 22 For the Arizona district, this school year spanned MMWR weeks 32 through 21; for School District A in Central California, MMWR weeks 33 through 23; for the Nevada district, MMWR weeks 33 through 23; and for the Wisconsin district, MMWR weeks 36 through 23. School weeks that coincided with holiday weeks (eg, Thanksgiving week), school breaks (spring or winter break), or school closures during COVID-19 shelter in place in spring 2020 (beginning MMWR week 12) had absenteeism rates <0.1% and were excluded from analysis (eTable 3 in Supplemental Material).
Correlation Between School Absenteeism and Community Respiratory Illness
We calculated correlations between weekly absenteeism and the number of laboratory-confirmed influenza cases (or percentage ILI cases for Washoe County) and the number of COVID-19 cases in each corresponding county. We conducted the analysis 3 times, with no lag, a 1-week lag, or a 2-week lag between influenza cases, percentage ILI cases, or COVID-19 cases and absences (eg, absences in week 1 were correlated with influenza cases in week 2 and week 3). For each correlation, we used 2 nonparametric correlation tests (Spearman rank and Kendall τ) because they do not rely on normality assumptions. We first calculated correlations using absences from all grades (K-12). Then, because a previous study 23 showed that elementary school absence records (vs absence data from secondary schools) are more consistent and have a higher correlation with disease spread in households, we repeated the calculations using only absences from elementary grades (K-5). This process resulted in 84 separate estimated correlations.
Predictive Values of School Absenteeism in Predicting an Increase in Community Respiratory Illness
We evaluated the predictive value of school absenteeism as an indicator of increased community incidence of influenza, ILI, or COVID-19. Given that baseline absenteeism levels vary by grade, school year, and district, we used week-to-week increases in absenteeism for our analysis. We defined the positive predictive value (PPV) of an increase in school absenteeism as follows: when weekly absenteeism exceeds a preset threshold, the PPV represents the proportion of those increases that correspond to an actual increase in week-to-week community-level respiratory illness cases studied (laboratory-confirmed influenza, percentage ILI cases, or COVID-19 cases). That is, the PPV estimates the likelihood that a preset increase in school absences corresponds to a preset increase in community respiratory illnesses.
For each school district, we created 12 scenarios to examine the PPV of using school absences to predict community levels of cases of respiratory illness. These scenarios were constructed by using 4 threshold levels for week-to-week increases in school absences (5%, 10%, 15%, and 20%) and 3 threshold levels for increases in community illnesses (20%, 50%, and 100%). We ran these 12 scenarios for each district twice, measuring the associations between school absences and reported community levels of influenza (or ILI percentages) 1 or 2 weeks into the future. Overall, each school district had 24 scenarios. We examined the same number of scenarios with the same threshold values for COVID-19 cases.
We then examined the negative predictive value (NPV) for each scenario. The NPV estimates the likelihood that a failure to meet a preset increase (threshold) in school absences corresponds to a failure to meet a preset increase in community-level respiratory illnesses. We conducted all analyses using R 4.2.3 (R Foundation for Statistical Computing).
Sensitivity Analyses
All the described methods to estimate correlations, PPVs, and NPVs used datasets that covered the entire school year. To examine whether focusing on a shorter period when influenza and ILI cases are more likely to be reported (the “influenza season”) would yield different results, we reran the 84 correlations using data from MMWR week 40 to week 20. In general, this period is considered the influenza season, during which the number of influenza cases or percentage of ILI cases peaks. 24 Doing so resulted in an approximately 25% reduction in the number of weeks of data included in each estimated correlation as compared with the baseline.
Human Subjects Approval
Preparation of this analysis did not involve primary research or data collection involving human subjects; therefore, no institutional review board examination or approval was required. This activity was reviewed by CDC and was conducted consistent with applicable federal law and CDC policy (see, eg, 45 CFR part 46.102[l][2], 21 CFR part 56; 42 USC §241[d], 5 USC §552a, 44 USC §3501 et seq).
Results
Weekly Absenteeism
Elementary students typically experienced the lowest median absenteeism (4% of school days lost per week) with variability over time and between school districts. For example, elementary schools in the Sahuarita Unified School District in Pima County, Arizona, reported 0.2% school days lost per week during the 2019-2020 school year, while schools in the Madison Metropolitan School District in Dane County, Wisconsin, reported 10.4% lost school days per week during the 2021-2022 school year (eTable 4 in Supplemental Material). Across all school years and school districts examined, high school students had the highest rate of absenteeism, with a median 10.3% school days lost per week (range, 0.7% in the Washoe County School District in Washoe County, Nevada, during the 2018-2019 school year to 16.8% in School District A in Central California during the 2021-2022 school year) (eTable 4 in Supplemental Material). Except for the Sahuarita Unified School District, the overall absenteeism rate in the other 3 districts increased over time, and the last school year analyzed (2021-2022) had the highest rate of absenteeism (Figure 1). The median weekly absenteeism in the Washoe County School District was lower than in the other school districts (0.9% school days lost per week in Nevada, 6.9% in Arizona, 7.8% in California, and 10.3% in Wisconsin). This lower median weekly absence is a result of the Washoe County School District providing only absenteeism records associated with 4 illness-related codes, whereas other districts provided all records of absenteeism (eTable 1 in Supplemental Material).
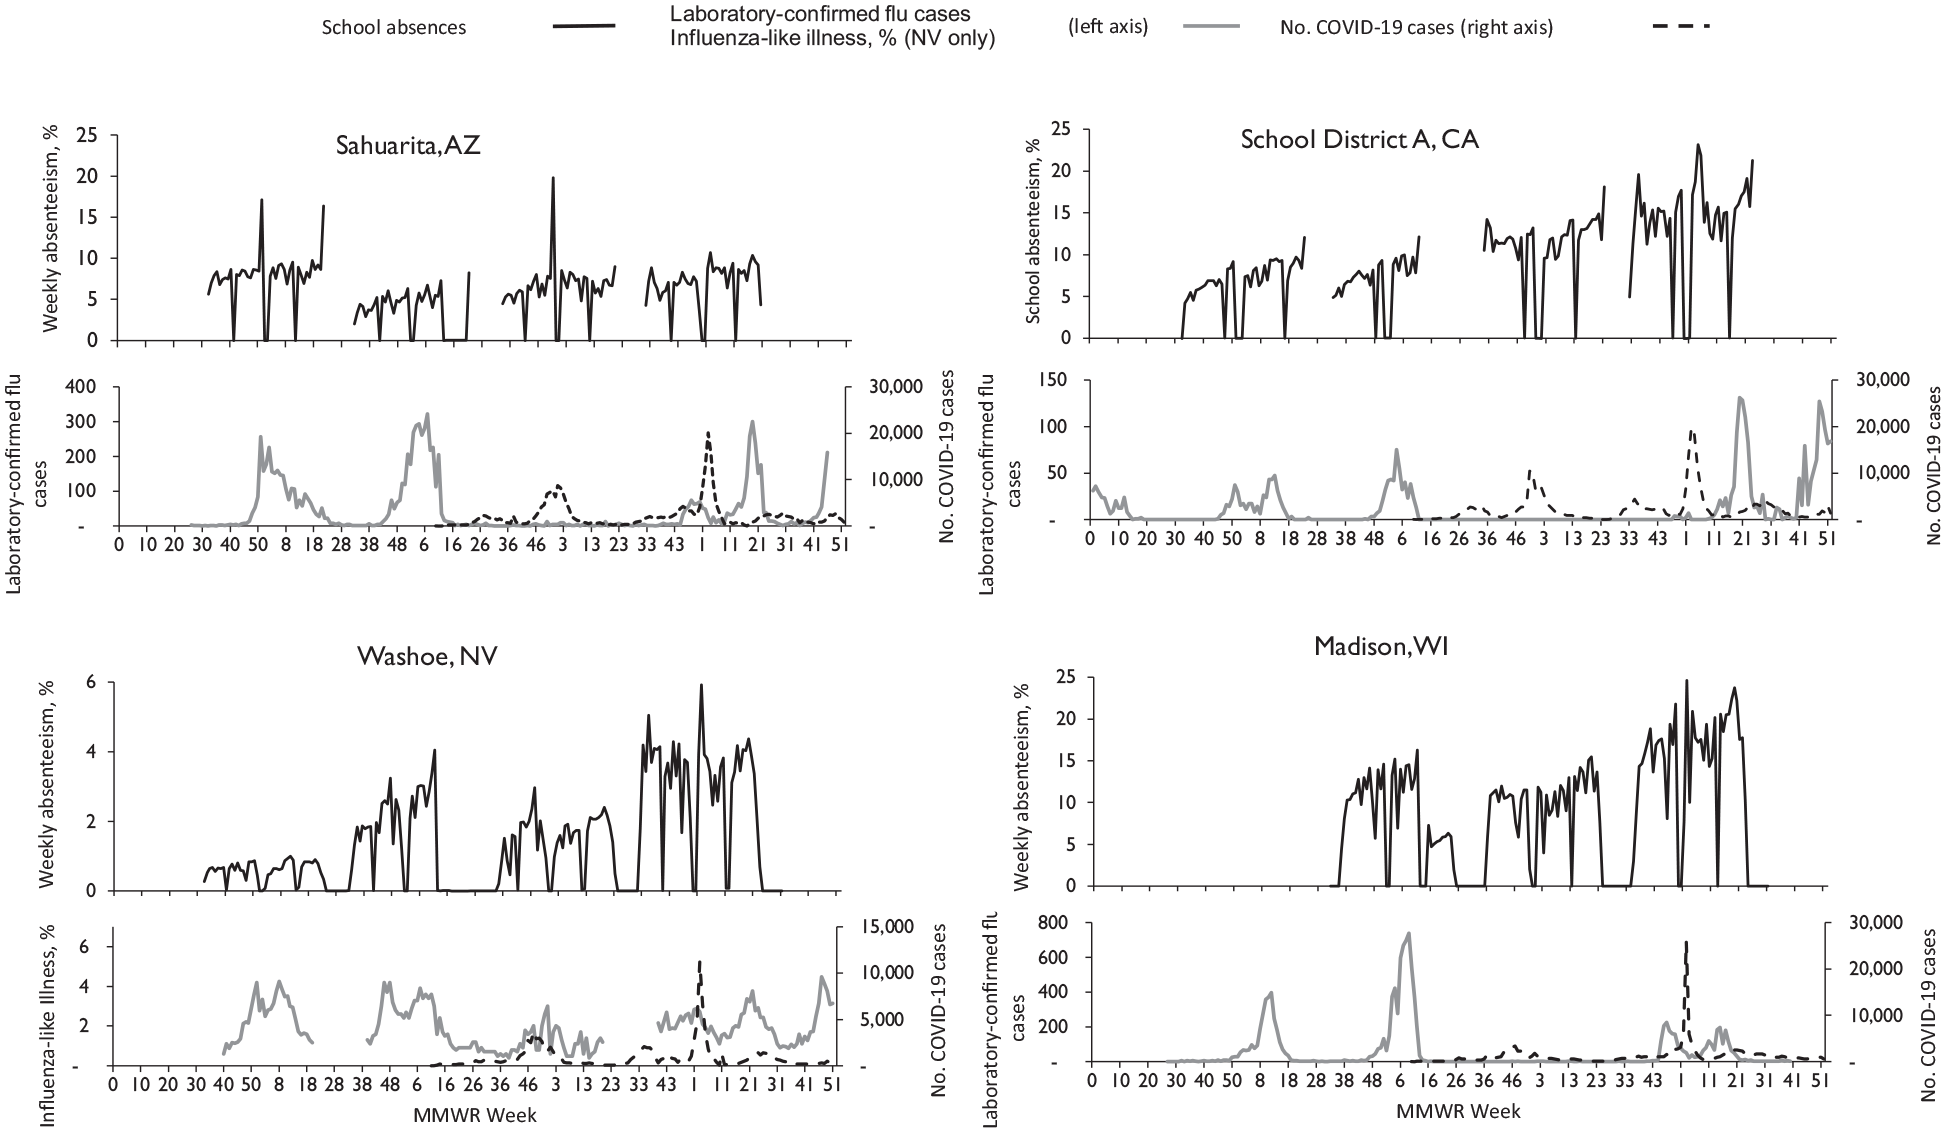
Percentage of weekly school days lost from grades K-12 and reported cases of laboratory-confirmed influenza (flu), influenza-like illness (ILI), and COVID-19 in 4 US communities, by MMWR week, during the 2018-2022 school years. The 4 communities were the Sahuarita Unified School District in Pima County, Arizona; School District A in Central California; the Washoe County School District in Washoe County, Nevada; and the Madison Metropolitan School District in Dane County, Wisconsin. The Washoe County School District reported absences for medical reasons only. All other districts reported absences for all causes. The Washoe County School District provided the percentage of ILI cases, and the other districts reported cases of laboratory-confirmed influenza captured by sentinel surveillance systems. School weeks excluded from the analyses are shown where “% of weekly absences” is recorded at ≤0.1%. Note that the scale varies for the y-axes. Abbreviations: K-12, kindergarten through grade 12; MMWR, Morbidity and Mortality Weekly Report.
Correlation Between School Absenteeism and Respiratory Illness in the Community
The correlation between weekly school absenteeism and the number of influenza cases (or percentage ILI cases) in the community was generally positive, with variation across jurisdictions and school years (Figure 2). We found a median correlation of 0.4 (IQR, 0.2-0.6) between K-12 student absenteeism and the number of community-level cases of influenza or ILI. Grades K-5 showed a slightly higher correlation between absenteeism and influenza or percentage ILI cases than grades K-12, with a median correlation of 0.5 (IQR, 0.2-0.6). During and after the pandemic, some correlation values were negative. The overall correlations between influenza (or ILI) and school absences were similar across the 3 time-lag scenarios (ie, no lag time between school absenteeism and influenza or ILI cases, 1-week lag, and 2-week lag).
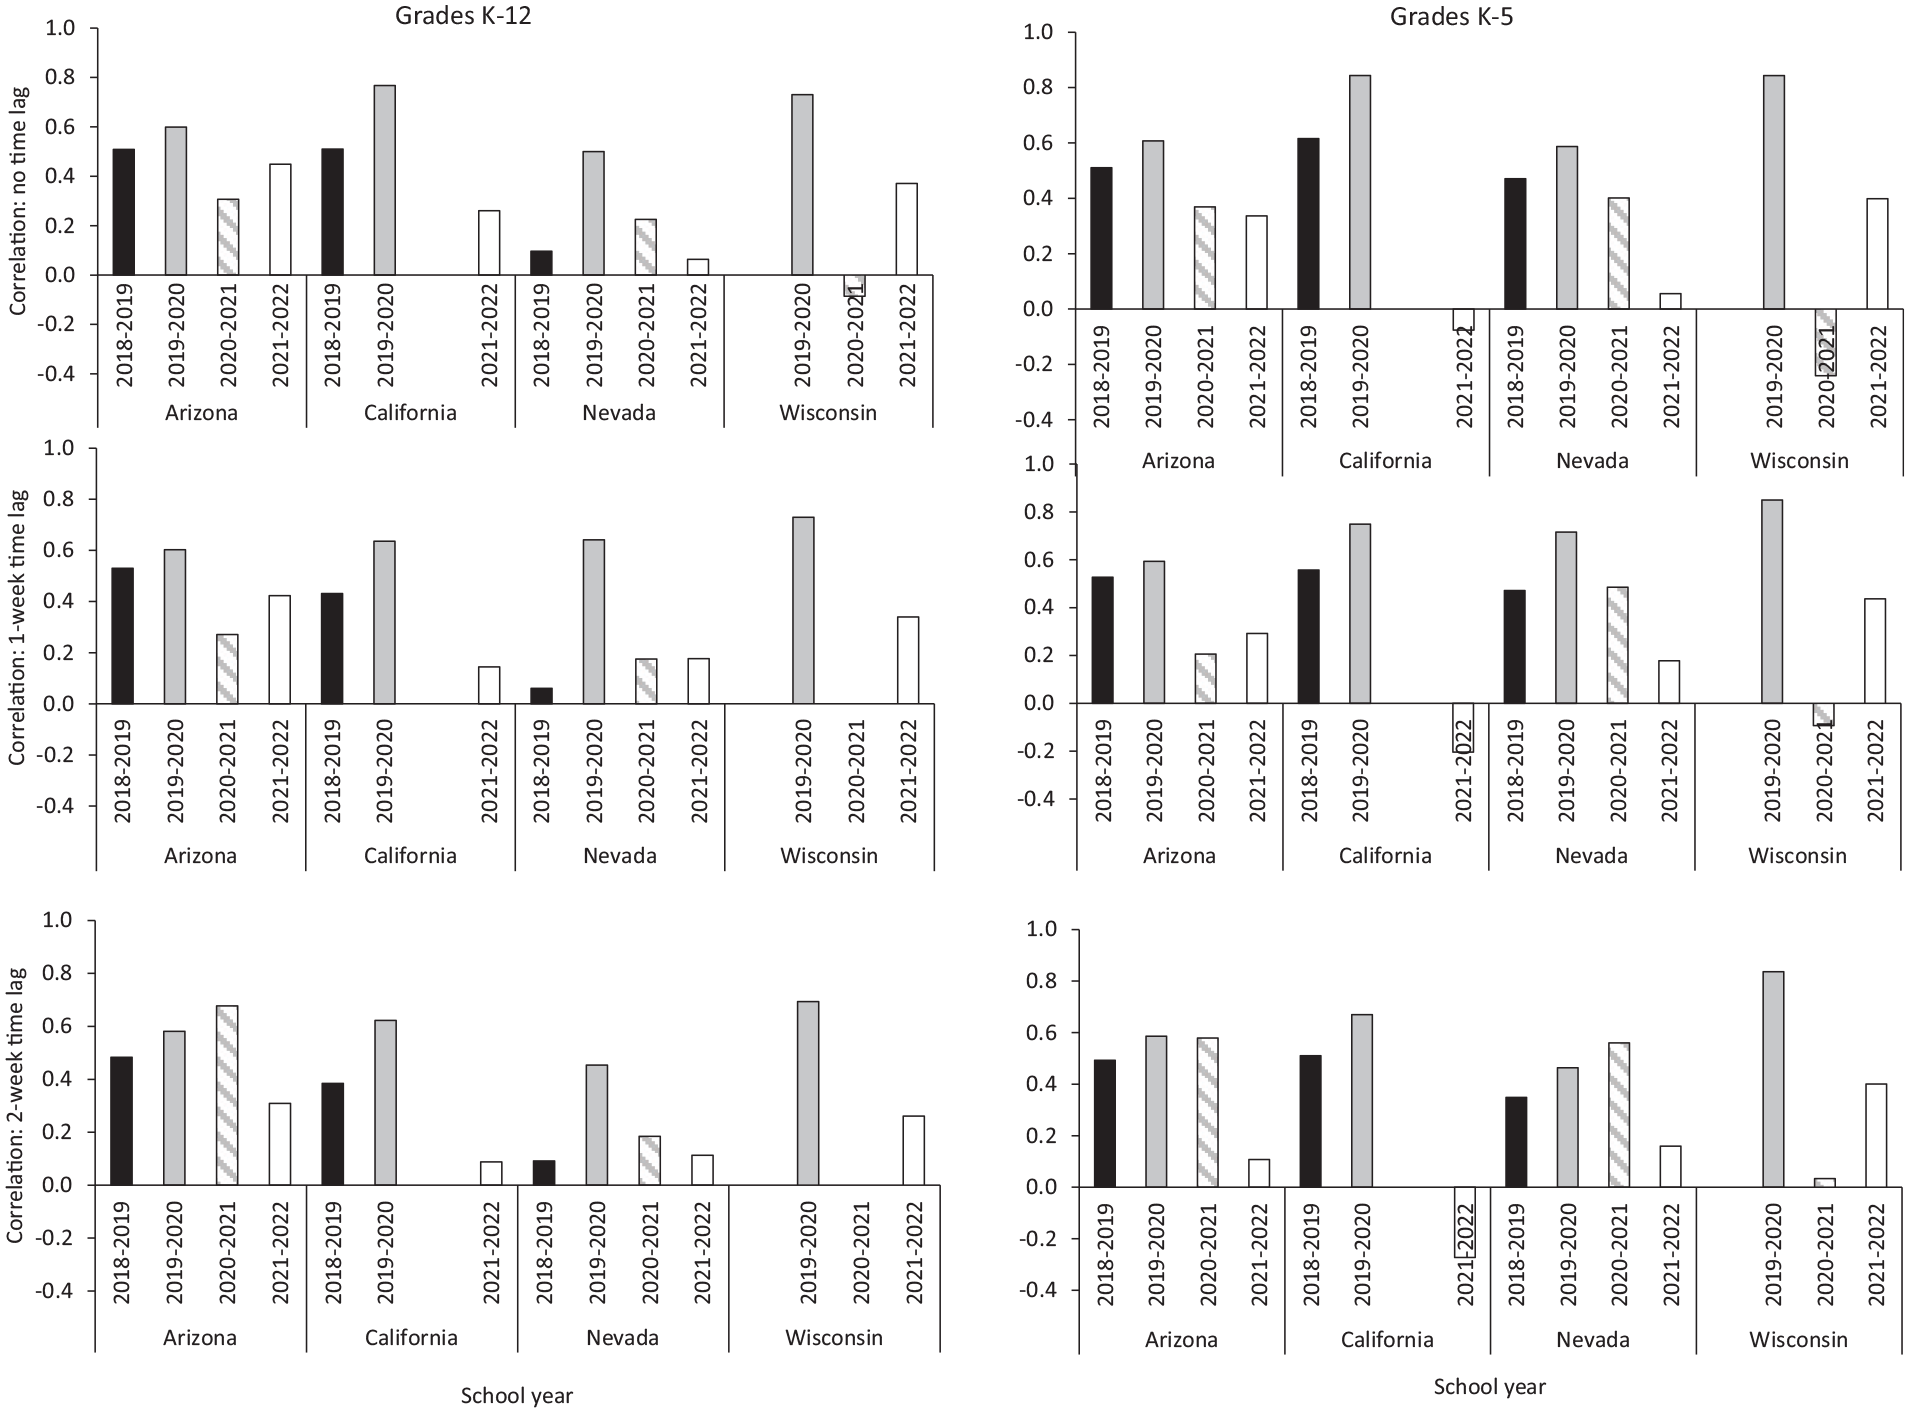
Correlations between school absenteeism and influenza cases or percentage of influenza-like illness (ILI) in 4 US communities, 2018-2022 school years. The 4 communities were the Sahuarita Unified School District in Pima County, Arizona; School District A in Central California; the Washoe County School District in Washoe County, Nevada; and the Madison Metropolitan School District in Dane County, Wisconsin. Correlations were calculated by using nonparametric tests (Spearman rank and Kendall τ); results from Spearman rank are presented. In the scenario for “no time lag,” correlations compare school absenteeism in each week with the number of laboratory-confirmed influenza cases or percentage of ILI reported in the same week. In the 1- and 2-week time-lag scenarios, correlations compare school absenteeism in a given week with the number of influenza cases or percentage of ILI cases reported 1 or 2 weeks after, respectively. Time lagging accounts for potential delays in using school absences to predict future community levels of influenza, allowing predictions 1 or 2 weeks in advance. Laboratory-confirmed influenza cases were used for Arizona, California, and Wisconsin, and percentages of ILI cases were used for Nevada. California had no confirmed influenza cases during the 2020-2021 school year; Wisconsin did not provide school absenteeism data for 2018-2019. Abbreviations: K-5, kindergarten through grade 5; K-12, kindergarten through grade 12.
The correlations between absenteeism and the number of COVID-19 cases in the community ranged from −0.6 to 0.7, with a median of 0.1 (eFigure 1 in Supplemental Material). During the 2020-2021 school year, most school districts showed a negative correlation between the variables.
Predictive Value of School Absenteeism
Among the 24 scenarios examined with data from grades K-12, the overall PPV was highest, with a median of 0.4 (range, 0.1-0.6), with a 2-week lag and a ≥20% increase in absenteeism as a predictor of a ≥20% increase in community influenza cases or percentage ILI cases (Figure 3, eTable 5a in Supplemental Material). Focusing on grades K-5 did not notably increase the estimated PPVs. For grades K-5, the highest median PPV of 0.3 (range, 0.2-0.6) occurred in the scenario with a ≥5% increase in school absences predicting a ≥20% increase in community influenza cases or percentage ILI cases 2 weeks forward (eTable 5b in Supplemental Material).
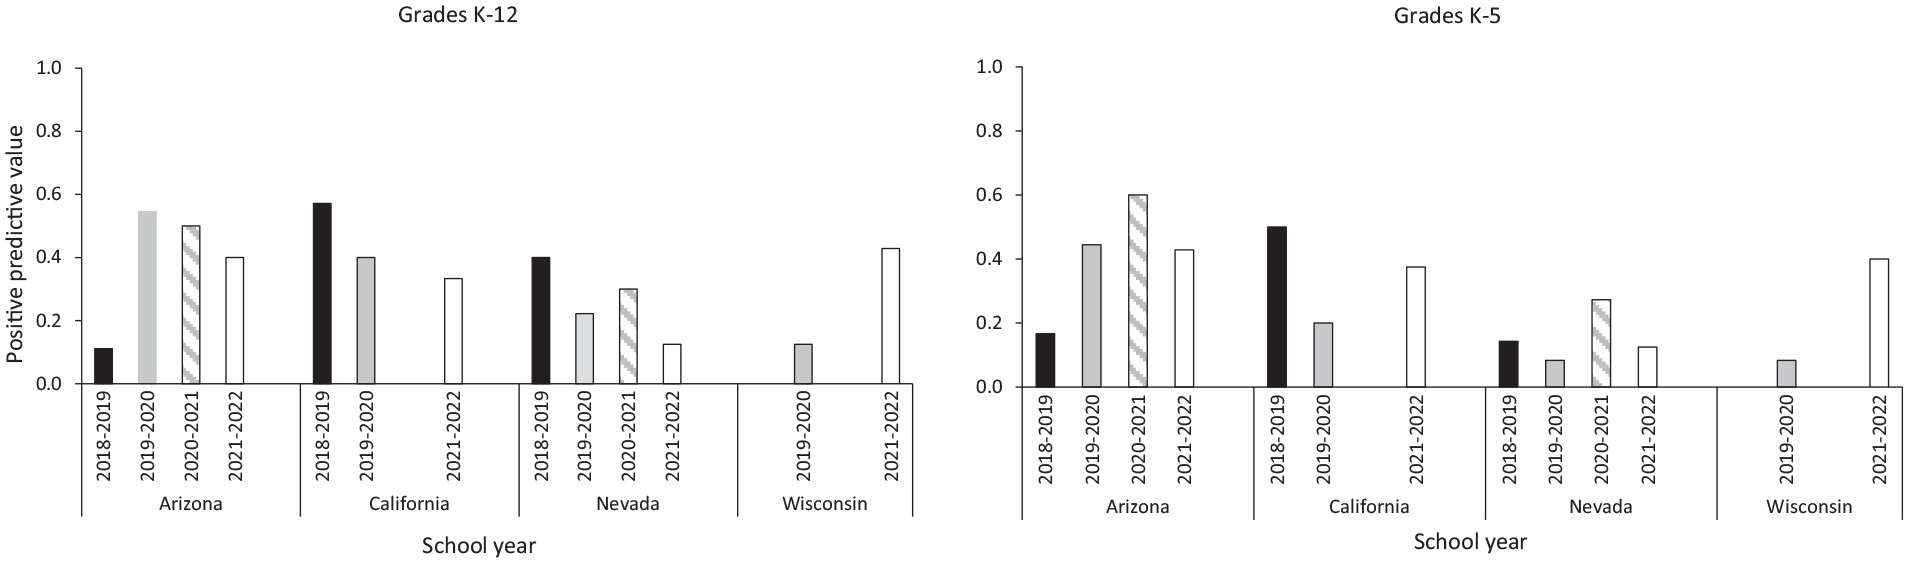
Positive predictive values (PPVs) of absenteeism from grades K-12 and K-5 for predicting increases in the number of influenza cases in 4 US communities during the 2018-2022 school years. How well does a ≥20% increase in absenteeism predict a ≥20% increase in influenza cases (or percentage influenza-like illness [ILI]) 2 weeks ahead? PPV is an estimate of the likelihood that a preset minimum increase in community levels of influenza will occur given a preset minimum increase in school absenteeism. The 4 communities were the Sahuarita Unified School District in Pima County, Arizona; School District A in Central California; the Washoe County School District in Washoe County, Nevada; and the Madison Metropolitan School District in Dane County, Wisconsin. California had no confirmed influenza cases during the 2020-2021 school year. Wisconsin did not provide school absenteeism data for 2018-2019. For the 2020-2021 school year, the correlation and the PPV were close to zero in Wisconsin. Abbreviations: K-5, kindergarten through grade 5; K-12, kindergarten through grade 12.
The predictive value of absenteeism for forecasting increases in COVID-19 cases was lower than that for influenza cases, with a median of 0.3 (range, 0-0.5) with a 2-week lag and a ≥20% increase in absences to predict a ≥20% increase in community COVID-19 cases (eFigure 2, eTable 6a and 6b in Supplemental Material). The equivalent NPV results are provided in the Supplemental Material (eTables 7a, 7b, 8a, and 8b).
The frequency of large increases in influenza cases influenced the predictive value. The percentage of weeks with a >20% increase in community cases of influenza or ILI varied across districts: 19.5% of the weeks in Nevada, 20.0% in California, 27.0% in Wisconsin, and 40.2% in Arizona. Because Pima County, Arizona, experienced such increases in influenza cases twice as often as counties in other school districts, it had the highest overall PPVs. Predicting a >100% week-to-week increase in influenza activity resulted in the lowest PPV (Figure 4), likely because of the rare incidence of such large increases in influenza cases throughout the school year.
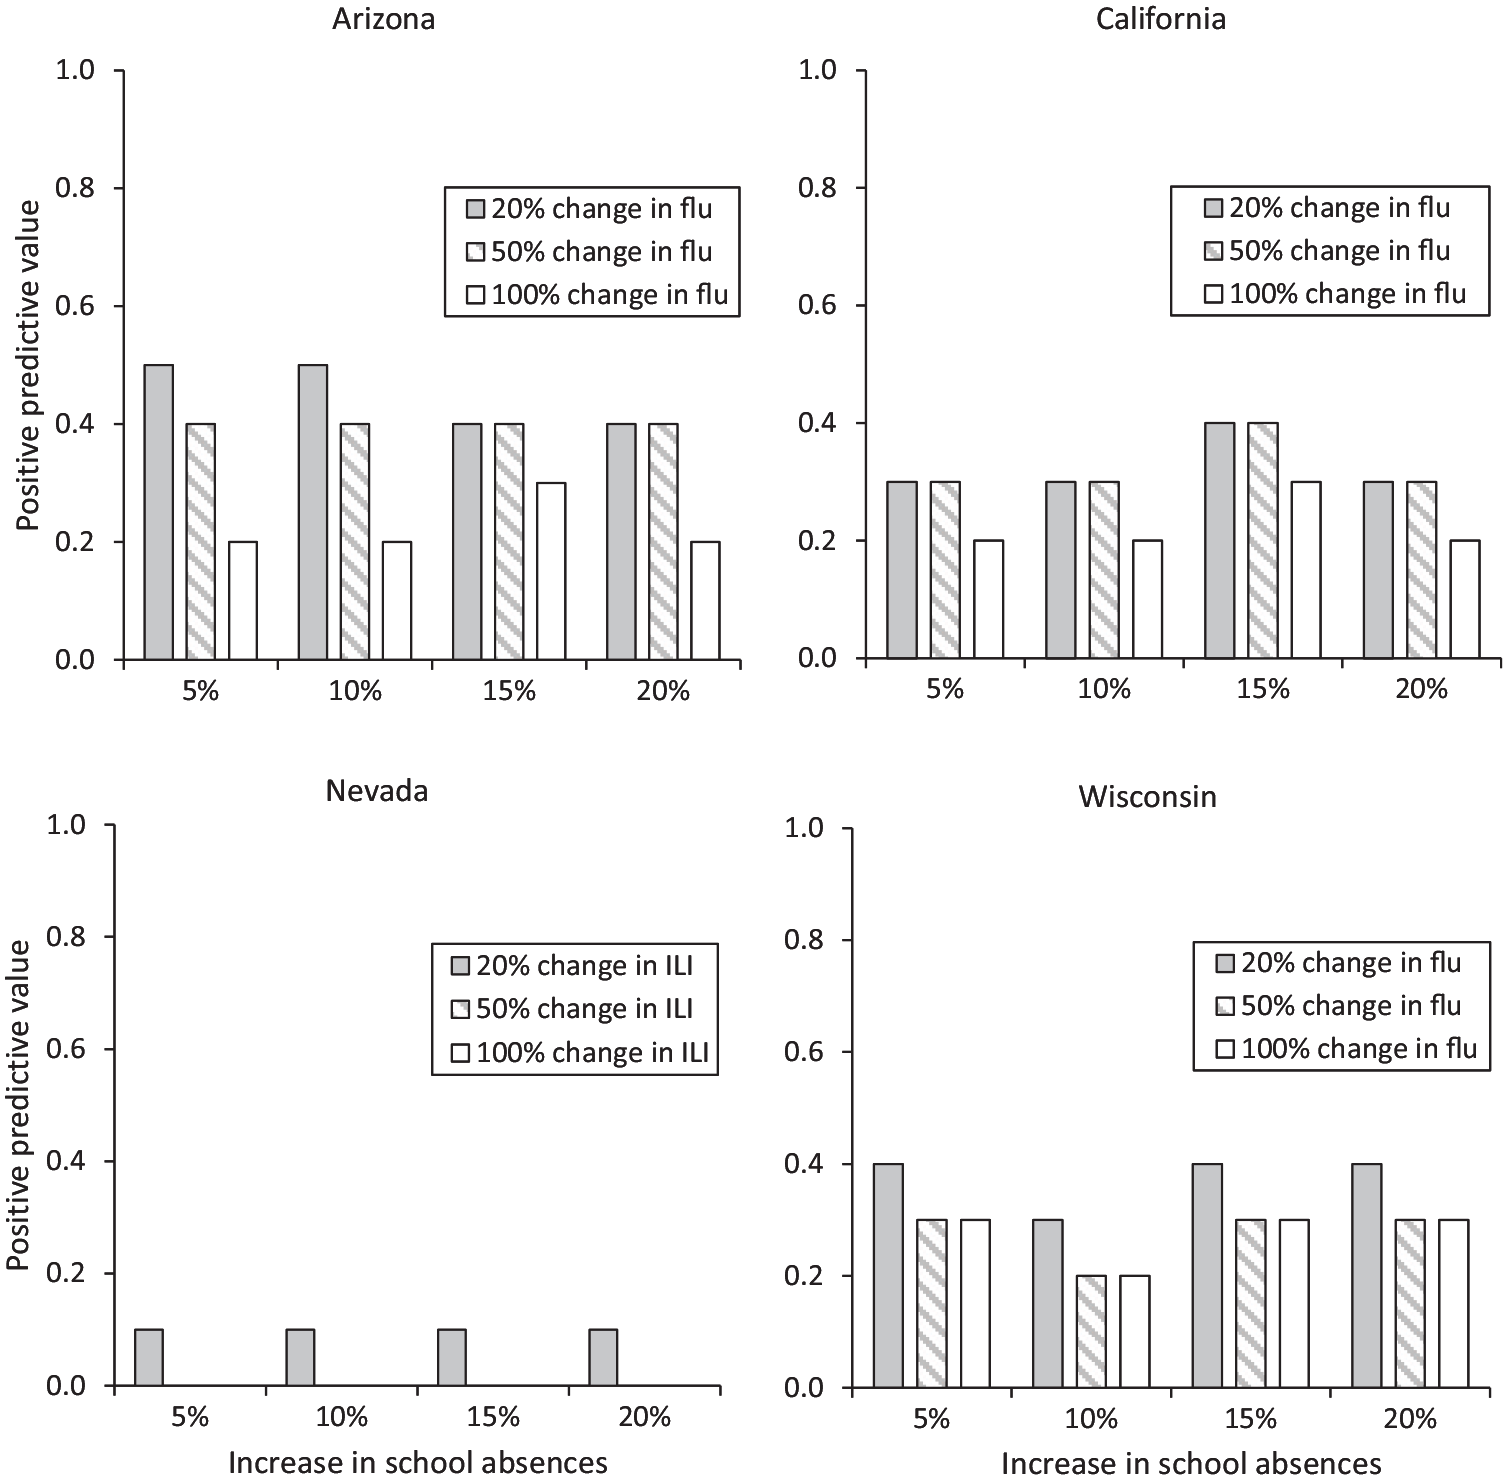
Changes to positive predictive values (PPVs) under various levels of percentage absenteeism in grades K-12 to predict 2-week–ahead increases in influenza (flu) or influenza-like illness (ILI) cases in 4 US communities during the 2021-2022 school year. PPV is an estimate of the likelihood that a preset minimum increase in community levels of influenza will occur given a preset minimum increase in school absenteeism. The 4 communities were the Sahuarita Unified School District in Pima County, Arizona; School District A in Central California; the Washoe County School District in Washoe County, Nevada; and the Madison Metropolitan School District in Dane County, Wisconsin. In Washoe County, the calculated PPVs for 2-week–ahead 50% and 100% changes in community levels of ILI were 0% for all percentage changes in school absences. Abbreviation: K-12, kindergarten through grade 12.
Sensitivity Analysis
Almost all correlations calculated with data for the full school year (approximately MMWR week 32 to week 21 of the following year) were greater than those calculated with data from MMWR week 40 to week 20 of the following year (representing the influenza season) (eTable 9 in Supplemental Material).
Discussion
Weekly all-cause school absenteeism and community influenza (or ILI) cases had modest positive correlations, with a median of 0.4 (IQR, 0.2-0.6). School absenteeism was not a reliable indicator of COVID-19 cases in the community, as indicated by the low correlation (median = 0.1). Several factors could have contributed to this result, including isolation requirements that prolonged student absences; increased availability of at-home testing, which is not reflected in official case counts; and varying transmission dynamics across contact networks.25 -27
The predictive value of all-cause school absenteeism depends on several factors, including the frequency of large increases in influenza cases. For example, the Arizona district had twice as many weeks with a >20% week-to-week increase in community influenza cases as compared with other districts, and it had one of the highest PPVs in the data analyzed. K-12 student absenteeism can be a tool for anticipating and responding to surges in community influenza cases.6,15,16,20,28 Our results indicate that while absenteeism can be predictive, its accuracy is influenced by regional variations and the frequency of large outbreaks.
Students in grades K-5 had lower overall absenteeism rates than students in grades K-12, with slightly higher correlations to cases of respiratory disease in the community. Their PPV for predicting increases in influenza cases was slightly lower than that of K-12 students but slightly higher for predicting COVID-19 cases. Previous studies found that absence records from elementary school, when compared with absence records from grades 6 to 12, are generally more consistent and have a higher correlation with disease spread in households.15 -17,23,28 It may be worthwhile to evaluate the feasibility of focusing data collection on students in grades K-5.
Illness-related absences have the strongest connection to disease incidence. 15 However, we did not observe this relationship in our analysis. The Washoe County School District in Nevada provided only illness-related absences for the period of interest, but these data did not translate into a stronger connection between absenteeism and disease incidence. Further research may be needed to understand why these results did not align.
Limitations
Our study had several limitations. First, a major challenge was the availability and variability of the absenteeism data provided by each school district. No standardized system for K-12 schools exists to report absenteeism data, which can delay the collection and reporting of student absences. Second, no nationally standardized definitions for reasons for absence exist, leading to variability in how “absent” is defined. As a result, we observed some inconsistencies in data entry or recording. Third, variability in community illness data reflects the real-world conditions our study aimed to evaluate. While some jurisdictions exhibited clearer seasonal patterns than others, this variability highlights the inherent challenges and complexities of using absenteeism data as a surveillance tool in diverse, real-world settings. These issues need to be addressed if school absenteeism is to be routinely used as a warning system for increases in influenza and other respiratory illnesses.
Fourth, influenza case records were based on the reporting date rather than the date of symptom onset. As such, cases reported in a given week may reflect infections acquired during previous weeks. Moreover, laboratory-confirmed case data may underreport influenza because many cases are not tested. Fifth, using percentage ILI cases, which can capture other respiratory illnesses with symptoms such as fever, cough, or sore throat, may artificially inflate influenza incidence. Using daily reports of absences and influenza cases might increase the calculated correlations. However, local public health units report cases of influenza, ILI, and COVID-19 on a weekly basis (eTable 2 in Supplemental Material). Increasing such reporting to a daily basis would require additional resources that districts are unlikely to receive.
Finally, the size of school districts and the percentage of county residents enrolled in them may affect the correlation between absenteeism and community levels of illnesses. Three of the 4 participating districts are located in large urban areas (Central California; Dane County, Wisconsin; and Washoe County, Nevada), and the percentage of county residents enrolled in these districts varied. For example, School District A in Central California accounted for 7.3% of its county population; the Madison Metropolitan School District, 4.7%; and the Washoe County School District, 13.7%. This issue was particularly notable in the Arizona analysis, where the school district had 6451 enrolled students in 10 schools in a county with >1 million residents. Future analyses should aim to include districts from other locations with more diverse student populations to assess whether the associations hold across various settings.
Public Health Implications
The correlations and predictive values between school absenteeism (all causes) and community levels of influenza (or ILI) and COVID-19 were variable and often <0.5, suggesting limitations in using all-cause school absences as a form of syndromic surveillance.
Timely, high-quality data enable public health professionals to identify and respond to emerging health trends effectively. Following the COVID-19 pandemic, experts have advocated for enhancements to surveillance systems. 29 To make school absenteeism a more reliable tool for syndromic surveillance, the value of standardizing definitions, collecting disease-specific reasons for absences, improving data quality, and reporting timeliness should be explored.
Supplemental Material
sj-docx-1-phr-10.1177_00333549251365174 – Supplemental material for Evaluation of Kindergarten Through Grade 12 All-Cause Absenteeism Data as an Indicator and Predictor of Respiratory Disease, 2018-2022
Supplemental material, sj-docx-1-phr-10.1177_00333549251365174 for Evaluation of Kindergarten Through Grade 12 All-Cause Absenteeism Data as an Indicator and Predictor of Respiratory Disease, 2018-2022 by Zachary W. Oberholtzer, Seonghye Jeon, Lillian Fineman, Susan N. Hocevar Adkins, Gloria J. Kang, Kristi Imberi-Olivares, Lisa C. Barrios and Martin I. Meltzer in Public Health Reports®
Footnotes
Acknowledgements
The authors thank the staff of the following school districts for their kind cooperation, without which this study could not have been done: Sahuarita Unified, Pima County, Arizona; California School District A in Central California; Washoe County School District, Washoe County, Nevada; and Madison Metropolitan School District, Dane County, Wisconsin. We also thank Emily Holman, MSc, Division of HIV Prevention, Centers for Disease Control and Prevention, for data collection and verification.
Authors’ Note
Zachary W. Oberholtzer and Seonghye Jeon contributed equally to this work as co–first authors.
Declaration of Conflicting Interests
The authors declared no potential conflicts of interest with respect to the research, authorship, and/or publication of this article.
Funding
The authors received no financial support for the research, authorship, and/or publication of this article.
Disclaimer
The findings and conclusions in this article are those of the authors and do not necessarily represent the official position of the Centers for Disease Control and Prevention.
Supplemental Material
Supplemental material for this article is available online. The authors have provided these supplemental materials to give readers additional information about their work. These materials have not been edited or formatted by Public Health Reports’s scientific editors and, thus, may not conform to the guidelines of the AMA Manual of Style, 11th Edition.
References
Supplementary Material
Please find the following supplemental material available below.
For Open Access articles published under a Creative Commons License, all supplemental material carries the same license as the article it is associated with.
For non-Open Access articles published, all supplemental material carries a non-exclusive license, and permission requests for re-use of supplemental material or any part of supplemental material shall be sent directly to the copyright owner as specified in the copyright notice associated with the article.