
Abstract
Highlights
As the COVID-19 pandemic threatened lives worldwide, the Northern Hemisphere braced for a potential “twindemic” of seasonal influenza and COVID-19.
Using a validated mathematical model of influenza and SARS-CoV-2 co-circulation in a large US city, we projected the impact of COVID-19–driven nonpharmaceutical interventions combined with influenza vaccination on health care capacity during the 2020–2021 respiratory virus season.
We describe analyses conducted during summer 2020 to help US cities prepare for the 2020–2021 influenza season and provide a retrospective evaluation of the initial projections.
This is a visual representation of the abstract.
Introduction
By September 2020, the COVID-19 pandemic had surpassed 6 million confirmed cases and 240,000 deaths in the United States. The potential emergence of seasonal influenza in the Northern Hemisphere risked overwhelming already strained health care systems, particularly if influenza immunization rates were low. Data from the Southern Hemisphere 1 during the 2019–2020 influenza season 2 suggested that COVID-19 mitigation efforts could suppress the spread of influenza. However, the United States had the highest reported case counts of any country worldwide in the fall of 2020, and many policy makers seemed unwilling to sustain strict nonpharmaceutical interventions (NPIs) throughout the winter respiratory virus season. 3 To support public health and health care resource planning in the Austin–Round Rock metropolitan area for the 2020–2021 influenza season, we used a data-driven model of the co-circulation of influenza and SARS-CoV-2 to project the combined health care burden under different levels of NPIs and influenza immunization rates.
Methods
Epidemic Model
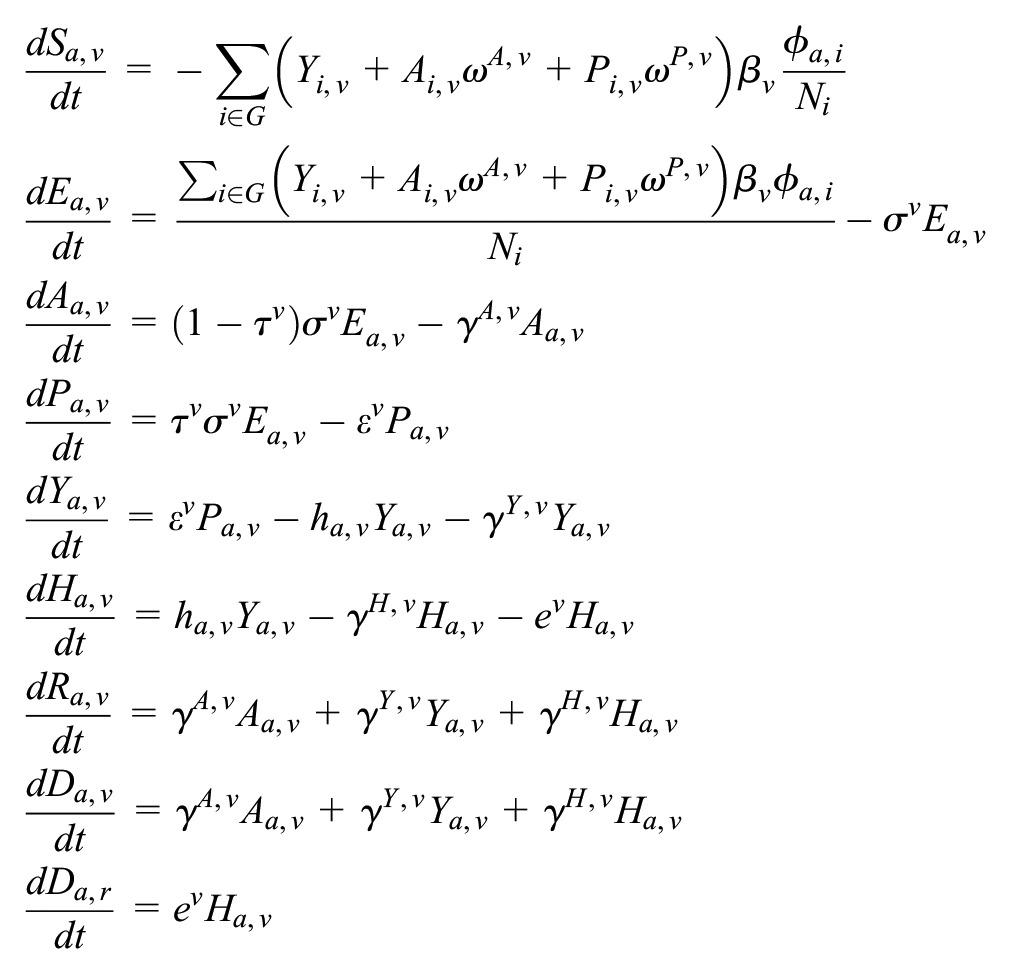
The structure of the deterministic susceptible-exposed-infected-recovered compartmental model of SARS-CoV-2 and influenza co-circulation is given in Supplementary Figure S4 and described in the equations below.
For each of the 5 age groups, we build a separate set of compartments to model the transitions between the states for each disease: susceptible (S), exposed (E), asymptomatic (A), presymptomatic (P), symptomatic (Y), symptomatic infectious that are hospitalized (H), recovered (R), and deceased (D). The symbols S, E, A, P, Y, H, R, and D denote the number of people in that state in the given age group. We denote COVID-19 and influenza as c and f in subscripts, respectively. The model for individuals in age group a and virus v (either influenza or COVID-19) is given by
where G are the 5 age groups;
Parameter values are provided in Supplementary Tables S1 and S3. For each transmission scenario (low, medium, and high), we selected an empirically derived basic reproduction number (R0) and used the next-generation matrix approach to solve for the corresponding transmission rate. 4 Simulations were initiated assuming 94% and 65% of all age groups are susceptible to COVID-19 and influenza, respectively, based on the estimated cumulative SARS-CoV-2 infections in the Austin area through September 1, 2020, 5 and the median susceptibility rate of influenza seasons from 2004 to 2013. 6
Let
Vaccination Coverage Estimation
The daily age-specific vaccination rates are based on monthly influenza vaccine coverage data reported by the Centers for Disease Control and Prevention (CDC) for the state of Texas over recent influenza seasons from 2014 to 2018.
7
To determine daily vaccine coverage, we fit a log-logistic curve for each of the following age groups (6 mo to 4 y, 5–17 y, 18–49 y, 50–64 y, and 65+ y).
8
The log-logistic curves are of the form
Scenarios
Based on consensus among local health system leaders, we assumed an intensive care unit (ICU) bed capacity of 155. 9 Extending prior policy analyses 10 for Travis County, which contains most of Austin, Texas, we model 9 main scenarios: all combinations of 3 different nonpharmacologic mitigation scenarios (affecting both viruses equally) and 3 different influenza vaccination rates. We assumed transmission levels previously recorded from the Austin region in 2020: low (late May, after the relaxation of stay-home orders), medium (mid June, summer wave), and high (early March, prior to all measures; Supplementary Table S1). Finally, based on historic influenza efficacy and coverage trends, we assumed that starting September 1, a 45% efficacious influenza vaccine was rolled out by age group proportional to historical trends (Supplementary Figure S7), scaled to achieve 0%, 30%, or 60% coverage (Supplementary Table S2).
Results
In August 2020, we projected that COVID-19 would dwarf seasonal influenza, in terms of incidence, ICU demand, and mortality, under all transmission and influenza vaccination strategies (Figure 1). The level of NPI implementation would significantly affect the expected strain on health care systems. ICUs would be expected to be overwhelmed by COVID-19 patients in all but the lowest transmission scenarios. Even high levels of influenza vaccination would not ensure sufficient capacity under those scenarios (Supplementary Figure S1). Under the highest transmission (low mitigation) scenario, achieving high influenza vaccination coverage (60%) relative to low coverage (30%) was expected to reduce influenza-related illness, hospitalizations, ICU cases, and deaths by 17%, 18%, 18%, and 22%, respectively (Figure 1; Supplementary Figures S1–S3).

Projected COVID-19 and influenza burden under various scenarios for community mitigation and influenza vaccination coverage in Austin, Texas, from September 1, 2020, through June 30, 2021. (A–I) Incidence of symptomatic infection. Using a deterministic model of the co-circulation of influenza and SARS-CoV-2 in Austin with the parameters given in Supplementary Tables S1 and S3, we consider 3 transmission scenarios: high (A–C), medium (E–F), and low (G–I), and 3 levels of influenza vaccination coverage: 0% (A, D, G), 30% (B, E, H) to 60% (D, F, I). The stacked curves indicate the combined daily incidence of symptomatic COVID-19 (orange) and influenza (blue) cases. Supplementary Figures S1 and S2 and Table S2 provide the estimated COVID-19 and influenza mortality and hospitalizations for the 9 scenarios. (J) Peak number of COVID-19 and influenza patients requiring intensive care unit (ICU) care. The dotted black line indicates the COVID-19 ICU capacity estimated for Austin of 155 patients, 9 and the dotted blue line indicates the observed peak number of COVID-19 ICU patients of 114, which occurred on January 13, 2021, in the studied period. (K) Cumulative COVID-19 and influenza deaths during the projected period. The dotted blue line indicates the observed mortality of 496 COVID-19 deaths during September 2020 to June 2021, denoting 39.72 per 100,000. 11
To assess the accuracy of our projections from the fall of 2020, we retrospectively compared them to influenza and SARS-CoV-2 surveillance data from September 1, 2020, to June 30, 2021. We estimate that the COVID-19 prevalence was slightly above the projections under our low-transmission (high-mitigation) scenario 12 and that the COVID-19 ICU census peaked just below the regional surge capacity (Figure 1J). As expected, the influenza burden was minimal. 13 Influenza immunization reached an estimated 53% in the United States, 14 and influenza-like illness (ILI) activity remained below 2% between September and April, compared with peak ILI activities of 17%, 8%, and 12% during the 2017–2018, 2018–2019, and 2019–2020 influenza seasons, respectively. As of April 17, 2021, there were only 152 positive influenza infections and 2 adult deaths in Travis county, in line with our predictions between the low- and medium-transmission scenarios.
Discussion
In preparation for the 2020–2021 influenza season, we projected that COVID-19 would likely strain health care systems and that extensive nonpharmacologic measures would be required to prevent overwhelming ICU surges. In communities that succeeded in suppressing transmission,1,2 we predicted that influenza vaccination would only slightly affect the overall burden of viral illness. In retrospect, we found that the 2020–2021 respiratory virus season resembled our projections under the lowest-transmission scenario. Relatively strong nonpharmacologic measures slowed the transmission of SARS-CoV-2 and almost completely suppressed influenza in Austin. Such measures, coupled with temporary expansion of health care capacity, prevented catastrophic health care system failures in the city.
Although we focused our estimates on Austin, Texas, we expect our findings to apply broadly to other US cities. While COVID-19 cases, hospitalizations, and mortality reached all-time peaks during the winter of 2020–2021, influenza prevalence remained low across the country: ILI percentage remained well below the CDC’s seasonal influenza threshold of 2% across the country compared with peaks of 7%, 5%, and 7.5% from the previous 3 seasons. 15
As caveats, we note that not all COVID-19 community mitigation measures will equally suppress influenza. In particular, social distancing, face mask requirements, and restrictions on businesses or schools may affect both viruses, whereas proactive testing for COVID-19 to safeguard schools, workplaces, and other public venues would not. In addition, we assumed there would be no cross-immunity between the viruses. 16 Such competitive interactions might reduce the burden or slow the transmission of 1 or both viruses. COVID-19 transmission dynamics will also depend on population-wide immunity accumulated through the initial months of the pandemic. Regions such as New York City, where a quarter of the population may have been infected by September 2020, 17 were expected to experience smaller or slower COVID-19 epidemics in the winter of 2020–2021 than regions with lower levels of population immunity. Finally, policy and behavioral responses throughout the COVID-19 pandemic may affect the severity of the 2021–2022 influenza season. Low levels of naturally acquired influenza immunity from the 2020–2021 influenza season combined with relaxation of COVID-19 NPIs may increase influenza transmission risks. However, these excess risks may be counteracted by an increased individual willingness to mitigate transmission through vaccination, social distancing, mask wearing, and voluntary self-isolation. Our analysis was limited to the 2020–2021 influenza season in the United States. We did not project the health burden of influenza and COVID-19 after June 2021. The emergence of the Delta variant and increasing COVID vaccination in 2021 will require additional modeling work to make similar projections for the 2021–2022 season and beyond.
Conclusion
We predicted and then retrospectively observed that COVID-19 control measures would suppress influenza transmission during the winter of 2020–2021 and that efforts to increase influenza vaccination uptake would have minimal impact on preserving health care capacity and preventing mortality. However, the future co-circulation of SARS-CoV-2 and influenza viruses may pose catastrophic threats to health care systems. Aggressive influenza and SARS-CoV-2 vaccine campaigns are expected to significantly prevent morbidity and mortality in communities where NPIs are no longer widely enforced.
Supplemental Material
sj-docx-1-mpp-10.1177_23814683221084631 – Supplemental material for Projecting the Combined Health Care Burden of Seasonal Influenza and COVID-19 in the 2020–2021 Season
Supplemental material, sj-docx-1-mpp-10.1177_23814683221084631 for Projecting the Combined Health Care Burden of Seasonal Influenza and COVID-19 in the 2020–2021 Season by Zhanwei Du, Spencer J. Fox, Tanvi Ingle, Michael P. Pignone and Lauren Ancel Meyers in MDM Policy & Practice
Footnotes
Acknowledgements
The authors acknowledge the Texas Advanced Computing Center (TACC) at The University of Texas at Austin for providing high performance computing (HPC), visualization, database, and grid resources that have contributed to the research results reported within this article (![]() ). The funders had no role in the design and conduct of the study; collection, management, analysis, or interpretation of the data; preparation, review, or approval of the manuscript; or decision to submit the manuscript for publication.
). The funders had no role in the design and conduct of the study; collection, management, analysis, or interpretation of the data; preparation, review, or approval of the manuscript; or decision to submit the manuscript for publication.
The authors declared no potential conflicts of interest with respect to the research, authorship, and/or publication of this article.
The authors disclosed receipt of the following financial support for the research, authorship, and/or publication of this article: This work was supported by grant U01IP001136 from the Centers for Disease Control, grant NIH R01 AI151176 from the National Institutes of Health, and the Society for Medical Decision Making (SMDM) COVID-19 Decision Modeling Initiative (UTA20-000825).
References
Supplementary Material
Please find the following supplemental material available below.
For Open Access articles published under a Creative Commons License, all supplemental material carries the same license as the article it is associated with.
For non-Open Access articles published, all supplemental material carries a non-exclusive license, and permission requests for re-use of supplemental material or any part of supplemental material shall be sent directly to the copyright owner as specified in the copyright notice associated with the article.