
Abstract
Objectives:
Although outbreaks of restaurant-associated foodborne illness occur periodically and make the news, a restaurant may not be aware of the cost of an outbreak. We estimated this cost under varying circumstances.
Methods:
We developed a computational simulation model; scenarios varied outbreak size (5 to 250 people affected), pathogen (n = 15), type of dining establishment (fast food, fast casual, casual dining, and fine dining), lost revenue (ie, meals lost per illness), cost of lawsuits and legal fees, fines, and insurance premium increases.
Results:
We estimated that the cost of a single foodborne illness outbreak ranged from $3968 to $1.9 million for a fast-food restaurant, $6330 to $2.1 million for a fast-casual restaurant, $8030 to $2.2 million for a casual-dining restaurant, and $8273 to $2.6 million for a fine-dining restaurant, varying from a 5-person outbreak, with no lost revenue, lawsuits, legal fees, or fines, to a 250-person outbreak, with high lost revenue (100 meals lost per illness), and a high amount of lawsuits and legal fees ($1 656 569) and fines ($100 000). This cost amounts to 10% to 5790% of a restaurant’s annual marketing costs and 0.3% to 101% of annual profits and revenue. The biggest cost drivers were lawsuits and legal fees, outbreak size, and lost revenue. Pathogen type affected the cost by a maximum of $337 000, the difference between a Bacillus cereus outbreak (least costly) and a listeria outbreak (most costly).
Conclusions:
The cost of a single foodborne illness outbreak to a restaurant can be substantial and outweigh the typical costs of prevention and control measures. Our study can help decision makers determine investment and motivate research for infection-control measures in restaurant settings.
Restaurants in the United States comprise a multibillion-dollar industry ($780 billion in 2016, composing 4% of the gross domestic product). The National Restaurant Association estimated that in 2016, 47% of every dollar spent on food was spent in a restaurant, and in 2015, the average American ate out approximately 5 times per week. 1,2 From 1998 through 2013, restaurants played a role in 9788 (56%) of the 17 445 foodborne illness outbreak events reported; this number translates to approximately 620 restaurant-associated outbreaks and 3000 to 11 500 illnesses annually. 3 A total of 742 foodborne illness outbreaks with a single location of food preparation occurred in 2014, 485 (65%) of which were linked to restaurants. 4 Although restaurant-associated foodborne illness outbreaks periodically appear in the news media, 5 individual restaurants might not always be aware of how much they could cost. We posited that a better understanding of the economic burden of a foodborne illness outbreak (in the event that one occurs) could help restaurants determine how much they could potentially invest in outbreak prevention and control; however, the economic value (eg, cost benefit, cost effectiveness) of these interventions would depend on the risk occurrence.
Previous economic studies have focused on reporting aggregate annual costs of foodborne illnesses to individuals or society. 6 -9 Many were limited to health-related costs of foodborne illnesses and varied in component costs. 10 One restaurant-related study reported on the costs of an outbreak that occurred in the early 1970s, 11 and another reported only the legal expenses for an outbreak that occurred in 1978. 12 However, to our knowledge, no study has yet captured the full economic costs to a US restaurant. The objective of our study was to provide cost estimates of a foodborne illness outbreak to a US restaurant.
Methods
Using Microsoft Excel with a Crystal Ball add-in, 13 we developed a computational Monte Carlo simulation model to represent a single outbreak of a particular pathogen originating from a single restaurant to determine the cost of a foodborne illness outbreak to a restaurant under varying circumstances. We estimated costs of the 15 foodborne pathogens that caused outbreaks in a restaurant during a 6-year period (2010-2015), as reported by the Centers for Disease Control and Prevention (CDC). 14 Our first step was to define the number of people affected (ie, who developed symptoms) by the outbreak (ie, outbreak size) and the pathogen (Bacillus cereus, campylobacter, Clostridium perfringens, cyclospora, Escherichia coli, Giardia, hepatitis A, listeria, norovirus, salmonella, sapovirus, Shigella sonnei, Staphylococcus aureus, trichinella, or Vibro parahaemolyticus). Each person affected then had a probability of being a restaurant employee, and each restaurant employee had probabilities of seeking ambulatory care (eg, outpatient setting or emergency department), being hospitalized, and dying. The probabilities of hospitalization and mortality varied by pathogen type, and each illness and hospitalization was associated with a pathogen-specific duration.
We assigned productivity losses caused by absenteeism by counting each day of work that symptomatic restaurant employees missed because of illness and hospitalization. We used daily wages as a proxy for productivity losses. 15 We assumed all sick employees accrued losses for the duration of illness, except for hepatitis A, which has a long symptomatic duration; therefore, we applied the number of missed employment days reported in the scientific literature. Productivity losses for premature death resulted in the net present value of missed earnings for the duration of their remaining employment at the restaurant based on the annual wage and remaining years of employment at one place. 15,16
We considered outbreaks in 4 types of restaurants: fast food (quick service, specific menu, and offers minimal to no table service), fast casual (specific menu between fast food and casual dining and offers minimal table service), casual dining (broad menu and offers table service), and fine dining (dedicated meal courses and offers full table service). We assumed that each restaurant incurred reinspection fees as a result of the outbreak. Although inspection fees typically depend on the restaurant size and number of seats, we applied one flat fee regardless of size or type. We also included increases to a restaurant’s insurance premium. Because a restaurant’s insurance premium depends on the restaurant’s size and location, we varied insurance increases and applied them to the annual insurance premium for general liability insurance. 17 We assumed that other parts of the insurance policy (eg, property insurance) would not be affected.
We assumed that each restaurant would incur costs to retrain staff members. This retraining included the training program cost and 8 hours of productivity losses for each staff member. Employee wages varied by type of employee, and the number of employees varied by restaurant type. We assumed that each outbreak was associated with a loss in restaurant revenue because of decreased meal sales. Because this loss of revenue can be difficult to determine and highly variable, we used the number of meals as a proxy. For each person affected (ie, total number of illnesses in the outbreak), we assumed that a specified number of decreased meals were sold (ie, meals lost). We determined total lost meal sales to the restaurant by estimating the number of meals lost per illness multiplied by the outbreak size and by the average cost per meal by restaurant type. Thus, a restaurant’s lost revenue depended on the restaurant type and outbreak size.
We conducted scenarios that varied the cost of lawsuits, legal fees, and fines paid by a restaurant, because they varied widely and data were limited. The amount of lawsuits and legal fees came from the amount compensated for consumer plaintiffs in the 26 foodborne illness lawsuits decided by jury verdicts reported from 2010 through 2014. These cases were identified through 2 jury verdict and settlement databases and included foodborne illness cases that were legally resolved through the court system. 18 Given that the variability of these awards, which ranged from $9856 to $1 428 971 in 2012 dollars, and the likelihood that a restaurant will incur these costs is unknown, we conducted extensive sensitivity analyses on this parameter (described hereinafter). Similarly, the amount and likelihood of incurring fines is variable and not well described; thus, we based estimates for this cost range on past fines reported in news articles. 19,20
Data Inputs
Model inputs (Table 1) used pathogen-specific data when these data were available and came from nationally representative data sources (eg, wages from the US Bureau of Labor Statistics, 15 duration of hospitalization from the Healthcare Cost and Utilization Project). 45,46 We derived pathogen-specific probabilities for hospitalization and mortality by using CDC data on the number of illnesses, hospitalizations, and deaths from foodborne illness outbreaks occurring in a restaurant. 14 By limiting the CDC data to outbreaks occurring only in restaurants, we excluded more vulnerable or specialized populations (eg, nursing home residents), which may have more severe outcomes that require the use of additional health care resources; outbreak investigations typically generate these data and endeavor to capture data on all health care use. Restaurant type-specific inputs, such as cost per meal and number of employees, came from survey and industry data and from the National Restaurant Association. 21,22,45,47,48 A 3% discount rate adjusted all past and future costs to 2017 US dollars (Table 1).
Computational simulation model input parameters, values, and sources used to estimate the cost of a foodborne illness outbreak to a single US restaurant
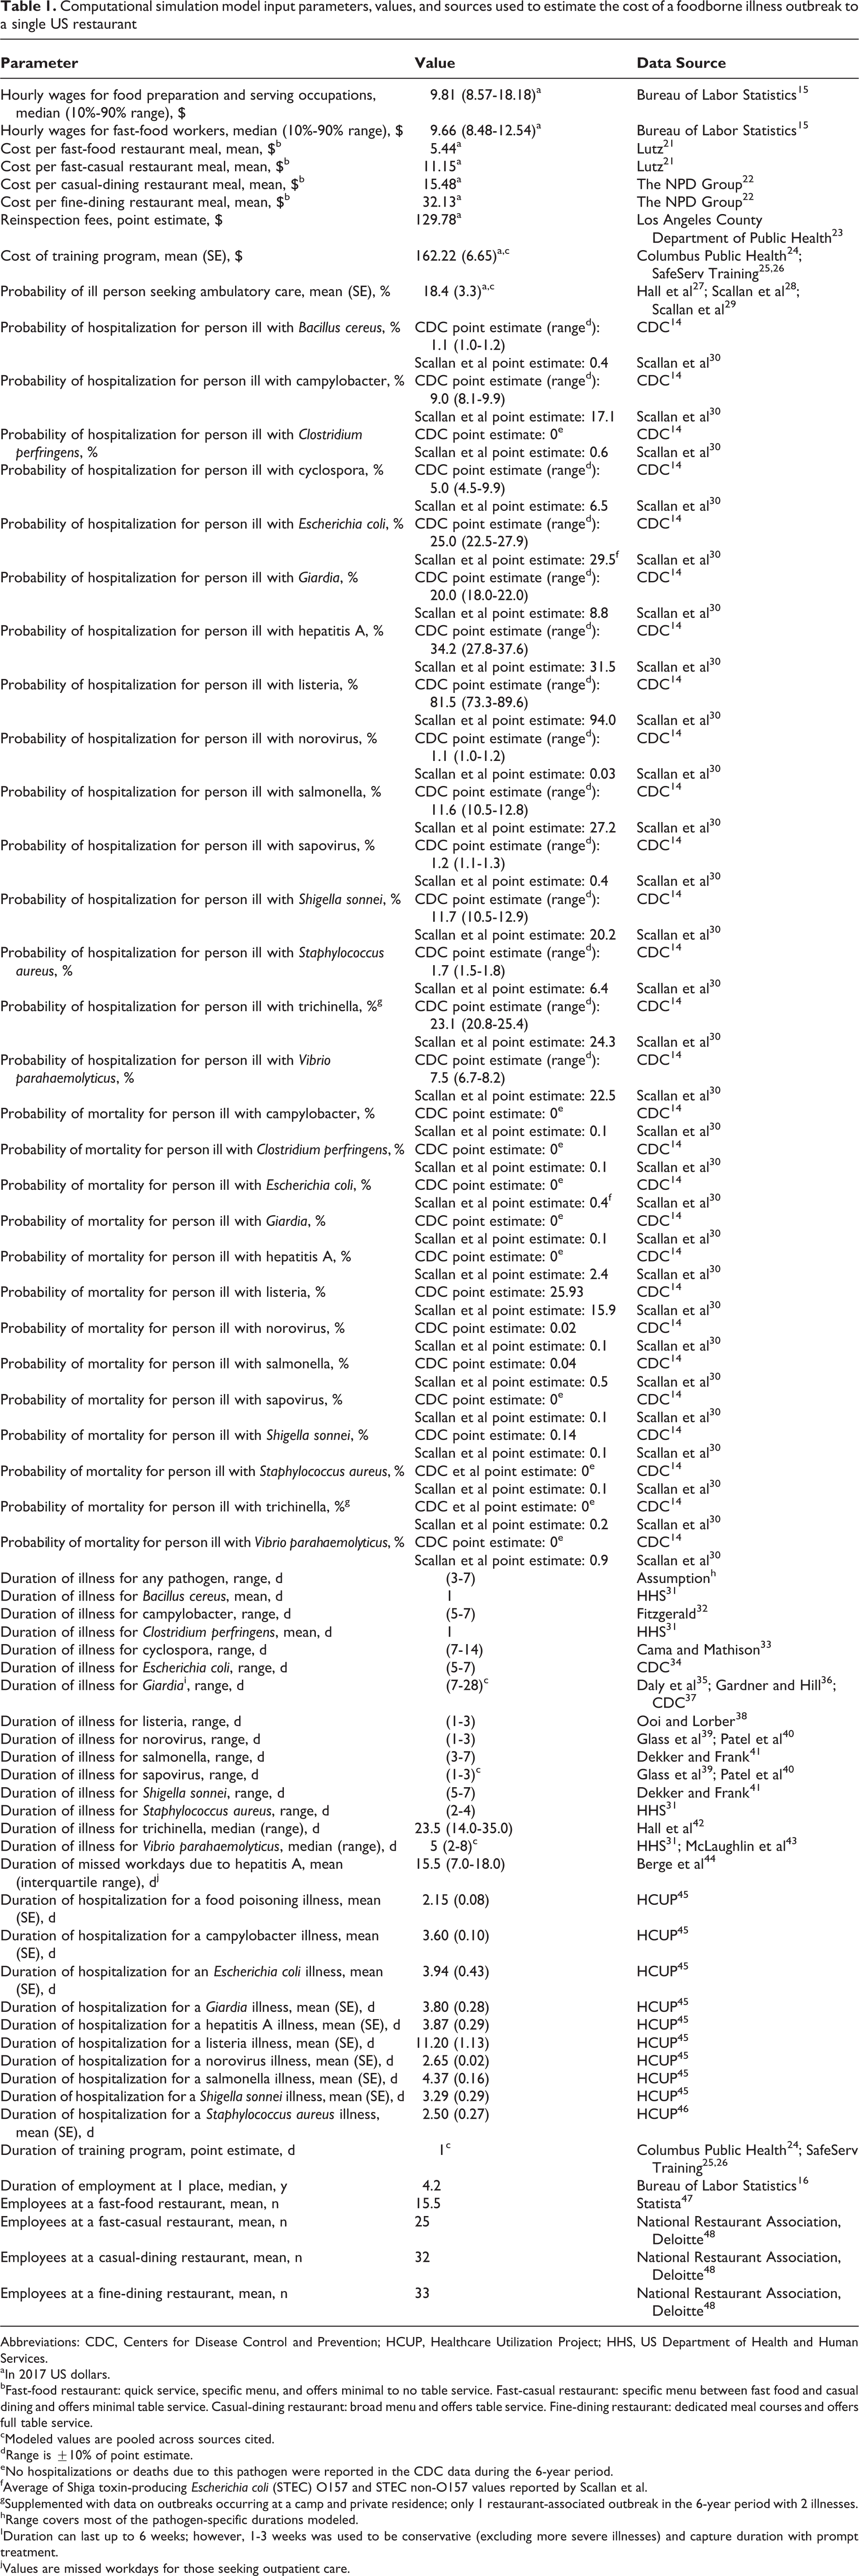
Abbreviations: CDC, Centers for Disease Control and Prevention; HCUP, Healthcare Utilization Project; HHS, US Department of Health and Human Services.
aIn 2017 US dollars.
bFast-food restaurant: quick service, specific menu, and offers minimal to no table service. Fast-casual restaurant: specific menu between fast food and casual dining and offers minimal table service. Casual-dining restaurant: broad menu and offers table service. Fine-dining restaurant: dedicated meal courses and offers full table service.
cModeled values are pooled across sources cited.
dRange is ±10% of point estimate.
eNo hospitalizations or deaths due to this pathogen were reported in the CDC data during the 6-year period.
fAverage of Shiga toxin-producing Escherichia coli (STEC) O157 and STEC non-O157 values reported by Scallan et al.
gSupplemented with data on outbreaks occurring at a camp and private residence; only 1 restaurant-associated outbreak in the 6-year period with 2 illnesses.
hRange covers most of the pathogen-specific durations modeled.
IDuration can last up to 6 weeks; however, 1-3 weeks was used to be conservative (excluding more severe illnesses) and capture duration with prompt treatment.
jValues are missed workdays for those seeking outpatient care.
Simulations and Sensitivity Analyses
Each Monte Carlo simulation consisted of 1000 trials that varied each parameter throughout its distribution (Table 1). For each pathogen and restaurant type, we used multiway sensitivity analyses to systematically vary the outbreak size (5-250 people affected) following reported outbreaks 14 ; the proportion of affected people who were employees (5%-90%); the number of meals lost per illness (0-100); lawsuits and legal fees (none [$0], minimum [$11 426], median [$85 690], and maximum [$1 656 569]); fines ($0-$100 000); and annual insurance rate increase (5%-75%) 49,50 that was applied to the annual insurance premium, which ranged from $545 to $6280. 17 This insurance increase was similar to past increases in health insurance and restaurant premiums. We also examined the impact of varying these key parameters on costs by restaurant type. Additional sensitivity analyses varied the pathogen-specific probabilities of hospitalization and mortality to those reported by Scallan et al. 30 We report results as median and 95% credibility intervals (CrIs).
Results
The estimated cost of a foodborne illness outbreak varied by outbreak conditions (Table 2). The cost of an outbreak for a fine-dining restaurant was higher than for a fast-food restaurant under the same conditions even when there was no loss in revenue (ie, 0 meals lost per illness; $8273 vs $3968). The cost per person was not constant across outbreaks of various sizes, because other costs (eg, reinspection fees and fines, which are relatively fixed) did not scale linearly with the outbreak size. For example, at a fine-dining restaurant, a 5-person outbreak cost $1655 per person, whereas a 250-person outbreak cost $52 per person, assuming the same conditions. The cost of an outbreak also varied by pathogen. The most expensive outbreaks were caused by listeria ($4768-$2 915 601), because it accrued the highest productivity losses resulting from its high probability of hospitalization and mortality. The least expensive outbreaks were caused by Bacillus cereus ($3891-$2 578 714), because it accrued the lowest productivity losses resulting from its short duration, low probability of hospitalization, and no association with mortality. Comparing the 2 most common causes of foodborne illness outbreaks, norovirus and salmonella, a single salmonella outbreak cost $63-$21 198 more than a norovirus outbreak under the same conditions because it accrues higher direct costs as a result of being associated with a higher probability of hospitalization (Table 3).
Median (95% CrI) cost (in 2017 US dollars) of restaurant-associated foodborne illness outbreaks from the restaurant perspective under various circumstances: results from a computational simulation modela
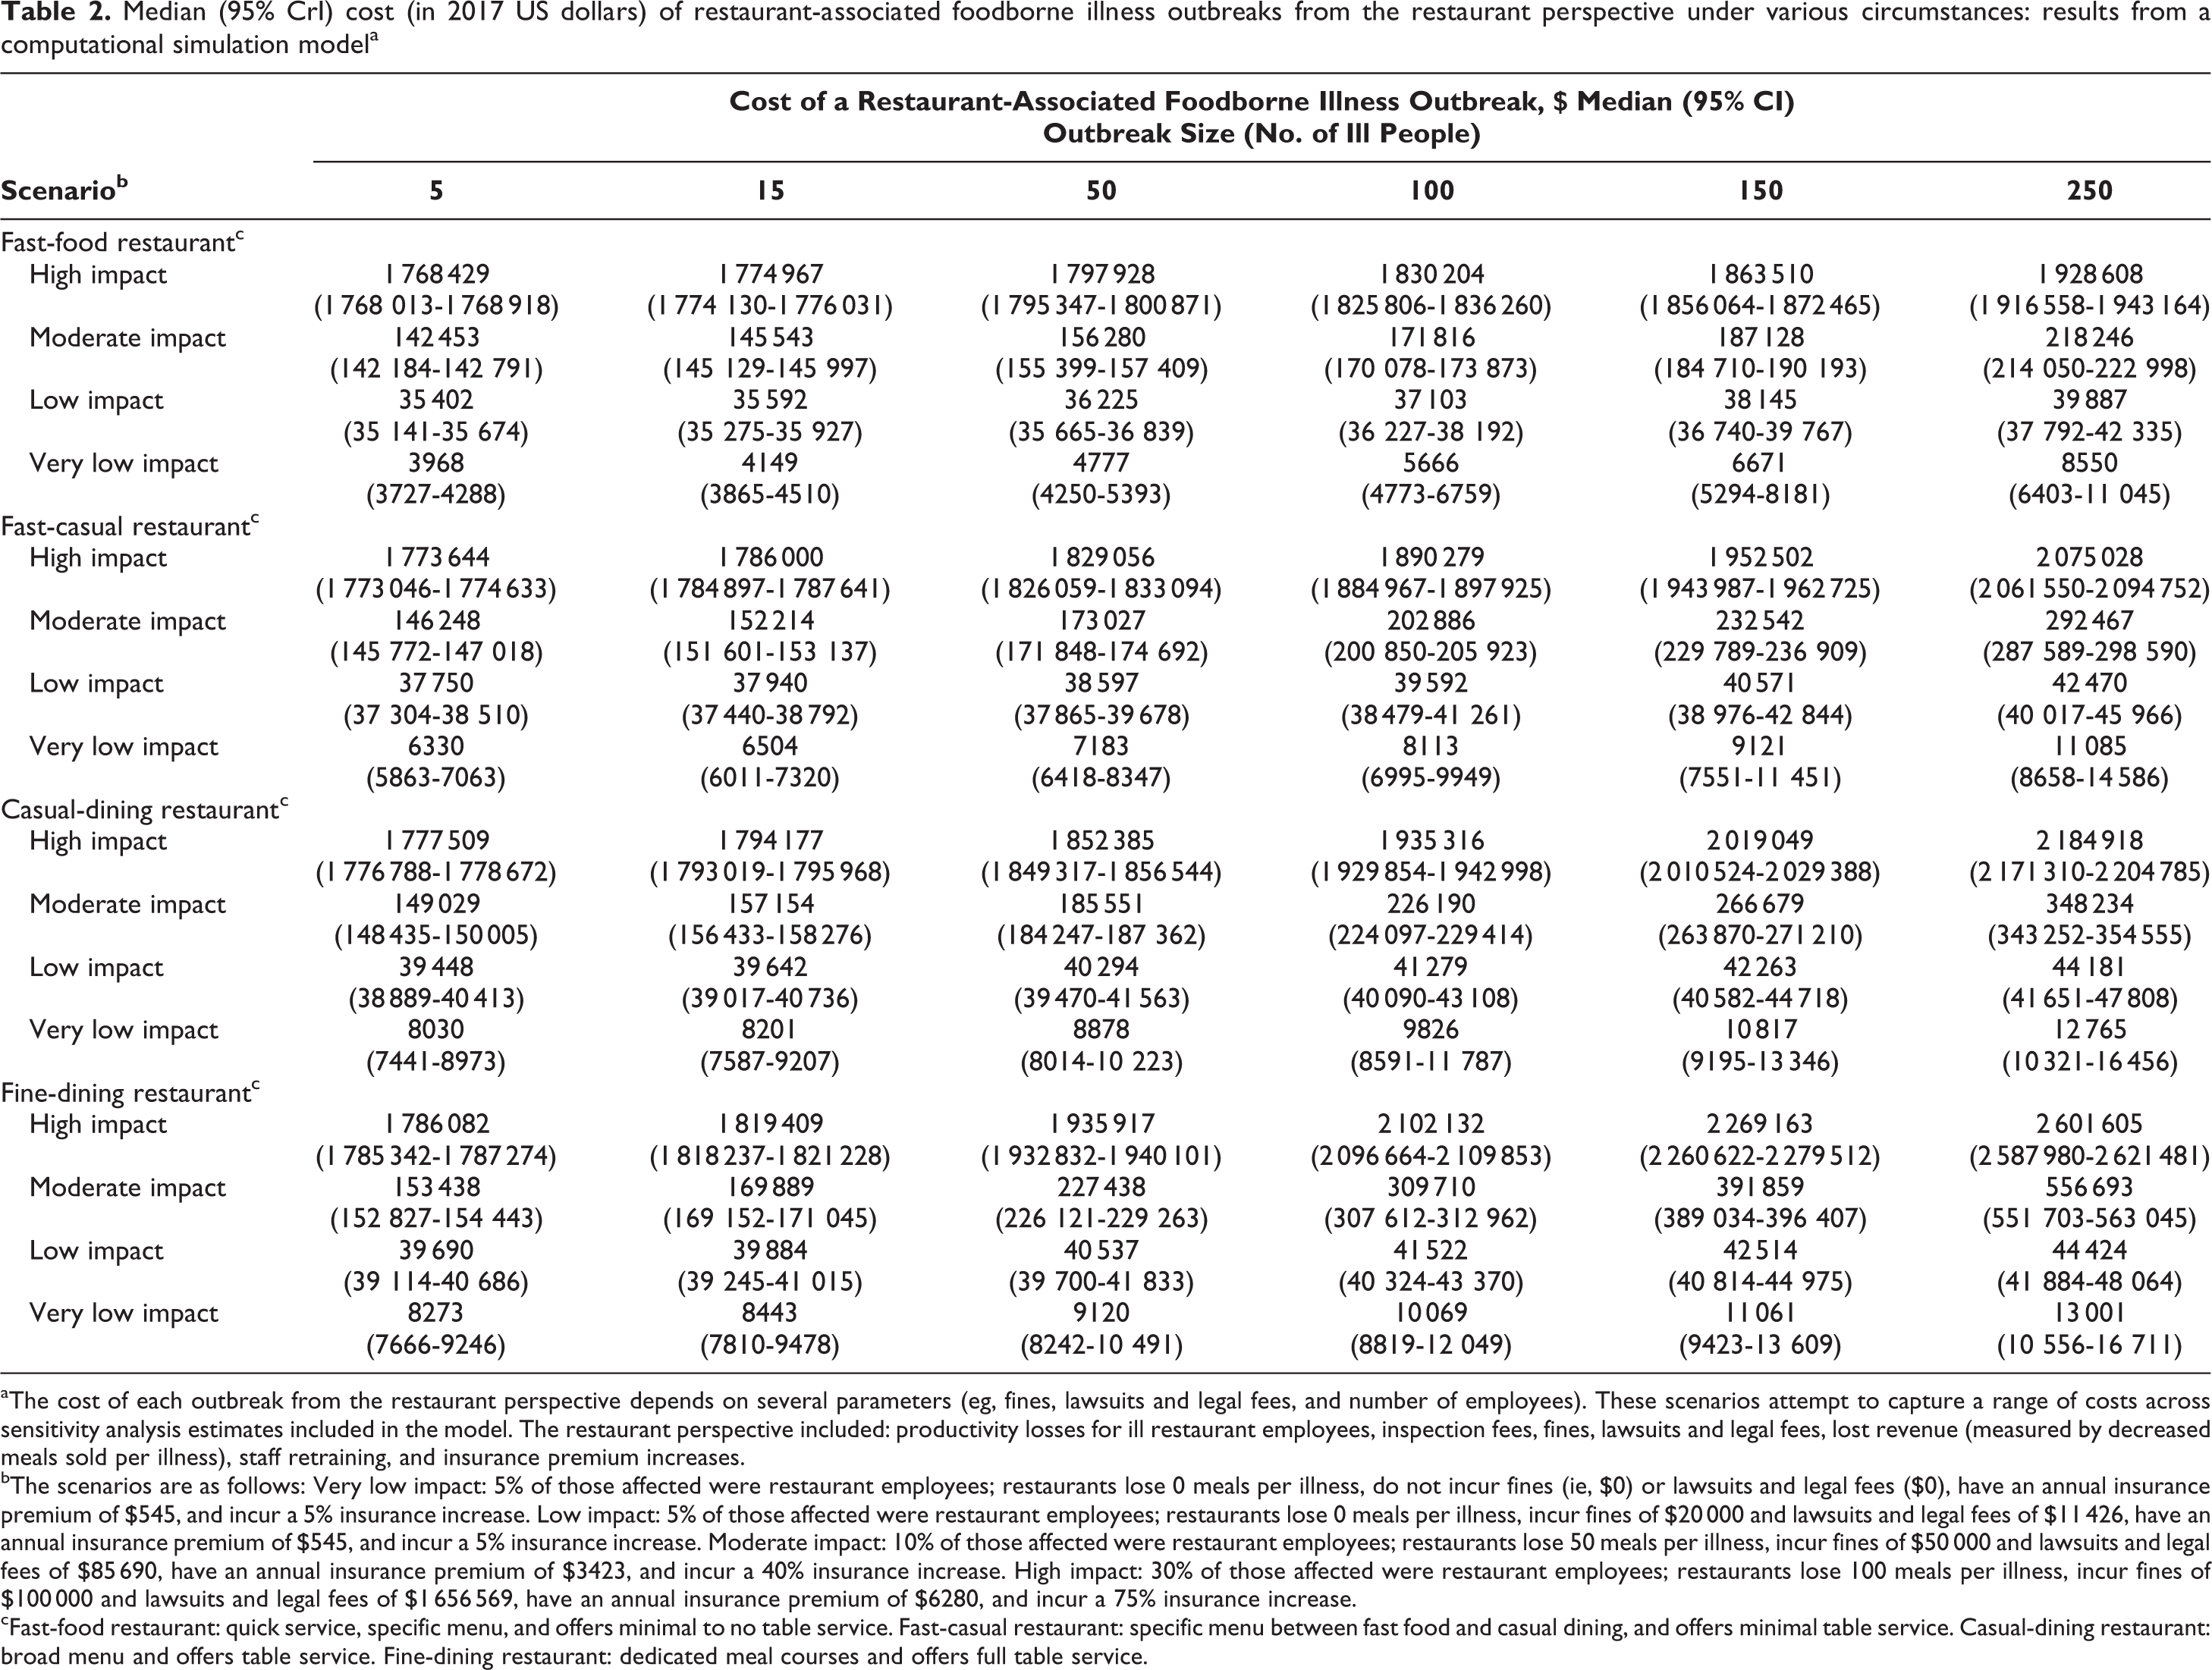
aThe cost of each outbreak from the restaurant perspective depends on several parameters (eg, fines, lawsuits and legal fees, and number of employees). These scenarios attempt to capture a range of costs across sensitivity analysis estimates included in the model. The restaurant perspective included: productivity losses for ill restaurant employees, inspection fees, fines, lawsuits and legal fees, lost revenue (measured by decreased meals sold per illness), staff retraining, and insurance premium increases.
bThe scenarios are as follows: Very low impact: 5% of those affected were restaurant employees; restaurants lose 0 meals per illness, do not incur fines (ie, $0) or lawsuits and legal fees ($0), have an annual insurance premium of $545, and incur a 5% insurance increase. Low impact: 5% of those affected were restaurant employees; restaurants lose 0 meals per illness, incur fines of $20 000 and lawsuits and legal fees of $11 426, have an annual insurance premium of $545, and incur a 5% insurance increase. Moderate impact: 10% of those affected were restaurant employees; restaurants lose 50 meals per illness, incur fines of $50 000 and lawsuits and legal fees of $85 690, have an annual insurance premium of $3423, and incur a 40% insurance increase. High impact: 30% of those affected were restaurant employees; restaurants lose 100 meals per illness, incur fines of $100 000 and lawsuits and legal fees of $1 656 569, have an annual insurance premium of $6280, and incur a 75% insurance increase.
cFast-food restaurant: quick service, specific menu, and offers minimal to no table service. Fast-casual restaurant: specific menu between fast food and casual dining, and offers minimal table service. Casual-dining restaurant: broad menu and offers table service. Fine-dining restaurant: dedicated meal courses and offers full table service.
Cost (in 2017 US dollars) of restaurant-associated foodborne illness outbreaks of 4 pathogensa from the restaurant perspective: results from a computational simulation model
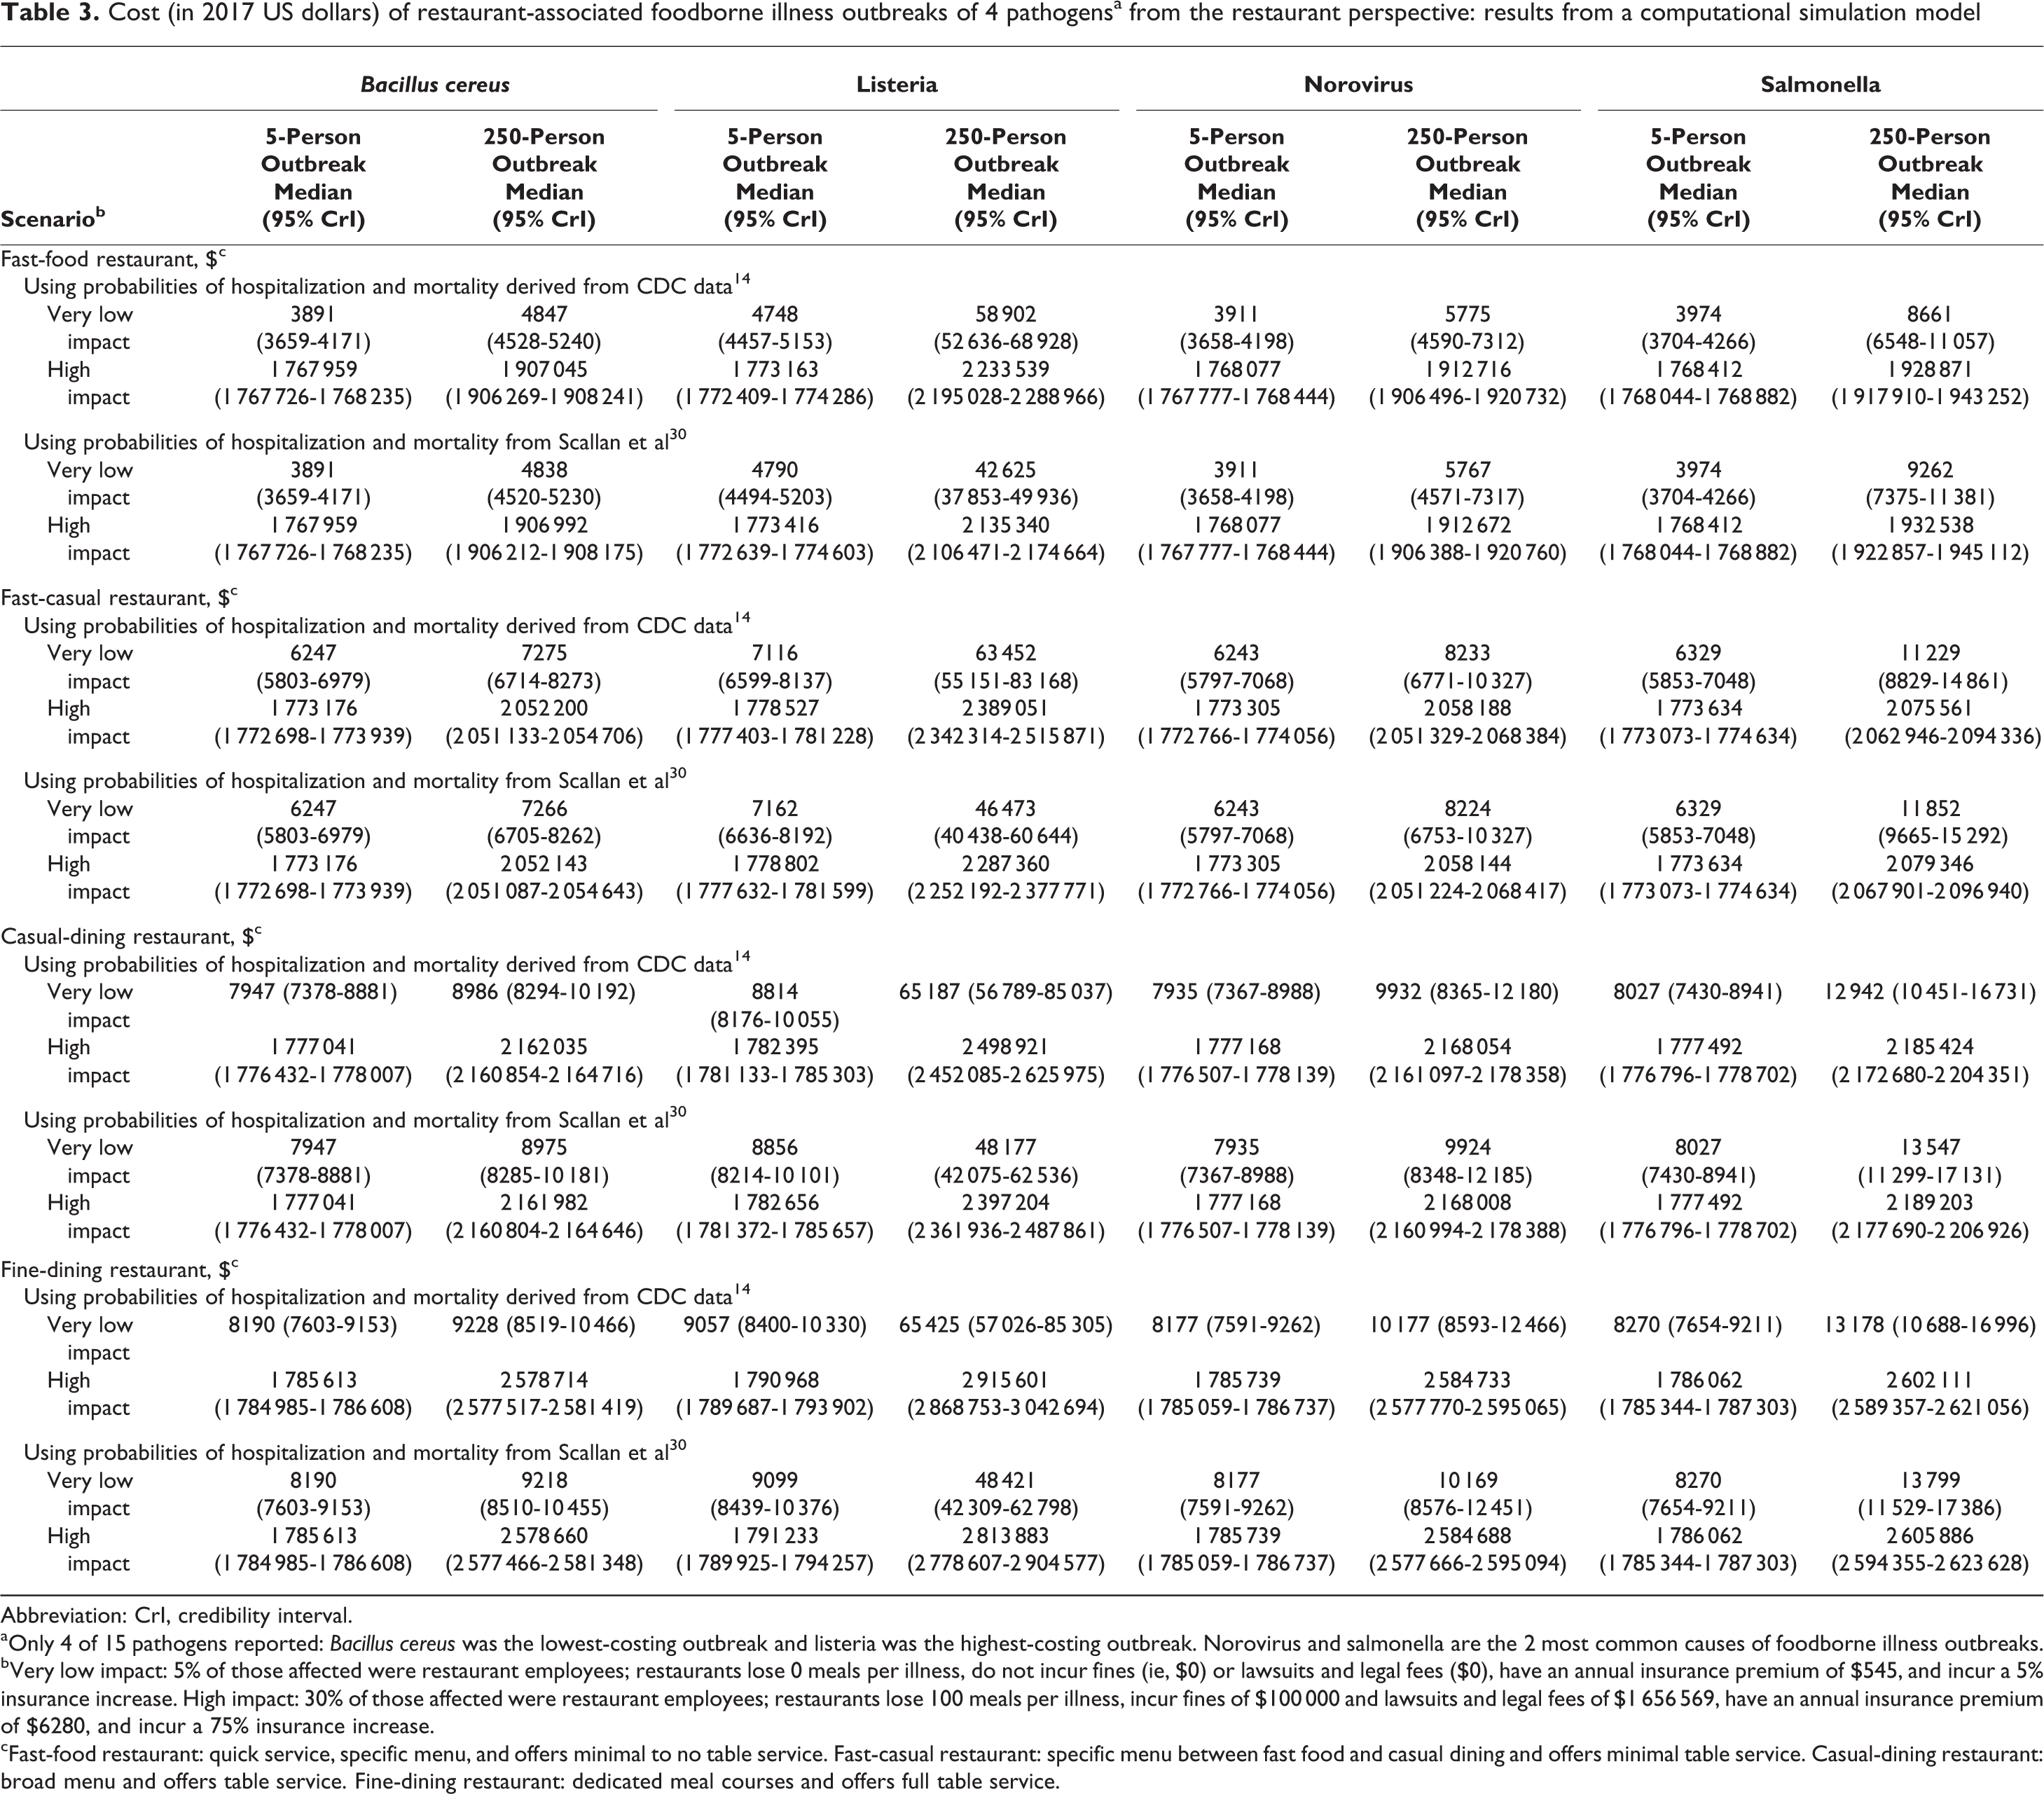
Abbreviation: CrI, credibility interval.
aOnly 4 of 15 pathogens reported: Bacillus cereus was the lowest-costing outbreak and listeria was the highest-costing outbreak. Norovirus and salmonella are the 2 most common causes of foodborne illness outbreaks.
bVery low impact: 5% of those affected were restaurant employees; restaurants lose 0 meals per illness, do not incur fines (ie, $0) or lawsuits and legal fees ($0), have an annual insurance premium of $545, and incur a 5% insurance increase. High impact: 30% of those affected were restaurant employees; restaurants lose 100 meals per illness, incur fines of $100 000 and lawsuits and legal fees of $1 656 569, have an annual insurance premium of $6280, and incur a 75% insurance increase.
cFast-food restaurant: quick service, specific menu, and offers minimal to no table service. Fast-casual restaurant: specific menu between fast food and casual dining and offers minimal table service. Casual-dining restaurant: broad menu and offers table service. Fine-dining restaurant: dedicated meal courses and offers full table service.
Changes in the total cost of an outbreak when varying the values of different parameters are shown in a tornado diagram (Figure 1). The diagram is shaped like the funnel cloud of a tornado: the parameter with the greatest impact is at the top, and the width of the bar represents the range of the resulting outbreak costs when that parameter increases or decreases. The cost of lawsuits and legal fees and the number of ill people in the outbreak were the biggest drivers of the outbreak cost. Lawsuits and legal fees had the largest impact on the overall cost of a foodborne illness outbreak, regardless of restaurant type. For example, the median cost of an outbreak at a fast-casual restaurant was $979 793 (95% CrI, $969 073-$994 842); attributing the highest lawsuits and legal fees (ie, $1 656 569) resulted in the outbreak costing a total of $1.81 million (95% CrI, $1.80 million-$1.82 million). Additionally, lawsuits and legal fees had an additive effect on the total outbreak cost. For example, to a fast-food restaurant, a 5-person foodborne illness outbreak with no lawsuits and legal fees cost an estimated $3868; with $500 in lawsuits and legal fees, it cost $4480; and with $100 000 in lawsuits and legal fees, it cost $103 987 (all other variables being equal).
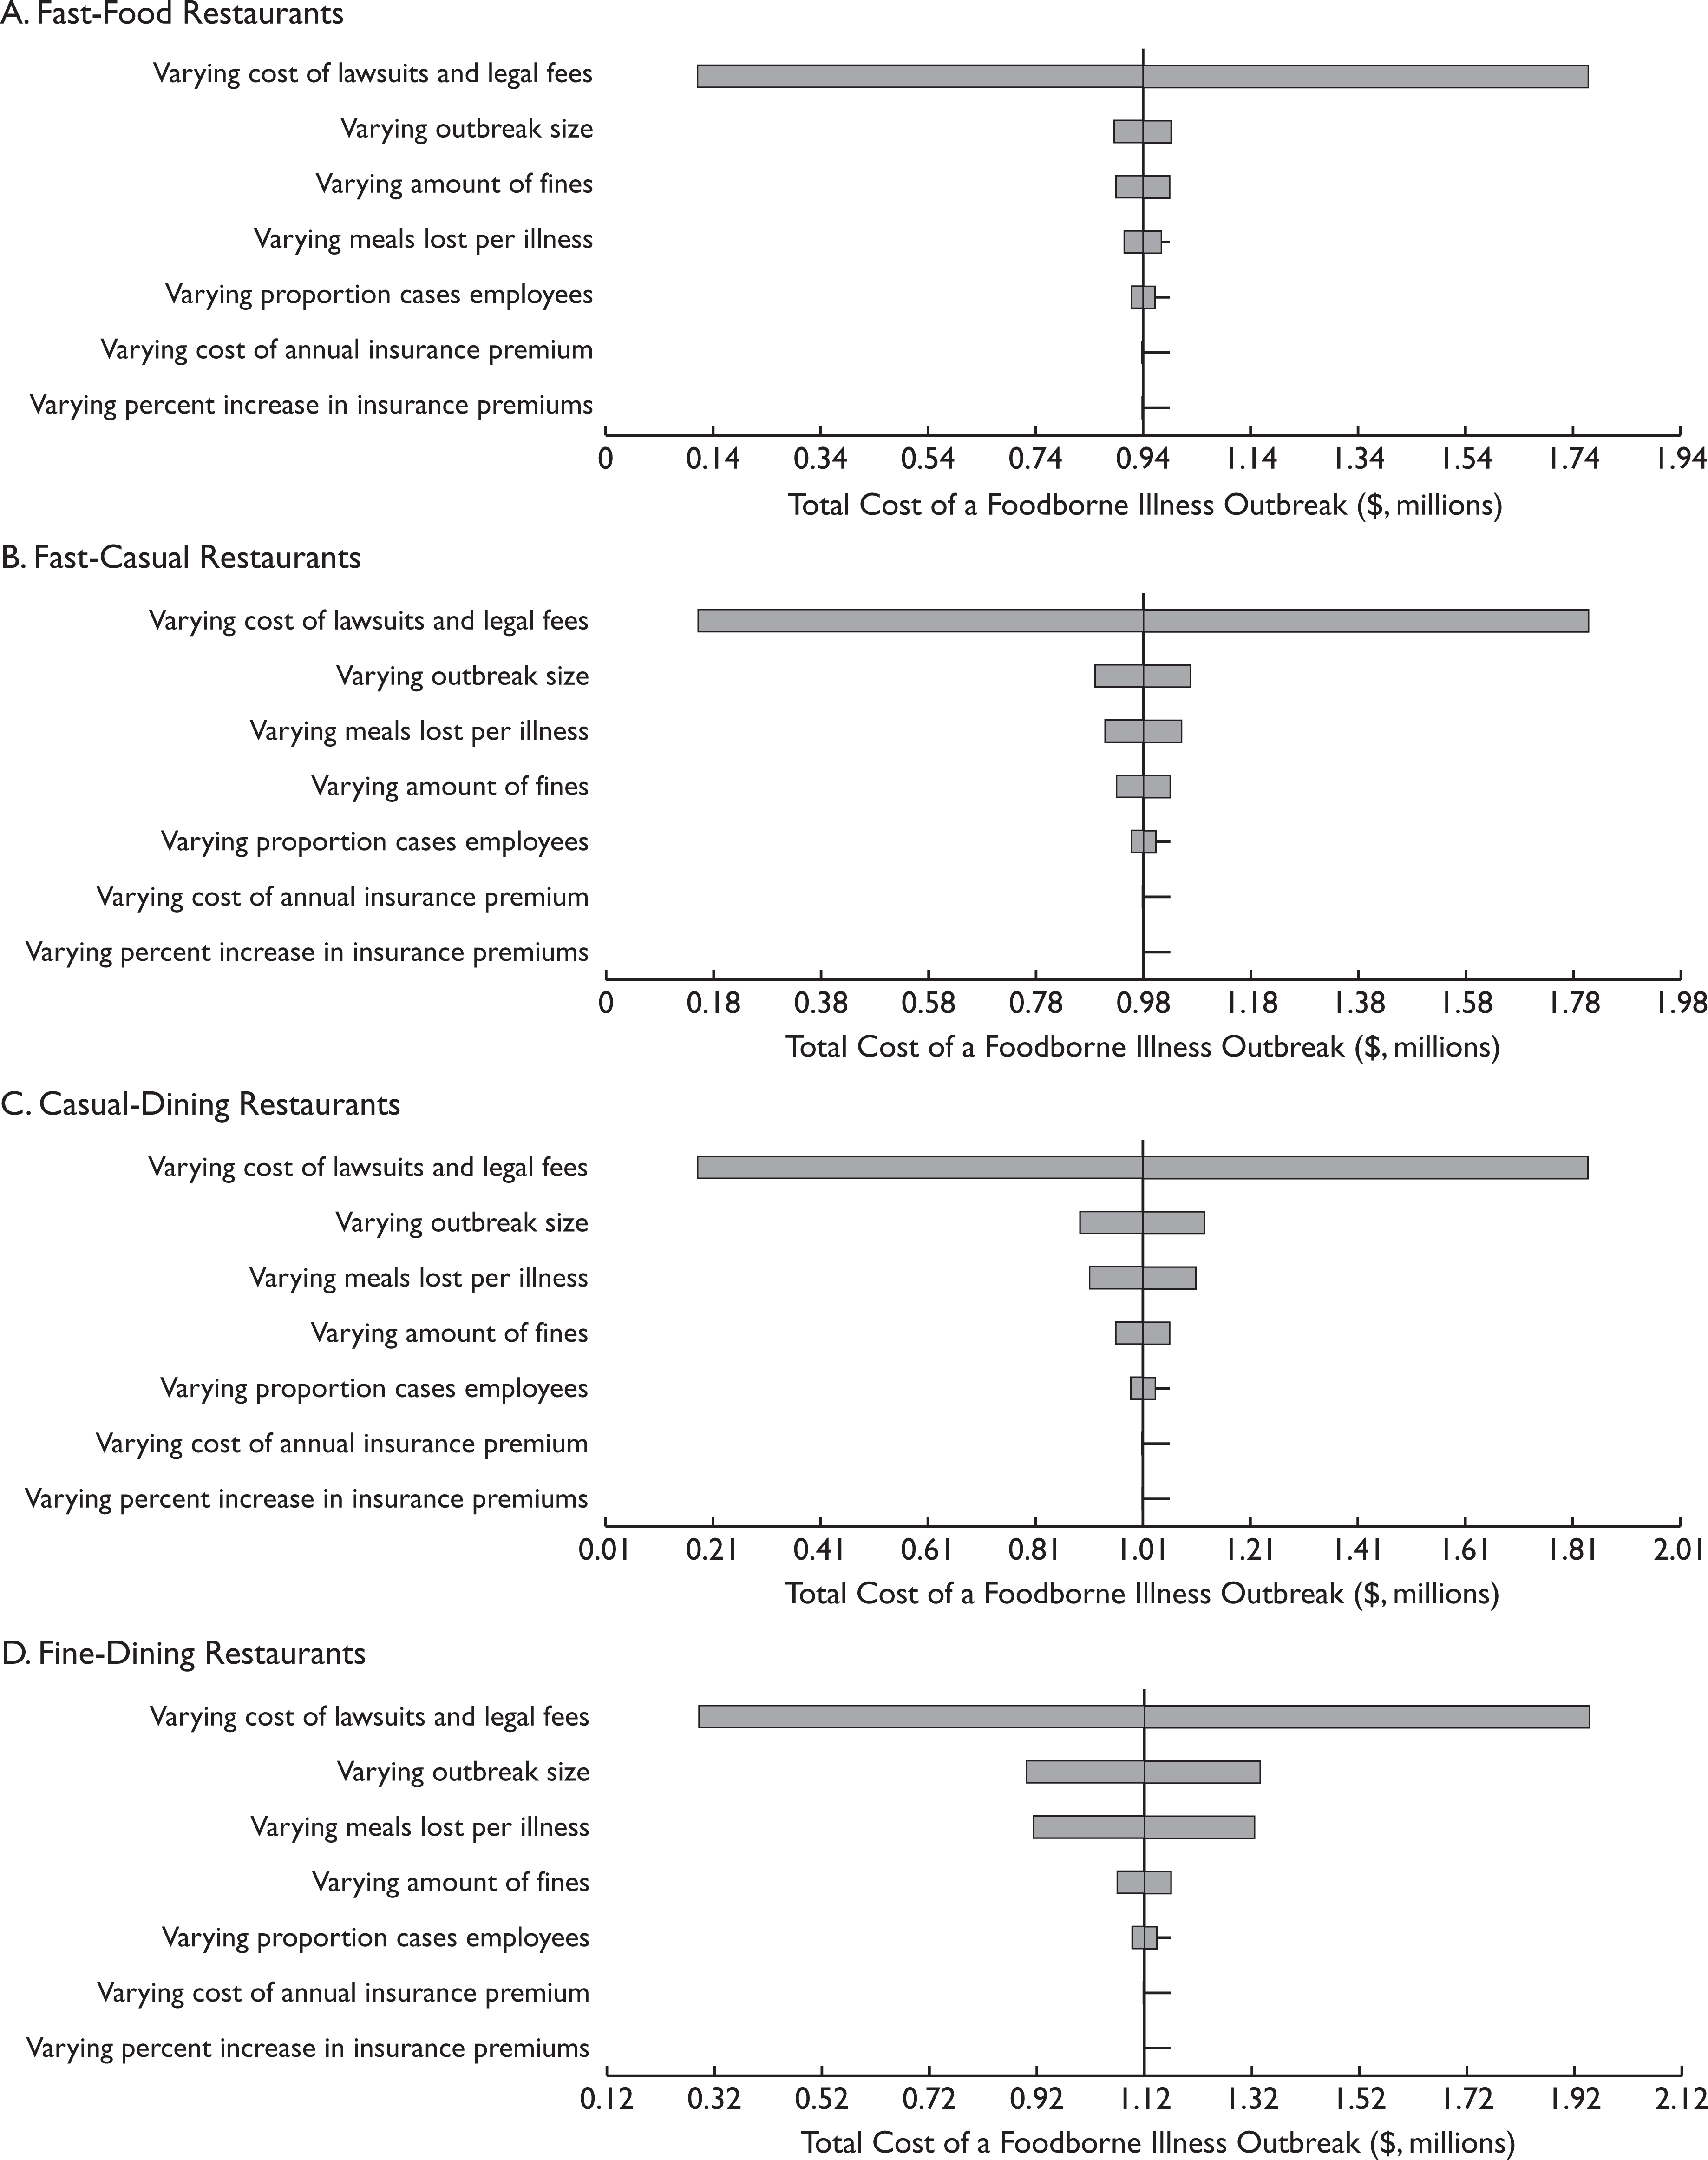
Impact of key parameters on the cost of restaurant-associated foodborne illness outbreaks from the restaurant perspective for (a) fast-food, (b) fast-casual, (c) casual-dining, and (d) fine-dining restaurants. The x-axis shows the total cost of an outbreak; the vertical line indicates the cost for which all variables on the y-axis are held at their midpoint values. The width of the bar shows the range of impact each parameter had when varied from its minimum value to its maximum value. Outbreak size (number of ill people) varied from 5 to 250; proportion of cases that are restaurant employees varied from 0% to 90%; meals lost per illness varied from 1 to 100; lawsuits and legal fees varied from $0 to $1 656 569; fines varied from $0 to $100 000; annual insurance premium varied from $545 to $6280; and increase in insurance premium varied from 5% to 75%. Fast-food restaurant: quick service, specific menu, and offers minimal to no table service. Fast-casual restaurant: specific menu between fast food and casual dining and offers minimal table service. Casual-dining restaurant: broad menu and offers table service. Fine-dining restaurant: dedicated meal courses and offers full table service.
Cost of an Outbreak in a Fast-Food Restaurant
The total cost of a foodborne illness outbreak to a fast-food restaurant varied by pathogen; however, the total cost of an outbreak did not vary by more than 16% (ie, ≤$326 494) across all pathogens, outbreak sizes, and probabilities of hospitalization and mortality. The maximum difference was between a single outbreak of Bacillus cereus ($2.2 million) and a single outbreak of listeria ($2.5 million) under the high-impact scenario (Table 3). Fines had the third-largest impact of all key parameters explored via sensitivity analysis on total outbreak costs (Figure 1a); however, this parameter only increased or decreased the total cost by approximately $50 000. The marginal increase in cost for an additional person affected varied by the number of meals lost per illness, ranging from $68 (10 meals lost per illness) to $330 (50 meals lost per illness). For every 10 additional meals lost per illness, the total cost increased by a marginal $262 to $285 for a 5-person outbreak and $13 348 to $13 839 for a 250-person outbreak.
Cost of an Outbreak in a Fast-Casual Restaurant
Although the total cost of a foodborne illness outbreak to a single fast-casual restaurant varied by pathogen, the total cost did not vary by more than 15% (≤$336 852) across all pathogens, outbreak sizes, and probabilities of hospitalization and mortality (Table 3). Following lawsuits and legal fees and outbreak size, the number of meals lost per illness had the next largest impact on total outbreak costs (Figure 1b), increasing or decreasing total costs by $70 000. Total outbreak costs increased by a marginal $83 to $642 per additional illness (assuming 10-50 meals lost per illness) and varied by meals lost per illness. For every 10 additional meals lost per illness, total costs increased by a marginal $539 (5-person outbreak) to $27 914 (250-person outbreak).
Cost of an Outbreak in a Casual-Dining Restaurant
Although the total cost of a single outbreak varied by pathogen, it did not vary by more than 14% (ie, ≤$336 886) across all pathogens, outbreak sizes, and probabilities of hospitalization and mortality (Table 3). Increasing outbreak size by 1 illness (holding all else constant) increased the total costs by a marginal $132 to $845, varying with the number of meals lost per illness (10-50 meals). For every 10 additional meals lost per illness, total costs increased by a marginal $750 to $814 for a 5-person outbreak and a marginal $38 595 to $38 794 for a 250-person outbreak. Fines, the proportion of affected people who were employees, annual insurance premiums, and increases in insurance had relatively little impact on total costs (increasing or decreasing cost by $50 000) (Figure 1c).
Cost of an Outbreak in a Fine-Dining Restaurant
Across all pathogens, outbreak sizes, and probabilities of hospitalization and mortality, the total cost of a foodborne illness outbreak to a fine-dining restaurant did not vary by more than 12% (ie, ≤$336 888), which was the maximum difference between a single outbreak of Bacillus cereus and a single outbreak of listeria under the same conditions (Table 3). For each additional ill person, total costs to a fine-dining restaurant increased by a marginal $303 to $419 (with 10 meals lost per illness) and $1605 to $1681 (with 50 meals lost per illness), all else being equal. In addition, total costs increased by a marginal $1583 to $1647 for every 10 additional meals lost per illness for a 5-person outbreak and a marginal $80 212 to $80 430 for every 10 additional meals lost per illness for a 250-person outbreak.
Discussion
Our study aimed to fill a gap in the literature on the cost of foodborne illness outbreaks. Restaurants can use our results to help determine the potential economic burden of a single foodborne illness outbreak under various circumstances and what factors have the largest impact on these costs (ie, lawsuits and legal fees and outbreak size). By demonstrating how much a single outbreak might cost under varying circumstances, our study can help decision makers (eg, restaurant owners) determine how much they should consider investing in improving their infection-control measures. It may also motivate further research to identify effective strategies for preventing foodborne illness outbreaks in restaurant settings, because the potential cost savings of preventing an illness are not inconsequential. However, the potential economic value (eg, cost benefit and cost effectiveness) of such infection-control measures would depend on and increase with the likelihood that a restaurant has an outbreak.
To help benchmark this cost, a single foodborne illness outbreak might cost a fast-food restaurant 0.1 to 57.9 times the amount that the restaurant spent on marketing (approximately $33 000) in 1 year. 51,52 This cost shifts to 0.1 to 16.5 times (approximately $132 661 spent on marketing 53,54 ) for a casual-dining restaurant. To add perspective, a single outbreak could account for the annual wages of 2 to 127 restaurant staff members or could consume a substantial proportion of a single fast-food restaurant location’s annual profit. For example, a single 15-person foodborne illness outbreak could constitute 0.2% to 68.3% of a single fast-food restaurant’s average annual profit ($2.6 million 55 ), 0.3% to 72.3% of a fast-casual restaurant location’s average annual revenue ($2.47 million 56 ), and 0.5% to 101.1% of the $1.8 million average annual revenue of 1 franchise location among the top 100 independent restaurants in 2015. 57
Foodborne illness outbreaks may be avoided in some cases by infection prevention and control measures in restaurants, many of which may cost less than an outbreak itself. For example, giving a sick employee time off may cost $78 to $3451 depending on the length of the employee’s illness (1-42 days) and the person’s wages (assuming 8 hours of productivity losses per day), with most illnesses lasting less than 1 week. The examination associated with staff training can cost $162 plus 1 day of productivity losses that it consumes. 24 -26 A food-handler training program focusing on basic food safety, cross-contamination, time and temperature, and cleaning and sanitation costs $15 for an online course and assessment. 58 Surveillance testing of high-risk foods to identify potential contamination before reaching a restaurant costs $18 to $266 per test for in-house laboratories in the meat and poultry production industry. 59 The cost and availability of these options may vary by location and other circumstances. Although these costs may be lower than the costs of an outbreak, their economic value would depend on the risk of an outbreak occurring.
Although analyses at both the national level 60 and state level 61 have not found associations between routine health inspection scores and incidence of foodborne illness outbreaks, evidence shows that various contributing factors are associated with foodborne illness outbreaks at restaurants. Many factors and conditions in restaurants are known to contribute to foodborne illness outbreaks, such as unsanitary conditions, ill employees not given paid sick leave, suboptimal safe and proper food-handling practices, or inadequate cleaning practices. 62 Some associations between these factors and foodborne illness may be difficult to measure, because some behaviors (eg, employees working while ill) may not be well monitored or recorded. Nonetheless, outbreaks may be prevented through food safety precautions. For example, restaurants that have not had foodborne illness outbreaks were more likely than restaurants that have had an outbreak to have a certified kitchen manager, which was associated with less barehand contact with food. 63 These food-safety precautions and prevention and control measures aimed at reducing contributing factors and violations can be less costly than an outbreak itself.
The cost of an outbreak to a restaurant could exceed our estimates. Smaller establishments could lose even more customers after an outbreak because they do not have the marketing and damage-control mechanisms to recoup their image. Repeated outbreaks could have an additive effect on lost customers and even lead to closures of locations for periods of time. For example, in 2015, Chipotle Mexican Grill had several foodborne illness outbreaks (norovirus, E coli, and salmonella) beginning in July and continuing through November that resulted in numerous closures in several states, leading to considerable media coverage. 5 As a result, sales dropped 14.6% in the fourth quarter of 2015 alone compared with the same quarter the previous year. 64 An even more drastic example is the closure and bankruptcy of Chi-Chi’s restaurants in the United States after an outbreak of hepatitis A in 2003.
Limitations
This study was limited in that all models are simplifications of real life and, as such, cannot include every possible event or outcome. 65 We did not include some circumstances that may further increase costs, such as employees suffering severe illnesses and outcomes, which would result in larger productivity losses. We did not include any subsequent costs that restaurants may incur after an outbreak. For example, restaurants may need to invest in special campaigns (eg, advertisements and sales promotions) to regain consumer confidence, and staff turnover may result in training new hires.
Conclusions
Our study shows that a single foodborne illness outbreak can incur substantial costs, enough to compose a large portion of a restaurant’s annual profits. Many of these costs outweigh the costs of various infection prevention and control measures that are available to restaurants. To our knowledge, our study is the first to quantify these costs to a restaurant. Restaurant decision makers can consider these results when planning investments in appropriate policies and interventions to prevent foodborne illness outbreaks.
Footnotes
Declaration of Conflicting Interests
The authors declared no potential conflicts of interest with respect to the research, authorship, and/or publication of this article.
Funding
The authors disclosed receipt of the following financial support for the research, authorship, and/or publication of this article: This article was supported by the Agency for Healthcare Research and Quality via Grant No. R01HS023317, the Eunice Kennedy Shriver National Institute of Child Health and Human Development (NICHD) Office of Behavioral and Social Sciences Research and the Global Obesity Prevention Center via Grant No. U54HD070725, and the NICHD via Grant No. U01HD086861. The funders had no role in the design and conduct of the study; collection, management, analysis, and interpretation of the data; and preparation, review, or approval of the article.