
Abstract
Objectives:
We explored how restaurant inspection frequency and restaurant neighborhood sociodemographic characteristics are related to food safety inspection outcomes in chain and nonchain restaurants to better understand external factors that may influence inspection outcomes.
Methods:
We categorized the results of restaurant inspections in Philadelphia, Pennsylvania, in 2013 and 2014 by restaurant type (chain or nonchain), inspection frequency (1, 2, or ≥3 per 2-year study period), and violation type (total number of violations, foodborne-illness risk factor violation, or good retail practice violation). We collected 2013 US Census block group sociodemographic data for each restaurant neighborhood. We used nested mixed-effects regression analyses to determine the association between restaurant inspection frequency and inspection violations, as well as between inspection violations and restaurant neighborhood sociodemographic variables, stratified by restaurant type.
Results:
Compared with nonchain restaurants, chain restaurants had significantly fewer total violations per inspection (mean [SD]: 6.5 [4.6] vs 9.6 [6.8] violations, P < .001). For nonchain restaurants, an increase from 1 to 2 inspections resulted in 0.8 (P < .001) fewer mean violations per inspection, and an increase from 1 to ≥3 inspections resulted in 1.6 (P < .001) fewer mean violations; this association was not seen in chain restaurants. For nonchain restaurants, a higher proportion of black residents in a restaurant neighborhood was associated with 0.6 (P < .001) fewer mean foodborne-illness risk factor violations but 1.0 (P < .001) more mean good retail practice violations per inspection.
Conclusions:
A risk-based stratified approach to restaurant food safety inspection frequency, based on whether or not restaurants are part of chains, could reduce the frequency of violations, particularly in restaurants with the most violations.
Foodborne illnesses are a serious public health concern, with the annual burden estimated to be 48 million illnesses, 128 000 hospitalizations, and 3000 deaths in the United States in 2011. 1,2 In a study published in 2015, the estimated aggregated annual cost of foodborne illness to the US economy was $55.5 billion. 3 Although foodborne illnesses can be caused by food cooked in or outside the home, two-thirds of foodborne illness outbreaks occur in restaurant settings. 4 This finding raises even more concern in the United States, where the proportion of meals eaten outside the home has been increasing: 43.7% of food budgets in 2014 were spent in restaurants, and >$738 billion was spent in 2015 on food consumed outside the home. 5,6 In a 2013 report, consumption of food prepared outside the home was listed as 1 of the 5 primary factors contributing to foodborne illness. 7
Restaurant safety monitoring has traditionally been handled by municipal inspection officials in accordance with the recommendations of the US Food and Drug Administration (FDA) Food Code, which lists 5 major areas that inspectors should cover during routine inspections. 8 The FDA Food Code recommends inspecting full-service restaurants 3 times per year. However, cities are not required to follow these recommendations and may instead establish independent, more lenient inspection protocols.
Although the FDA suggests that inspection scores are a proxy measure for restaurant food safety, research has not demonstrated a relationship between restaurant inspection scores and the burden of foodborne illness. Some studies have found a relationship between inspection scores and rates of foodborne illness, whereas others have not. 1,9 –11 This discrepancy may be caused in part by the challenges of studying the epidemiology of foodborne illnesses, which include difficulty determining the location of the foodborne illness exposure and underreporting of subclinical cases of foodborne illness. 4,7
The discrepancy in study findings about the relationship between restaurant inspection scores and foodborne illness rates could also be related to socioeconomic disparities that may exist for foodborne illness rates and local restaurant food safety practices. For example, some studies have reported more restaurant violations in areas of high poverty, whereas other studies have observed fewer violations in these areas. 12 Also, people with higher incomes may be more likely than those with lower incomes to handle raw meat and have discretionary income to spend on restaurants. 12,13 However, residents in areas of lower socioeconomic status may have less access to supermarkets and more access to fast-food chain and takeout restaurants than those living in areas of higher socioeconomic status. 14 –17 Yet, the importance of many of these socioeconomic differences is not well understood. For example, the relationship between foodborne illness and access to supermarkets and fast-food restaurants is unclear. Additionally, although reliance on restaurant food instead of food obtained from supermarkets may decrease the risk of foodborne illness, results of research on this topic are mixed. Finally, although differences in foodborne illness rates for different socioeconomic groups have been reported, these differences may reflect differences between better-educated diners and less-well-educated diners in rates of illness reporting (likely because of differences in treatment-seeking behavior) as well as differences in access to health care according to a neighborhood’s socioeconomic status. 12,18
The relationship between restaurant inspection scores and rates of foodborne illness may also be influenced by the types of food and preparation methods used in restaurants. Chain restaurants typically serve food that is less perishable and requires less preparation than food in nonchain restaurants. As a result, chain restaurants have generally had lower rates of foodborne illnesses and fewer inspection violations than nonchain restaurants. In contrast, full-service nonchain restaurants have had higher rates of foodborne illnesses as compared with chain restaurants, likely because they use more raw ingredients and complex food preparation. 1,4,19 Consistent oversight and standardized food preparation protocols may also contribute to better inspection scores in chain restaurants than in nonchain restaurants. Consequently, nonchain restaurants may benefit from the use of data on inspection outcomes in chain restaurants as benchmarks for comparison, particularly when trying to assess the impact of other environmental and socioeconomic factors on their food safety practices and outcomes.
The objective of this study was to explore how restaurant inspection frequency and restaurant neighborhood sociodemographic characteristics are related to restaurant food safety inspection outcomes in chain and nonchain restaurants. We hypothesized that restaurant inspection frequency and restaurant neighborhood sociodemographic characteristics would be more strongly associated with inspection outcomes in nonchain restaurants than in chain restaurants.
Methods
Data Sources
We obtained restaurant names, locations, and inspection results from the Clean Plates database, compiled by the Philadelphia Inquirer and available to the public. 20 This database contains aggregated data that are automatically updated from the online website of the Philadelphia Department of Public Health, which conducts all restaurant safety inspections in Philadelphia, Pennsylvania. The Philadelphia Department of Public Health uses a modified inspection protocol based on FDA recommendations, and it aims to conduct routine inspections of all restaurants within the city limits once per year.
We collected Philadelphia restaurant inspection data reported from January 2013 through December 2014. These data included details on inspections (date, time, purpose, type, inspector name), restaurants (name, license number, location, name of person in charge), and violations (number and type of violations). The Clean Plates database includes tabulated reports of 2 types of violations: foodborne-illness risk factors and good retail practices. Foodborne-illness risk factor violations are practices or procedures that, scientists say, play a direct role in transmitting germs, and they include food kept at improper temperatures and failure to properly clean equipment used to prepare food. Good retail practice violations, which are considered to be less critical violations, are deficiencies in practices or procedures that, research suggests, can prevent the conditions that lead to contamination but do not cause illness directly, such as dirty floors or improper garbage storage. We received these data from the Philadelphia Inquirer in a comma-separated values file. 21
We filtered the data set in several ways. We included only routine annual inspections and excluded inspections that were compliance checks, reinspections, environmental assessments, or responses to complaints. We limited the type of facilities to eat-in or takeout restaurants; thus, we excluded retail food establishments, daycare facilities, schools, residential facilities, and caterers. We also excluded restaurants within the Philadelphia International Airport because they are not located within the boundaries of the city of Philadelphia and therefore could not be matched with our sociodemographic data. We also excluded some variables in the data set (eg, name of the inspector, person in charge of the restaurant) because they were not pertinent or were difficult to analyze quantitatively.
We divided restaurants into 2 types: chain and nonchain. We defined chain restaurants as those with at least 15 locations worldwide, and we determined which restaurants fit into this category by manually searching Internet-based sources, such as restaurant websites. We categorized restaurant inspection frequency as 1, 2, or ≥3 inspections during the 2-year study period. Restaurants rarely received >3 inspections during this period.
We accessed 2013 US Census American Community Survey block group data to collect sociodemographic information related to the location of each restaurant in our study. 22 The restaurant inspection database included latitude and longitude coordinates for each restaurant, which we used to locate the restaurants on 2013 US Census maps of Philadelphia. In the US Census, block groups are contiguous areas of land that are divisions of a census tract and typically contain 600 to 3000 residents. Block groups are the smallest geographical unit with census sociodemographic data available and were considered most representative of the area surrounding each restaurant. By merging the restaurant geographic data with the census block group data, we were able to obtain restaurant neighborhood data on our variables of interest, including total population count, median age of residents, proportion of college-educated residents, median annual household income, proportion of black residents, proportion of Hispanic residents, and proportion of residents living in poverty. We merged geographic data using ArcGIS release 10.2. 23
Statistical Methods
We summarized continuous variables using means and standard deviations (SDs), and we compared restaurant types (chain vs nonchain) using t tests. We summarized categorical variables using frequencies and percentages, and we compared groups using Pearson χ2 tests. We analyzed the number of violations (total and by type) reported for each restaurant inspection conducted during the study period. Because multiple inspections could occur in a single restaurant or in a single geographic block group, we adjusted for multiple instances of the same restaurant and block group.
We used a nested model to adjust for random effects of multiple data points within the same restaurant and block group. We used mixed-effects linear regression to determine the relationships between the frequency of inspections at each restaurant during the 2-year period and the number of inspection violations found at each restaurant, stratified by restaurant type (chain or nonchain). We adjusted the model for block group sociodemographic characteristics, including total population count, proportion of unemployed residents, proportion of college-educated residents, median annual household income, proportion of black residents, proportion of Hispanic residents, and proportion of residents living in poverty. We coded the inspection frequency category as a factor variable to assess the relationship between inspection frequency and number of violations per inspection.
We also used nested mixed-effects logistic regression to assess the relationships between number of violations per inspection and block group sociodemographic characteristics, adjusted for all block group sociodemographic characteristics. We assessed these relationships among all restaurants; then, we compared chain restaurant relationship results with nonchain restaurant relationship results. We used a nested model to adjust for random effects of multiple inspection outcomes within the same individual restaurant and within the same block group.
We performed statistical analyses using Stata release 12. 24 We considered P ≤ .05 to be significant. This study was reviewed and deemed exempt by the Institutional Review Board of the University of Pennsylvania.
Results
During the 2-year study period, 68.0% (2662 of 3915) of nonchain restaurants and 58.8% (394 of 671) of chain restaurants were inspected only once (P < .001; Table 1). Compared with nonchain restaurants, chain restaurants had significantly fewer total violations per inspection (mean [SD]: 6.5 [4.6] vs 9.6 [6.8] violations, P < .001), fewer foodborne-illness risk factor violations per inspection (1.9 [2.1] vs 2.9 [3.0] violations, P < .001), and fewer good retail practice violations per inspection (4.6 [3.2] vs 6.6 [4.7] violations, P < .001). Compared with the block groups near chain restaurants, the block groups near nonchain restaurants had a significantly lower mean total population (1316 [5978] vs 1516 [640] people, P < .001), lower median household income ($43 035 [$22 872] vs $45 016 [$21 483], P = .01), higher proportion of black residents (38.3% [36.4%] vs 28.9% [31.1%], P < .001), higher proportion of Hispanic residents (11.0% [17.6%] vs 9.6% [13.9%], P = .02), and higher proportion of residents living in poverty (25.2% [17.4%] vs 21.7% [15.3%], P < .001).
Inspection frequency, types of violations, and block groupa sociodemographic characteristics associated with 6340 routine restaurant inspections,b by type of restaurant, Philadelphia, Pennsylvania, January 2013–December 2014
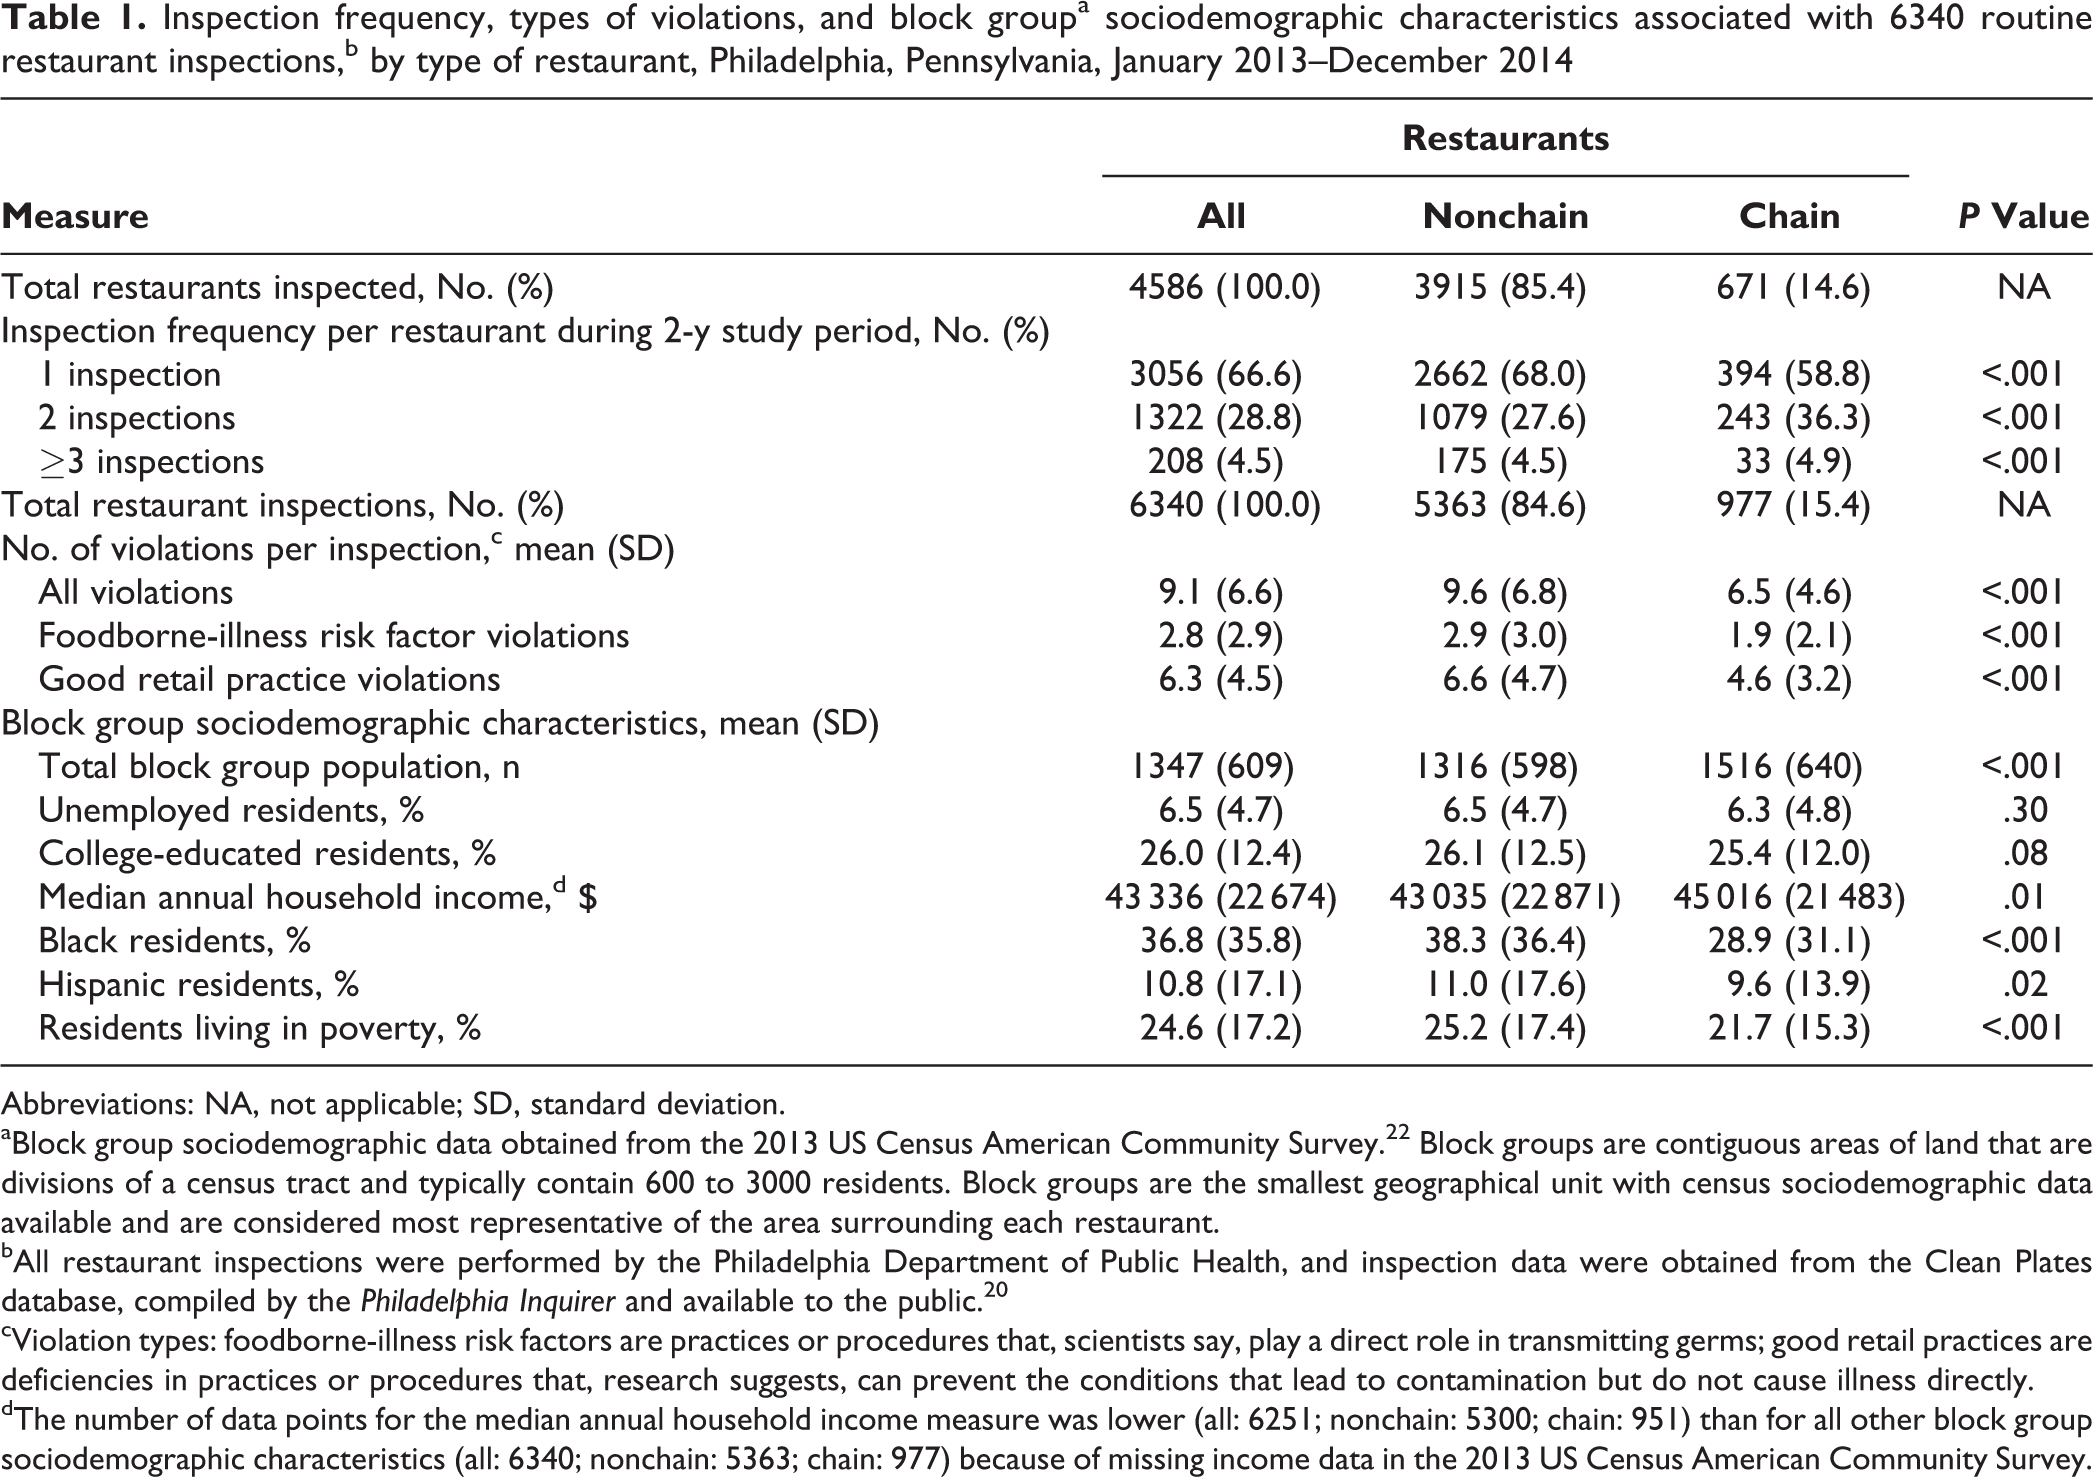
Abbreviations: NA, not applicable; SD, standard deviation.
aBlock group sociodemographic data obtained from the 2013 US Census American Community Survey. 22 Block groups are contiguous areas of land that are divisions of a census tract and typically contain 600 to 3000 residents. Block groups are the smallest geographical unit with census sociodemographic data available and are considered most representative of the area surrounding each restaurant.
bAll restaurant inspections were performed by the Philadelphia Department of Public Health, and inspection data were obtained from the Clean Plates database, compiled by the Philadelphia Inquirer and available to the public. 20
cViolation types: foodborne-illness risk factors are practices or procedures that, scientists say, play a direct role in transmitting germs; good retail practices are deficiencies in practices or procedures that, research suggests, can prevent the conditions that lead to contamination but do not cause illness directly.
dThe number of data points for the median annual household income measure was lower (all: 6251; nonchain: 5300; chain: 951) than for all other block group sociodemographic characteristics (all: 6340; nonchain: 5363; chain: 977) because of missing income data in the 2013 US Census American Community Survey.
Among all restaurants, an increase from 1 to 2 inspections during the 2-year study period was significantly associated with a 0.9 decrease in mean violations per inspection (P < .001), and an increase from 1 to ≥3 inspections was significantly associated with a 1.4 decrease in mean violations per inspection (P < .001; Table 2). The findings for nonchain restaurants were similar: an increase from 1 to 2 inspections was significantly associated with a 0.8 decrease in mean violations per inspection (P < .001), and an increase from 1 to ≥3 inspections was significantly associated with a 1.6 decrease in mean violations per inspection (P < .001). However, this association between increased number of inspections during the 2-year period and decreased mean violations per inspection was not seen among chain restaurants (Figure).
Relationshipsa between total inspection frequency per restaurant and total violations per restaurant inspection for 6340 routine restaurant inspections,b by chain vs nonchain restaurants, Philadelphia, Pennsylvania, January 2013–December 2014
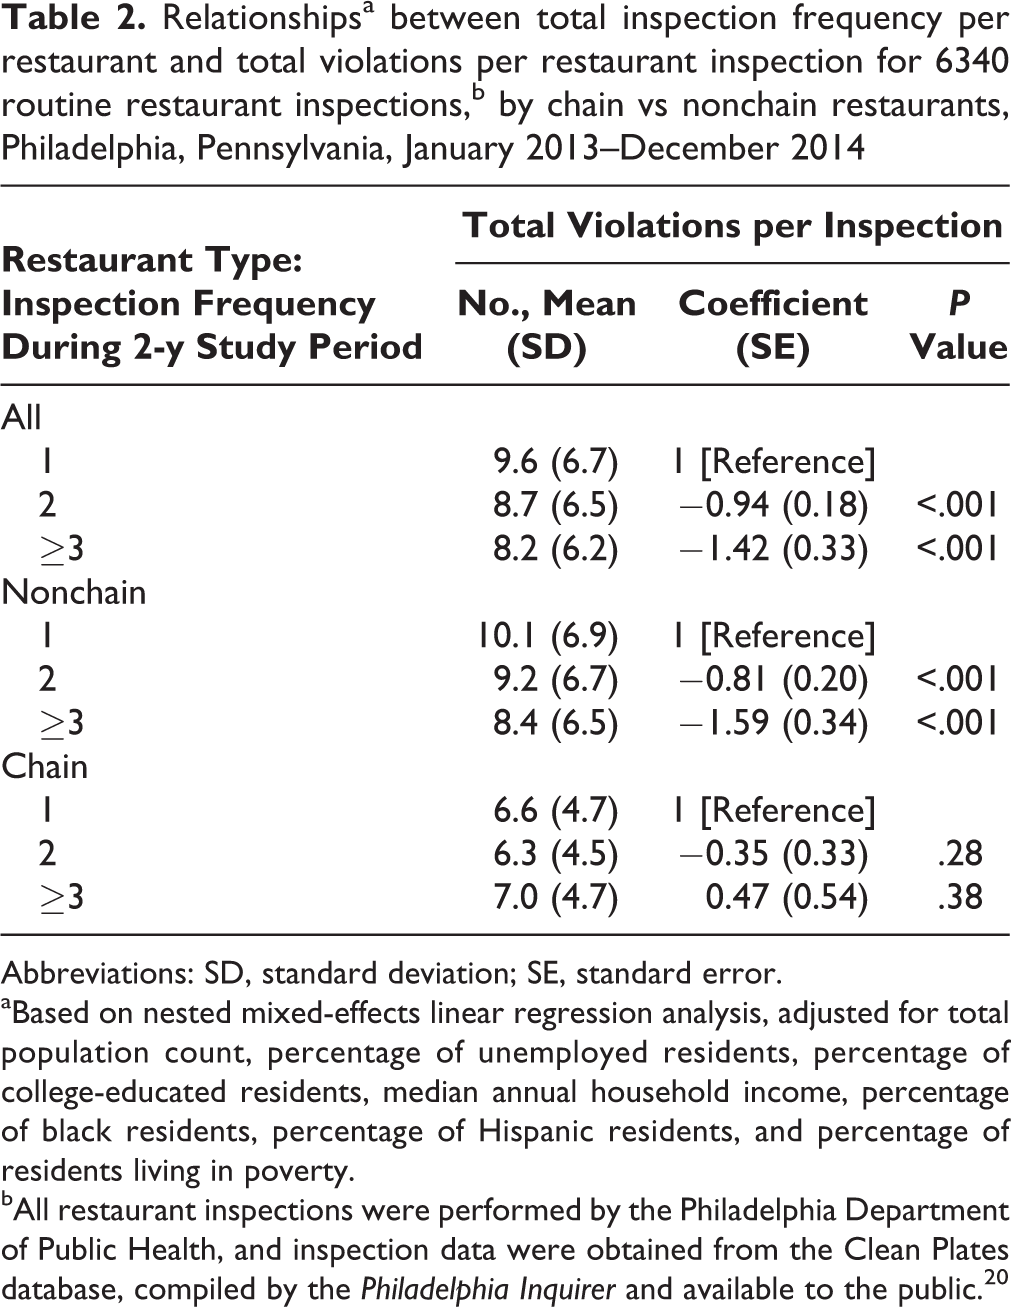
Abbreviations: SD, standard deviation; SE, standard error.
aBased on nested mixed-effects linear regression analysis, adjusted for total population count, percentage of unemployed residents, percentage of college-educated residents, median annual household income, percentage of black residents, percentage of Hispanic residents, and percentage of residents living in poverty.
bAll restaurant inspections were performed by the Philadelphia Department of Public Health, and inspection data were obtained from the Clean Plates database, compiled by the Philadelphia Inquirer and available to the public. 20
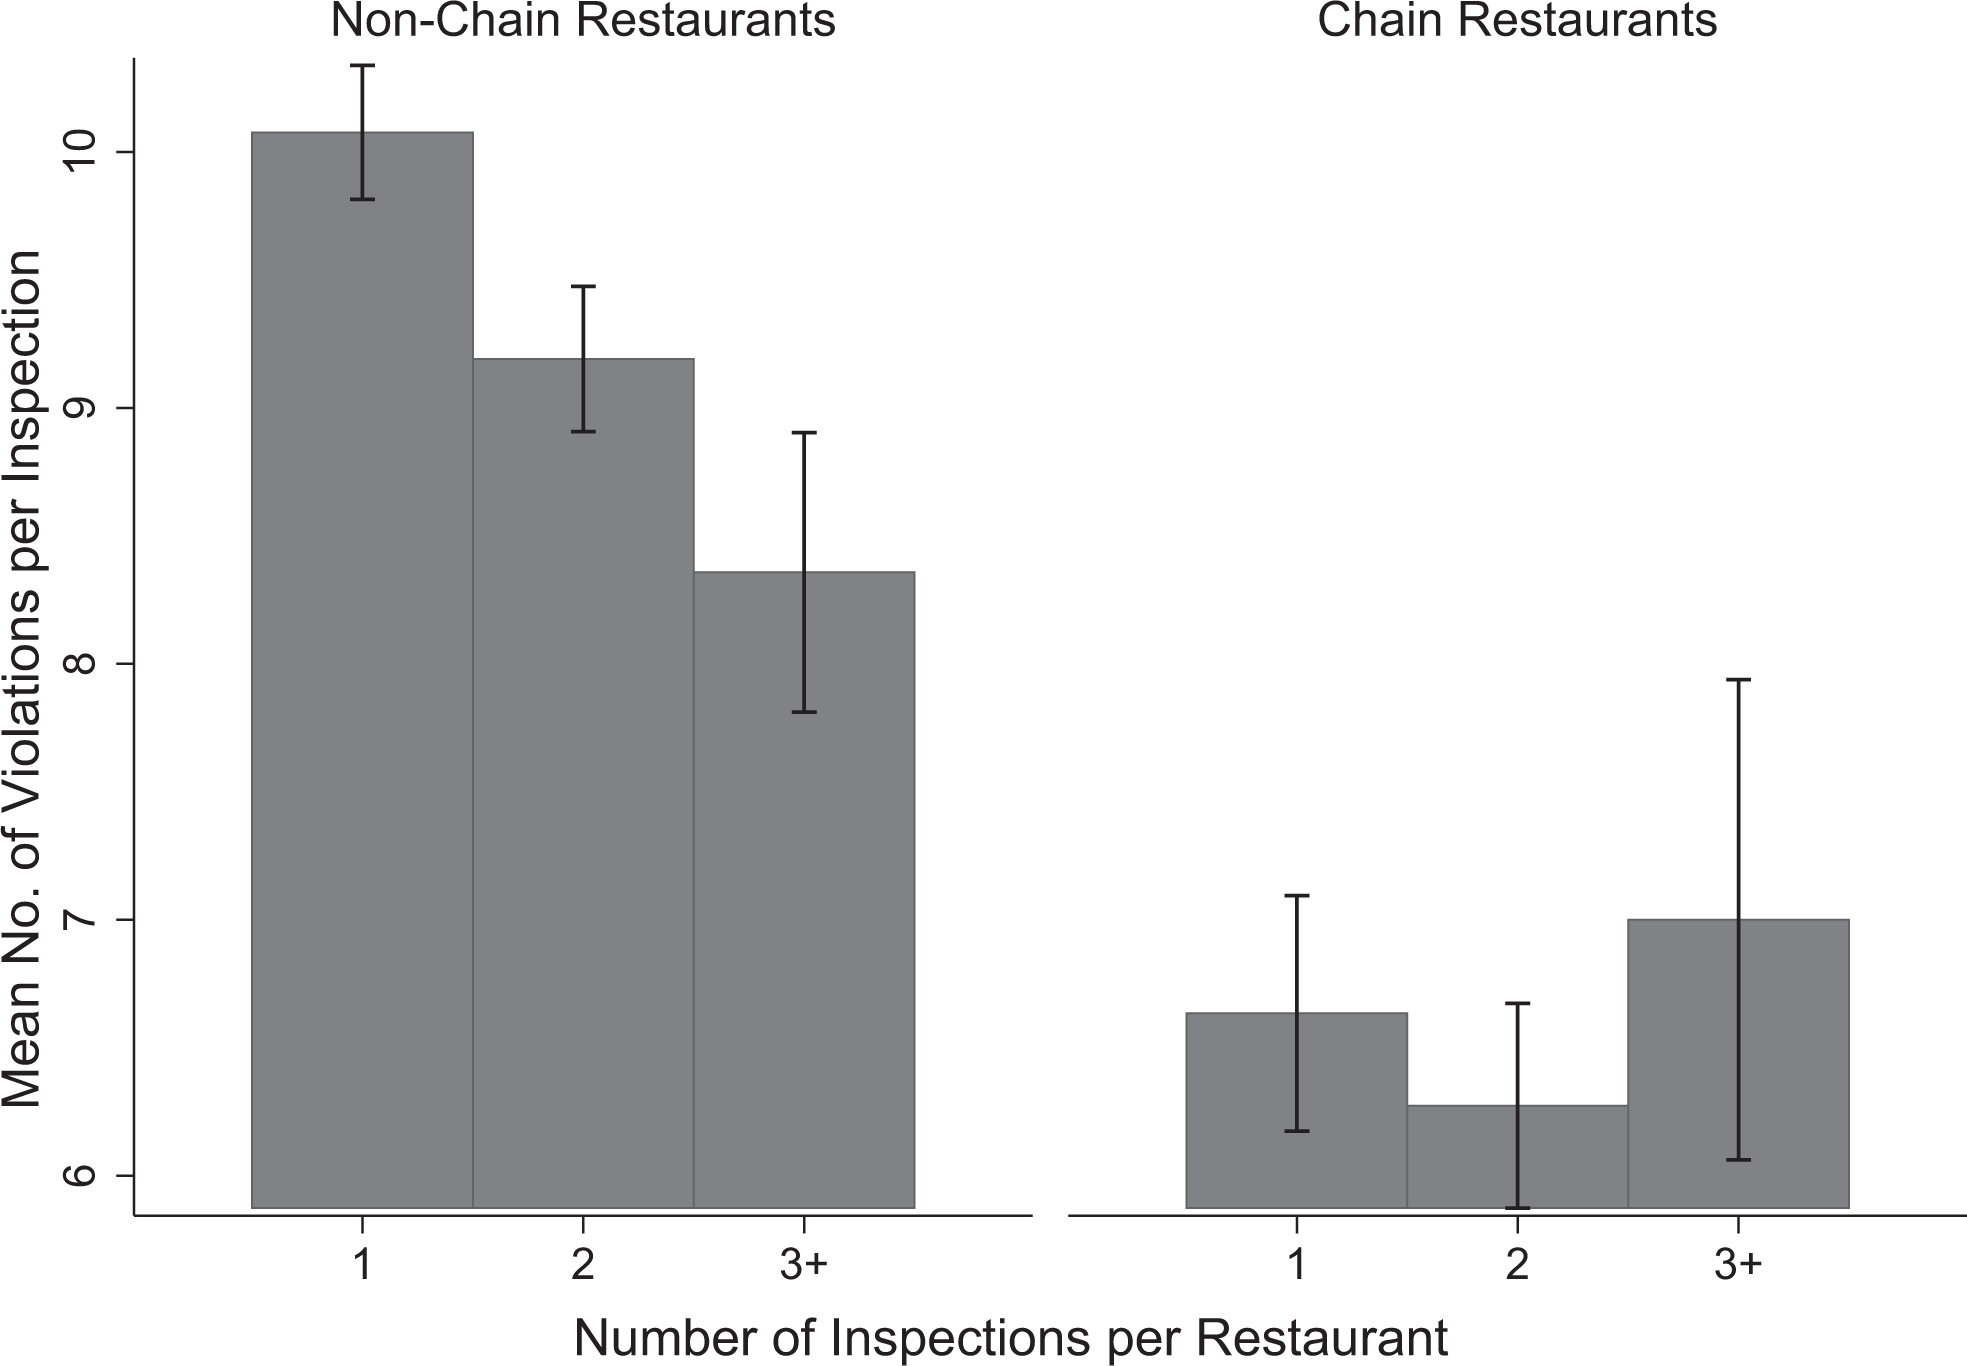
Number of inspections per restaurant and number of violations per inspection for 6340 routine restaurant inspections, by chain vs nonchain restaurants, Philadelphia, Pennsylvania, January 2013–December 2014. All restaurant inspections were performed by the Philadelphia Department of Public Health, and inspection data were obtained from the Clean Plates database, compiled by the Philadelphia Inquirer and available to the public. 20 Error bars indicate confidence intervals.
Among all restaurants, the number of total violations per inspection was not associated with any block group sociodemographic characteristics (Table 3). However, the number of foodborne-illness risk factor violations per inspection was significantly negatively associated with the proportion of black residents in restaurant block groups (coefficient = –0.59, P < .001), whereas the number of good retail practice violations per inspection was significantly positively associated with the proportion of black residents (coefficient = 1.00, P < .001) and Hispanic residents (coefficient = 1.47, P = .007).
Relationshipsa between restaurant inspection violation types and block groupb sociodemographic characteristics for 6340 routine restaurant inspections, by type of restaurant (chain and nonchain), Philadelphia, Pennsylvania, January 2013–December 2014
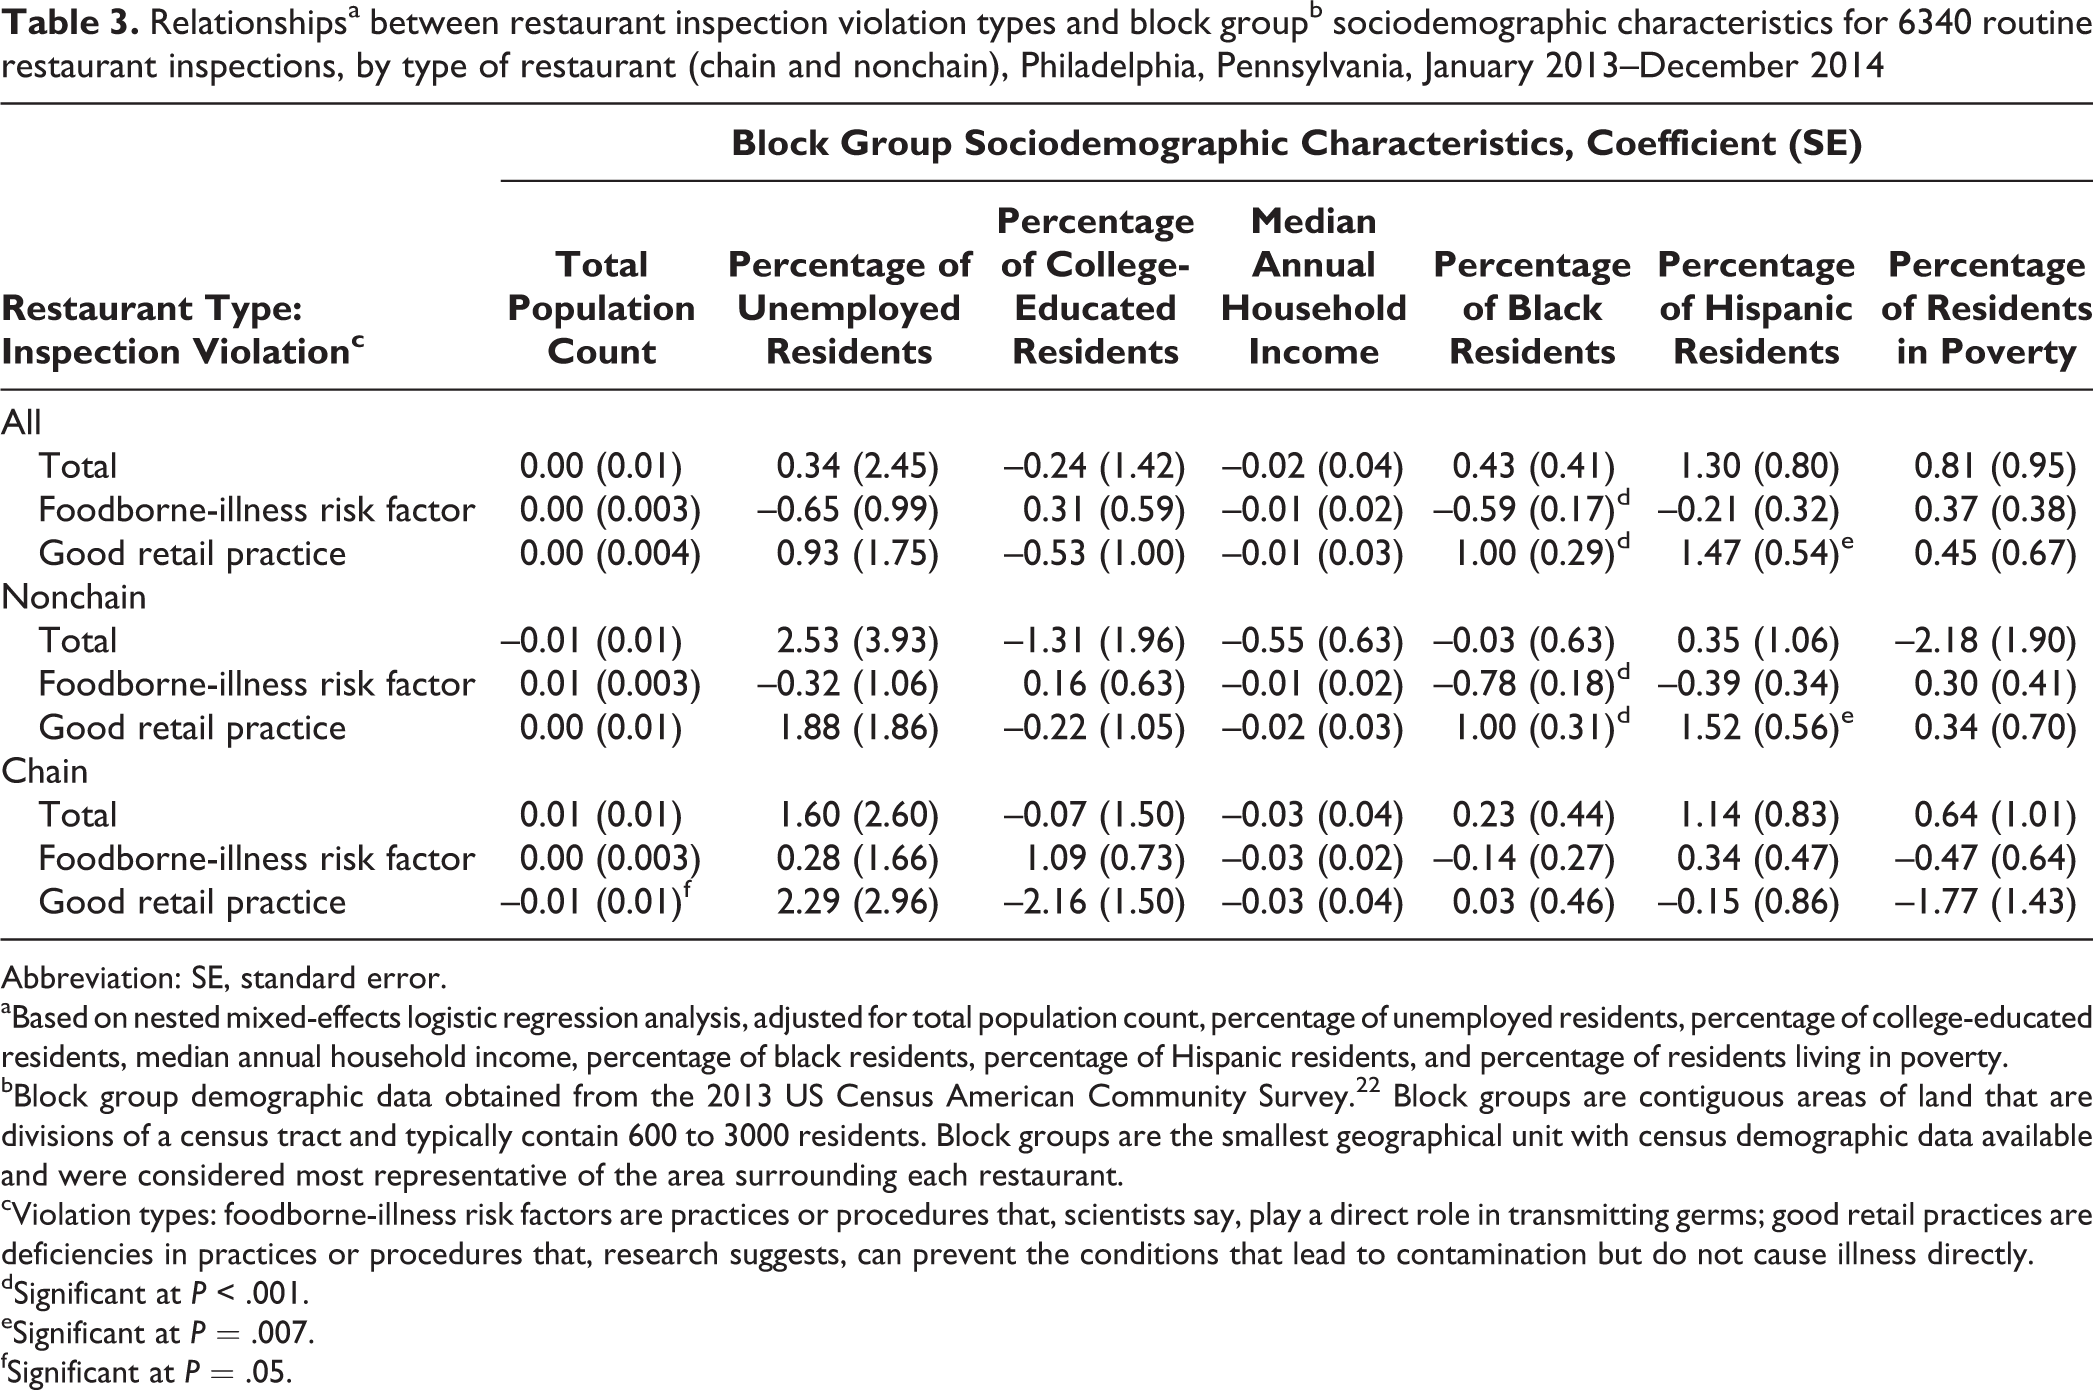
Abbreviation: SE, standard error.
aBased on nested mixed-effects logistic regression analysis, adjusted for total population count, percentage of unemployed residents, percentage of college-educated residents, median annual household income, percentage of black residents, percentage of Hispanic residents, and percentage of residents living in poverty.
bBlock group demographic data obtained from the 2013 US Census American Community Survey. 22 Block groups are contiguous areas of land that are divisions of a census tract and typically contain 600 to 3000 residents. Block groups are the smallest geographical unit with census demographic data available and were considered most representative of the area surrounding each restaurant.
cViolation types: foodborne-illness risk factors are practices or procedures that, scientists say, play a direct role in transmitting germs; good retail practices are deficiencies in practices or procedures that, research suggests, can prevent the conditions that lead to contamination but do not cause illness directly.
dSignificant at P < .001.
eSignificant at P = .007.
fSignificant at P = .05.
The findings for nonchain restaurants were similar to those for all restaurants: the number of foodborne-illness risk factor violations per inspection was significantly negatively associated with the proportion of black residents in restaurant block groups (coefficient = –0.78, P < .001), whereas the number of good retail practice violations was significantly positively associated with the proportion of black residents (coefficient = 1.00, P < .001) and Hispanic residents (coefficient = 1.52, P = .007; Table 3).
Among chain restaurants, the number of good retail practice violations per inspection was significantly negatively associated with the total population count of restaurant block groups (coefficient = –0.01, P = .05), but we did not identify any additional significant associations between the number of restaurant inspection violations and block group sociodemographic characteristics.
Discussion
This study provides a new perspective on restaurant food safety in a large, diverse US city. We identified substantial differences between chain and nonchain restaurant inspection outcomes in Philadelphia during the study period. In nonchain restaurants, increased inspection frequency was associated with fewer violations per inspection; however, in chain restaurants, changes in the number of inspections did not affect the number of violations per inspection. In addition, the number of inspection violations per inspection were consistently higher in nonchain restaurants than in chain restaurants, regardless of inspection frequency. Our findings of lower rates of violations in chain restaurants compared with nonchain restaurants are consistent with previous research on the impact of employee training on inspection outcomes, in which findings indicated that critical violations were more likely to be found in nonchain restaurants than in chain restaurants. 25 In restaurant neighborhoods with higher proportions of black residents, nonchain restaurants were likely to have fewer foodborne-illness risk factor violations per inspection than chain restaurants yet more good retail practice violations per inspection. Finally, we found that in restaurant neighborhoods with larger populations compared with smaller populations, chain restaurants were likely to have fewer good retail practice violations per inspection than nonchain restaurants.
We note that nonchain restaurants that were inspected only once during the 2-year study period had an average of 65% more violations per inspection than chain restaurants with the same inspection frequency. These results indicate that in this particular setting, nonchain restaurants may have been more influenced by the frequency of food safety inspection than chain restaurants. These findings also imply that changes in the targeting and scheduling of food safety inspections could improve the efficiency of detecting violations. Health departments and city inspection officials could use these findings to focus their efforts on nonchain restaurants and use risk-based models to increase the frequency of inspections in those restaurants.
In restaurant neighborhoods with higher proportions of black residents, nonchain restaurants had fewer foodborne-illness risk factor violations than restaurant neighborhoods with lower proportions of black residents. In areas of Philadelphia with more black residents, nonchain restaurants may have served food carrying substantially less risk of foodborne illness than restaurants in areas with fewer black residents. These nonchain restaurants may process their ingredients and handle raw food to a lesser extent than nonchain restaurants with fewer black residents so that they more closely resemble chain restaurants. Alternatively, these results may have been influenced by other unrelated factors. For example, Philadelphia’s Center City, which is the city’s main tourist destination and has a predominantly white population, has a high density of nonchain restaurants compared with other areas of the city. Using US Census area data and location variables within our inspection database, we found 513 restaurants per square mile in Center City and 24 restaurants per square mile outside Center City. 26 Thus, the results for Center City may have been influenced by the large number of nonresident visitors, in which case the block group sociodemographic characteristic data that we used, which were based only on local residents, may not have accurately represented the customers of these restaurants. Future analyses may be necessary to more fully understand the impact of restaurant density and tourist population characteristics on inspection outcomes.
Conversely, the total violation and foodborne-illness risk factor violation outcomes for chain restaurant inspections were not associated with any block group sociodemographic characteristics. This lack of variation in the inspection outcomes for chain restaurants was not unexpected, because theoretically they engage in the same training, practices, and oversight in all of their facilities throughout the city. However, we did find that chain restaurants in neighborhoods with larger populations had fewer good retail practice violations per inspection. The finding of fewer good retail practice violations may have resulted from various unique circumstances of chain restaurants in these more populated areas, such as higher volumes of customers, thereby increasing the restaurants’ profitability and allowing the owners to dedicate more funding and staff time to aesthetic upkeep.
Nonchain restaurants had more good retail practice violations per inspection in neighborhoods with higher rather than lower proportions of black and Hispanic residents. One possible explanation for this finding is that neighborhoods with larger racial/ethnic minority populations tend to have fewer restaurants and less access to municipal services. Therefore, restaurant owners in these block areas may have reduced means to maintain restaurant cleanliness or may not emphasize cleanliness as much as restaurant owners in block groups with fewer racial/ethnic minority populations because of less competition from other restaurants. Previous research on restaurant inspection outcomes in Philadelphia found that foodborne-illness risk factor violations were reported at a higher rate in restaurants in areas with more Hispanic residents, which represents findings different from those of the current study. 12 However, this previous research was not stratified by restaurant type, and both studies highlight variations in inspection outcomes based on neighborhood sociodemographic variables.
Limitations
This study had several limitations. First, the analysis was not adjusted for restaurants that had just opened or were closed permanently during the 2-year period. Some of these restaurants may ultimately have had fewer inspections than they might have had if they had been open during the entire study period, potentially affecting our inspection frequency results. In addition, some of the new restaurants may have been inspected before they had developed established routines; as such, they may have incurred more violations per inspection, potentially skewing the outcomes for the groups of restaurants with fewer inspections. We did try to minimize the impact of this latter confounder and keep the focus on fully operational restaurants by excluding from our analysis all initial-opening inspections for new restaurants. Second, the data that we used were based only on restaurants that had been inspected during the 2-year study period. Some restaurants in Philadelphia may not have been inspected at all during that time and so were not represented in the database. This limitation highlights one of the challenges faced by public health departments in large cities. We tried to minimize the impact of this limitation by selecting a 2-year study period rather than a 1-year study period, hoping to capture data on inspection results from as many restaurants as possible. Finally, qualitative factors including different employee training practices or variation in relationships between restaurant owners and city health personnel could have affected the restaurant inspection outcome results of our study. If so, future research may need to consider the roles that employee training practices and interpersonal connections play in the restaurant inspection process.
Conclusion
The results of this study indicate that a risk-based stratified approach to restaurant food safety inspection frequency, based on whether or not restaurants are part of chains, could reduce the frequency of violations, particularly in those restaurants with the most violations. These findings may be valuable for other cities, but a local analysis of inspection outcomes would be required to determine if similar opportunities for improvement exist. Based on our findings, public health departments in Philadelphia and elsewhere could consider focusing more of their food safety inspection efforts on nonchain restaurants than on chain restaurants, while applying a lower level of scrutiny to chain restaurants, which have internal food safety protocols and economies of scale that may reduce the likelihood of food safety violations. Additional research is warranted on how the sociodemographic composition of the neighborhoods around restaurants affects food safety inspection outcomes.
Footnotes
Acknowledgments
We thank Jerry Skefos and Nancy Leinwand for their editorial assistance.
Declaration of Conflicting Interests
The author(s) declared no potential conflicts of interest with respect to the research, authorship, and/or publication of this article.
Funding
The author(s) received no financial support for the research, authorship, and/or publication of this article.