
Abstract
This article explores the relationship between ethnic structure of local areas, anti-immigrant sentiment and Brexit vote among White British in England. We focus on two indicators of ethnic structure: ethnic minority outgroup share and minority–majority segregation. Our findings suggest that local minority share plays a key role in shaping anti-immigrant sentiment and Brexit support. However, how it affects these outcomes is conditional on levels of local residential segregation. It is only residents living in high minority share areas that are residentially segregated who report higher anti-immigrant sentiment and Brexit support. In fact, living in high minority share areas that are residentially integrated appears to improve attitudes and reduce Brexit support.
Introduction
Research has demonstrated that attitudes towards immigration, ethnic diversity and national identity, alongside authoritarian values, played a key role in Brexit support (Curtice, 2017; Kaufmann, 2019; Kenny et al., 2021). Some argue that attitudes towards immigration (and diversity more generally) have created a new political divide that cuts across the left–right political spectrum and traditional party identities (Duffy et al., 2019). Accordingly, Brexit support has been portrayed as symptomatic of broader anti-immigrant and anti-diversity attitudes (Evans and Kelley, 2019). The so-called ‘left behind’, economically disadvantaged groups, who did not benefit from globalisation were especially likely to see immigration as a threat (Goodwin and Heath, 2016).
Given issues around immigration and ethnic diversity were a central part of Brexit debate, it might be expected that the ethnic make-up of people’s local areas played a crucial role in Brexit vote choice. However, there is little research on the relationship between local ethnic structure and the EU referendum vote, while the current evidence base remains somewhat mixed. Studies have shown the share of ethnic minorities in an area has no relationship with Brexit support (Goodwin and Heath, 2016), that the share of immigrants is negatively associated with Brexit support (Chan et al., 2020), or that the findings for local ethnic composition are mixed and conditional on which groups in an area are looked at (Alabrese et al., 2019; Becker et al., 2017). While evidence on how the size of the ethnic outgroup in an area affected Brexit support is mixed, there is more consistent evidence that larger influx of ethnic outgroups in an area was associated with more support for Brexit (Chan et al., 2020; Goodwin and Heath, 2016). Interestingly, this mixed evidence base for how the ethnic composition of local areas is linked to support for Brexit is mirrored in the mixed evidence base for how local ethnic composition shapes broader attitudes towards immigration (Pottie-Sherman and Wilkes, 2017).
We propose that there is a potentially key omission from this debate, which could help explain some of the conflicting results; that is, the role of residential segregation. To our knowledge, no studies have examined the role-played by residential segregation in the Brexit referendum. This is important because without knowing how segregated ethnic minority and majority groups are from each other in an area, it is difficult to speculate about people’s everyday experiences of ethnic diversity; for example, the opportunities they might have for a meaningful contact. People living in diverse areas but where ethnic groups live in highly segregated pockets might have little opportunities to meet and interact with each other. On the other hand, those living in equally diverse places where ethnic minority and majority groups are equally spread out across an area, living next door to each other (integrated areas), where their kids go to ethnically mixed schools, or where they access the same local amenities, might have plenty of opportunities for intergroup contact. In other words, how segregated an area is may be just as important for people’s attitudes as the size of the ethnic minority group. The absence of studying segregation alongside outgroup size could help explain why studies have found mixed evidence for the link between outgroup size and support for Brexit. Our study therefore builds on findings suggesting that segregation may also be linked to intergroup attitudes (e.g. Kawalerowicz, 2021; Laurence 2016).
In sum, our goal is to simultaneously examine the impacts of (1) the size of the ethnic minority population and (2) the spatial segregation between ethnic majority/minority groups. We aim to assess the relative importance of these two aspects of local ethnic structure for both anti-immigrant attitudes and Brexit support, and test whether any effect of an area’s ethnic structure on pro-/anti-Brexit vote may come through people’s attitudes towards immigrants. For our empirical analysis, we use three nationally representative data sets: the British Election Study (2017), Wave 8 of Understanding Society mainstage survey (2016/2017), and Wave 9 of Understanding Society Innovation Panel (IP) (2014/2015). We also conduct sensitivity analyses to explicitly test: (1) whether intergroup processes may differ across the geographical scale at which local communities are measured and (2) the importance of operationalising outgroup size across different ethnic outgroup categories (non-White, non-White British and Muslims).
Our results show that residential segregation plays a crucial role in the EU referendum vote choice and anti-immigrant attitudes. We find that a larger minority share in a local area can be linked to either higher or lower support for Brexit depending on how residentially segregated that area is. People living in places with high minority share and low segregation are less likely to have voted for Brexit; whereas those living in places with high minority share but high segregation are more likely to have voted for Brexit. As expected, we find that the effects of ethnic structure on anti-immigrant attitudes follow similar pattern and that anti-immigrant attitudes mediate at least part of the effect of local ethnic structure on Brexit vote.
The implications of our study go beyond the case of the EU referendum in Britain. The same mechanisms should theoretically apply to a broad range of anti-minority and anti-immigrant attitudes. Therefore, this article advances our theoretical understanding of the types of local ethnic structure that provide fertile ground for both anti-immigrant attitudes and demand for political change. They also shed light on one possible driver of the growing polarisation observed in many societies around issues of immigration. Future studies could test whether our proposed mechanisms apply to different political issues in different country contexts, where anti-immigrant attitudes are believed to be the basis for voting behaviour.
Theoretical Framework and Previous Research
Outgroup Size and Intergroup Attitudes
Two main theories are drawn on in seeking to explore how the ethnic structure of people’s localities affect attitudes towards outgroups: the ‘threat’ and ‘contact’ hypotheses. Different formulations of the ‘threat’ hypothesis generally predict that increases in the outgroup size in one’s local area trigger feelings of threat, which lead to the development of negative outgroup attitudes (Blalock and Hubert, 1967; Blumer, 1958; Key, 1949). Threat responses stem from the competition over economic or political resources, either because of individuals’ own positions or the position of their group as a whole (Hainmueller and Hopkins, 2014; Key, 1949; Sherif and Sherif, 1969). Increases in outgroup size can also make the majority group feel that their values or beliefs are undermined by an outgroup’s culture (Kinder and Sears, 1981; Sniderman and Hagendoorn, 2009). In contrast to threat theories, the literature on intergroup ‘contact’ leads to more optimistic predictions. According to the ‘contact’ hypothesis, increases in outgroup size provide opportunities for higher frequencies of interpersonal contact between members of different groups (Eric Oliver and Wong, 2003; Wagner et al., 2006). In turn, meaningful contact can improve intergroup relations, especially when the context encourages co-operation, working towards common goals, and when there is a balance of power between ingroup and outgroup members (Allport et al., 1954). In addition, studies show that even in the absence of direct interpersonal contact, higher outgroup size may improve outgroup attitudes through indirect contact, that is, through contact with someone from one’s group who themselves had a positive experience with a member of the outgroup (Christ et al., 2014; Vezzali et al., 2014). However, the increase in intergroup contact is not always positive. As Laurence et al. (2019) have shown, increased outgroup size likely triggers higher frequencies of both negative and positive contacts, driving both negative and positive attitudes towards outgroups.
Drawing on this theoretical framework, recent UK studies have looked specifically at the relationship between the relative size of either ethnic minority populations (Becker et al., 2017; Goodwin and Heath, 2016) or immigrant populations (Alabrese et al., 2019; Chan et al., 2020) in the local area and the support for Brexit. The results are somewhat mixed, with studies finding either no relationship or a negative relationship between outgroup size and support for Brexit, in line with the ‘contact’ hypothesis. Similarly, empirical findings on the effect of outgroup size on attitudes towards immigrants across Europe and the United States are also mixed. Some studies find larger concentrations of immigrants to be associated with more anti-immigrant attitudes and support for restricting immigration in both the United States (Avery et al., 2017; Branton et al., 2011; Butz and Kehrberg, 2016; Hood and Morris, 1997) and Europe (i.e. Savelkoul et al., 2011; Semyonov et al., 2006; Weber, 2019). However, there is also evidence demonstrating the opposite relationship (Facchini et al., 2017; Kaufmann, 2017; Wagner et al., 2006) or no relationship (see meta-analysis by Pottie-Sherman and Wilkes, 2017). In sum, while evidence suggests that a higher minority share either has no effect or may depress support for Brexit, it is less clear how the size of the minority share affects immigration attitudes.
In view of the largely inconclusive results concerning the effect of outgroup size, researchers have turned their attention towards the effect of pace of ethnic change for intergroup attitudes. In contrast to the static effect of outgroup size, the evidence concerning the pace of outgroup inflow is more consistent. Recent UK-based studies found that higher rates of immigrant influx to local areas increases Brexit support (Carozzi, 2016; Chan et al., 2020; Goodwin and Heath, 2016; Goodwin and Milazzo, 2017). Similarly, studies investigating the effect of a higher immigrant influx on anti-immigrant attitudes in the United States (Hopkins, 2010; Newman, 2013) and Europe (Kaufmann, 2017; Kawalerowicz, 2021) generally find that larger recent increases in immigrant-share in an area are positively associated with anti-immigrant sentiment. This, they suggest, stems from ‘cultural’ not ‘economic’ threat. Newman’s (2013) ‘acculturating-context hypothesis’ predicts that ‘acculturative stress’ (Berry, 1970) or ‘culture shock’ (Furnham and Bochner, 1986) occurs in times of rapid population change when culturally distant groups come into contact. He also emphasises the importance of considering the baseline level of diversity. Intuitively, areas with higher levels of ethnic diversity should be better equipped to respond to high rates of incoming outgroup populations compared to low-diversity areas (although see Kawalerowicz, 2021).
The Role of Segregation
Spatial segregation between members of different groups is an aspect of the ethnic structure of local areas that has received less attention in the literature. However, it may have important implications for the processes of intergroup contact and threat outlined above. Importantly, segregation captures a largely distinct dimension of an area’s ethnic structure from the share of outgroup. For example, an area with a relatively large (say 50%) ethnic minority population can look very different depending on how segregated it is. If the ethnic outgroup is equally spread out across an area and residentially mixed with the majority group, living in the same neighbourhoods (a diverse, integrated area), then there should be many opportunities for intergroup contact. For example, people will likely mix with each other in their local amenities, such as schools, civic groups, shops, and leisure spaces. On the other hand, in an area with the same share of ethnic minorities, where different ethnic groups live in separate clusters, creating ‘communities within a community’ (a diverse, segregated area), the opportunities for contact are likely to be restricted (Laurence et al., 2019; Rocha and Espino, 2009).
Such diverse, segregated and diverse, integrated areas may also differ in other ways which shape how far outgroups are perceived as a threat. Diverse, segregated areas, where ethnic minorities live in highly concentrated pockets may exaggerate perceived differences between groups and make the ethnic minority outgroup seem larger in size, leading to greater perceived threat (Allport et al., 1954; Biggs and Knauss, 2012; Enos and Celaya, 2018; Laurence et al., 2019).
The role of segregation in intergroup processes outlined above may also depend on the size of ethnic minority population. For example, if there is only 1% of ethnic minorities in a local area, whether they are dispersed or segregated may matter less for people’s attitudes compared to an area with 50% of ethnic minorities. For example, Laurence et al. (2019) and Rocha and Espino (2009) find that segregation has a negative effect on intergroup attitudes only where there is a sizable proportion of ethnic minorities. In non-segregated areas, increasing outgroup size appears to have a positive effect on intergroup attitudes. Accordingly, residential segregation could have both a direct effect on intergroup attitudes and also a conditional effect, with more negative effects in areas with larger shares of ethnic outgroups.
Aims of the Paper and Research Questions
Taken together, the existing literature informs our understanding of the role of local ethnic structure in the 2016 EU referendum. First, when minority share is modelled alongside minority change, the former tends to be associated with more positive attitudes towards minority outgroups and the latter with more negative attitudes. Therefore, we predict that majority group members living in areas with larger share of minorities might hold less negative attitudes towards immigrants (H1a) and show less support for Brexit (H1b), in the presence of controlling for minority change in the area.
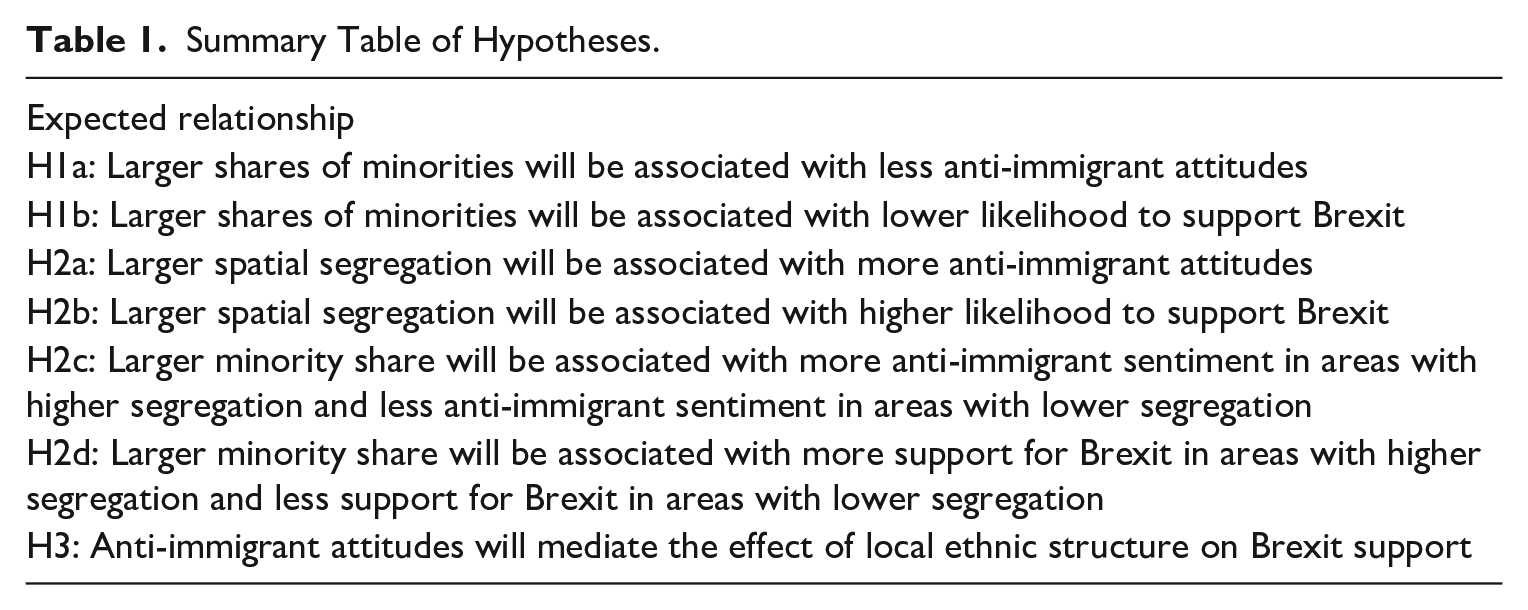
Second, higher spatial segregation is expected to limit opportunities for positive contact and/or foster greater perceived threat, leading to less positive outgroup attitudes. The effects of segregation may also be stronger in areas with larger shares of ethnic outgroups. Thus, we hypothesise that spatial segregation may have an overall positive effect on anti-immigrant sentiment (H2a) and Brexit support (H2b) but it might also have a stronger positive effect on anti-immigrant sentiment (H2c) and Brexit support (H2d) in areas with higher shares of ethnic minorities, that is, there will be an interaction effect between segregation and minority share on our outcomes. Finally, we expect that how the ethnic structure of areas shaped Brexit preferences likely comes through its effect on anti-immigrant attitudes. In other words, we hypothesise that anti-immigrant sentiment will mediate the effect of local ethnic structure on Brexit support (H3). We summarise all the expected relationships in Table 1.
Summary Table of Hypotheses.
Importantly, both the theoretical framework of contact and threat, and existing empirical research, suggest that attitudes towards immigration and Brexit support are not solely shaped by the migration status of people. Instead, it is people’s ethnic background, including both first and subsequent generations of ethnic minorities, that appears important. Accordingly, we will focus on the ethnic (not solely migration) structure of communities.
Data, Outcome Measures, Samples
Data and Outcome Measures
To investigate the role of community ethnic structure on attitudes to immigrants and support for Brexit, we use three data sets. First, the 2017 face-to-face British Election Study (BES) (N = 2194), which is a nationally representative survey of eligible voters living in Great Britain, possessing measures of both attitudes to immigration (‘Do you think that too many immigrants have been let into this country, or not?’ 1 = ‘Yes, too many’ and 0 = ‘No, not too many’) and support for Brexit (measured by the question ‘Thinking back to the EU referendum held on 23 June 2016, if you voted did you vote to remain in the EU or to leave the EU, or did you not vote?’ 1 = ‘I did not vote’ 2 = ‘Leave the EU’ and 3 = ‘Remain in the EU’). The 2017 BES data critically contain a validated vote measure, which provide us a unique opportunity to test effects on actual voters during the EU referendum. In comparison, other surveys provide voting preferences among both voters and non-voters or rely on self-reported voting behaviour prone to bias. With measures of Brexit vote and attitudes to immigrants in the same data set, we can also test to what extent any effect of local areas on Brexit vote is mediated by attitudes to immigrants. We restrict the sample to those who voted (validated) and recode the support for Brexit measure into 1 = ‘voted to leave the EU’ and 0 = ‘voted to remain in the EU’.
Second, in seeking to cross-validate findings from the BES analysis on alternative, nationally representative UK data sets, we draw on two Understanding Society (UKHLS) data sets: Wave 9 of the IP and Wave 8 of the main UKHLS survey. Both data sets include measures capturing our main dependent variables using slightly different measures than the BES.
The IP is a longitudinal survey representing households in Britain, designed to test methodological experiments, and conducted alongside the mainstage UKHLS survey. At Wave 9 (2014/2015), IP contained three statements on attitudes to immigrants (‘The UK should allow people from Eastern European countries to come and live here’; ‘The UK should allow people from Muslim countries to come and live here’ and ‘The UK should allow people from Caribbean countries to come and live here’). A sample of 517 respondents was asked to assess whether they agree or disagree with each statement. To construct our dependent variable, we combine the answers to all three questions and recode the attitudes towards immigrants measure into 0 = ‘positive’ if a respondent agreed with all of the statements and 1 = ‘negative’ if a respondent disagreed with at least 1 statement. Although the sample is relatively small, the fact that individual-level information can be linked to neighbourhood-level data provides an opportunity to test our immigration attitudes models on another nationally representative sample.
We also use Wave 8 (2016/2017) of Understanding Society (UKHLS) mainstage survey (N = 39,293), which contains a question on Brexit support (‘Should the United Kingdom remain a member of the European Union or leave the European Union?’, recoded as 0 = ‘Remain a member of the European Union’ and 1 = ‘Leave the European Union’). The advantage of the UKHLS main survey is its large sample size, geo-coded individual data and the breath of information on individual-level characteristics, collected since 2009/2010. The disadvantage, in comparison to the BES data, is that the question on Brexit support captures preferences for staying in/leaving the EU, and thus does not have the BES data’s precision of capturing actual Brexit vote on a validated vote sample.
Samples
In the BES and UKHLS mainstage surveys, we restrict analyses to White British adults living in England given our primary interest in understanding how communities shaped White British opposition to immigration and Brexit support and given the dynamics of Brexit and saliency of immigration are different in England compared to the rest of the United Kingdom. Due to the small sample size in the IP, we restrict our sample to Whites (rather than White British) living in Great Britain to conduct a more meaningful statistical analysis.
Our analyses are based on the listwise deleted data as the proportion of missing values of the independent variables is very small (around 5%). Our final samples, restricted to those with non-missing independent and dependent variables are as follows: BES: N = 897 in models of immigrant attitudes and N = 774 in models of Brexit support; UKHLS IP: N = 325 and UKHLS mainstage: N = 16,146. We also imputed missing values using chained equations and the substantive results remained the same (available on request). All analyses apply survey weights to account for uneven selection probabilities/non-response. The BES analyses are weighted by the validated vote weight; the IP/UKHLS models are weighted by wave-specific cross-sectional weights.
Geographical Scale of Analysis: Local Authorities
We measure the ethnic structure of people’s spatial areas at the Local Authority (LA) level. Las are political boundaries, across which an elected body (local council) provides a range of services, with a mean population of 180,000 (Catney et al., 2023). We believe that the processes of contact and threat, linked to segregation, are more likely to operate at the LA level compared to smaller geographical levels. Segregation at this larger scale is more likely to limit opportunities for contact and lead to ethnic enclaves where services and amenities may take on a stronger ethnic identity given the size of the ethnic minority populations in these areas. At smaller spatial scales, segregation may have less impact on curtailing contact opportunities; for example, even in a diverse, segregated locality (e.g. 15- to 20-minute walk from someone’s home), residents may still encounter outgroups in their everyday life, share similar civic/social spaces or even send their children to the same schools. LAs may also be more likely to map on to processes of political threat, given they represent political boundaries. Political campaigning is likely to be designed with the electorate of particular LAs in mind. Furthermore, diverse, segregated LAs are more likely to contain high minority share wards, potentially increasing perceptions that outgroups will elect local councillors to address their own needs (Biggs and Knauss, 2012). 1
Key Independent Variables
The ethnic composition (outgroup size) of an area is measured as the proportion that is ethnic minority (share of non-White residents in LA on the scale from 0 to 1 where 0 equals 0% and 1 equals 100%). Share of non-Whites is used as our primary measure as the intergroup processes of contact and threat posited to link areas to Brexit support and anti-immigrant sentiment are thought to be shaped by both immigrants and subsequent generations of ethnic minorities. The literature also suggests that visible minorities in an area in general (rather than EU-nationals in particular) were more salient in the context of EU referendum 2 (Goodwin and Heath, 2016). Throughout the article, we use the term diversity and minority outgroup size interchangeably.
Segregation is measured using the index of dissimilarity, tapping the (un)evenness of the distribution between two groups across an area. The index of dissimilarity compares the relative proportion of two groups (in our case, White/non-White) across a series of small areas (e.g. neighbourhoods, here measured using the Output Area (OA)) with the relative proportion of the two groups across a larger area in which the smaller areas are nested (i.e. the level at which ethnic segregation is measured, in our case, the LA). Formula:

where:
D represents the proportion of a group that would need to move to create a uniform distribution of population within an area, taking values from 0 (when groups are perfectly evenly distributed) to 1 (when groups are perfectly segregated).
Given the ongoing debates on the importance of the role of ethnic outgroup change, we test two measures: (1) the medium-term change captured by the percentage points difference in the share of non-Whites between 2001 and 2011 censuses and (2) more recent, short-term change, captured by the percentage points difference in the overall share of immigrants (those born abroad) in the 5 years prior to the EU referendum (between 2011 and 2016). 3 We are unable to construct a more recent measure of short-term (2011–2016) change in the share of non-Whites, and only for non-UK born. This is because detailed ethnic group composition data at the LA level is not available between 2011 and 2016. We will discuss potential implications that come from looking at changes in non-Whites and changes in born abroad below.
Community and Individual-Level Controls
Previous studies have shown that economic deprivation at the local level was also associated with Brexit vote (Alabrese et al., 2019; Carreras, 2019). Accordingly, we use three indices derived using factor analysis (principal component analysis (PCA)) based on 2011 census data. These indices are: (a) occupation disadvantage (which includes the share of people in non-managerial/non-professional occupations and the share of people below degree level education); (b) resource disadvantage (which includes the share of households in socially rented accommodation, the share of households with a female lone parent, and the share of economically active but unemployed in the area) and (c) urbanisation (measured by population density, share of all employed who work in agriculture and proportion aged 65+ in LA).
At the individual level, we control for standard socio-demographic characteristics, including age, gender, education, employment status, housing tenure and marital status. We also include measures of one’s income (UKHLS/IP) as well as perceived/anticipated financial situation (BES/UKHLS).
Modelling and Analytical Approach
Our analysis of both immigration attitudes and Brexit support follow the same structure for each data set analysed, in which the measures are available. This includes: attitudes towards immigrants (BES – Table 2; IP – Table 3) and Brexit support (BES – Table 4; UKHLS – Table 5). We apply multilevel logistic regression models and report models with the level 2 defined as LA.
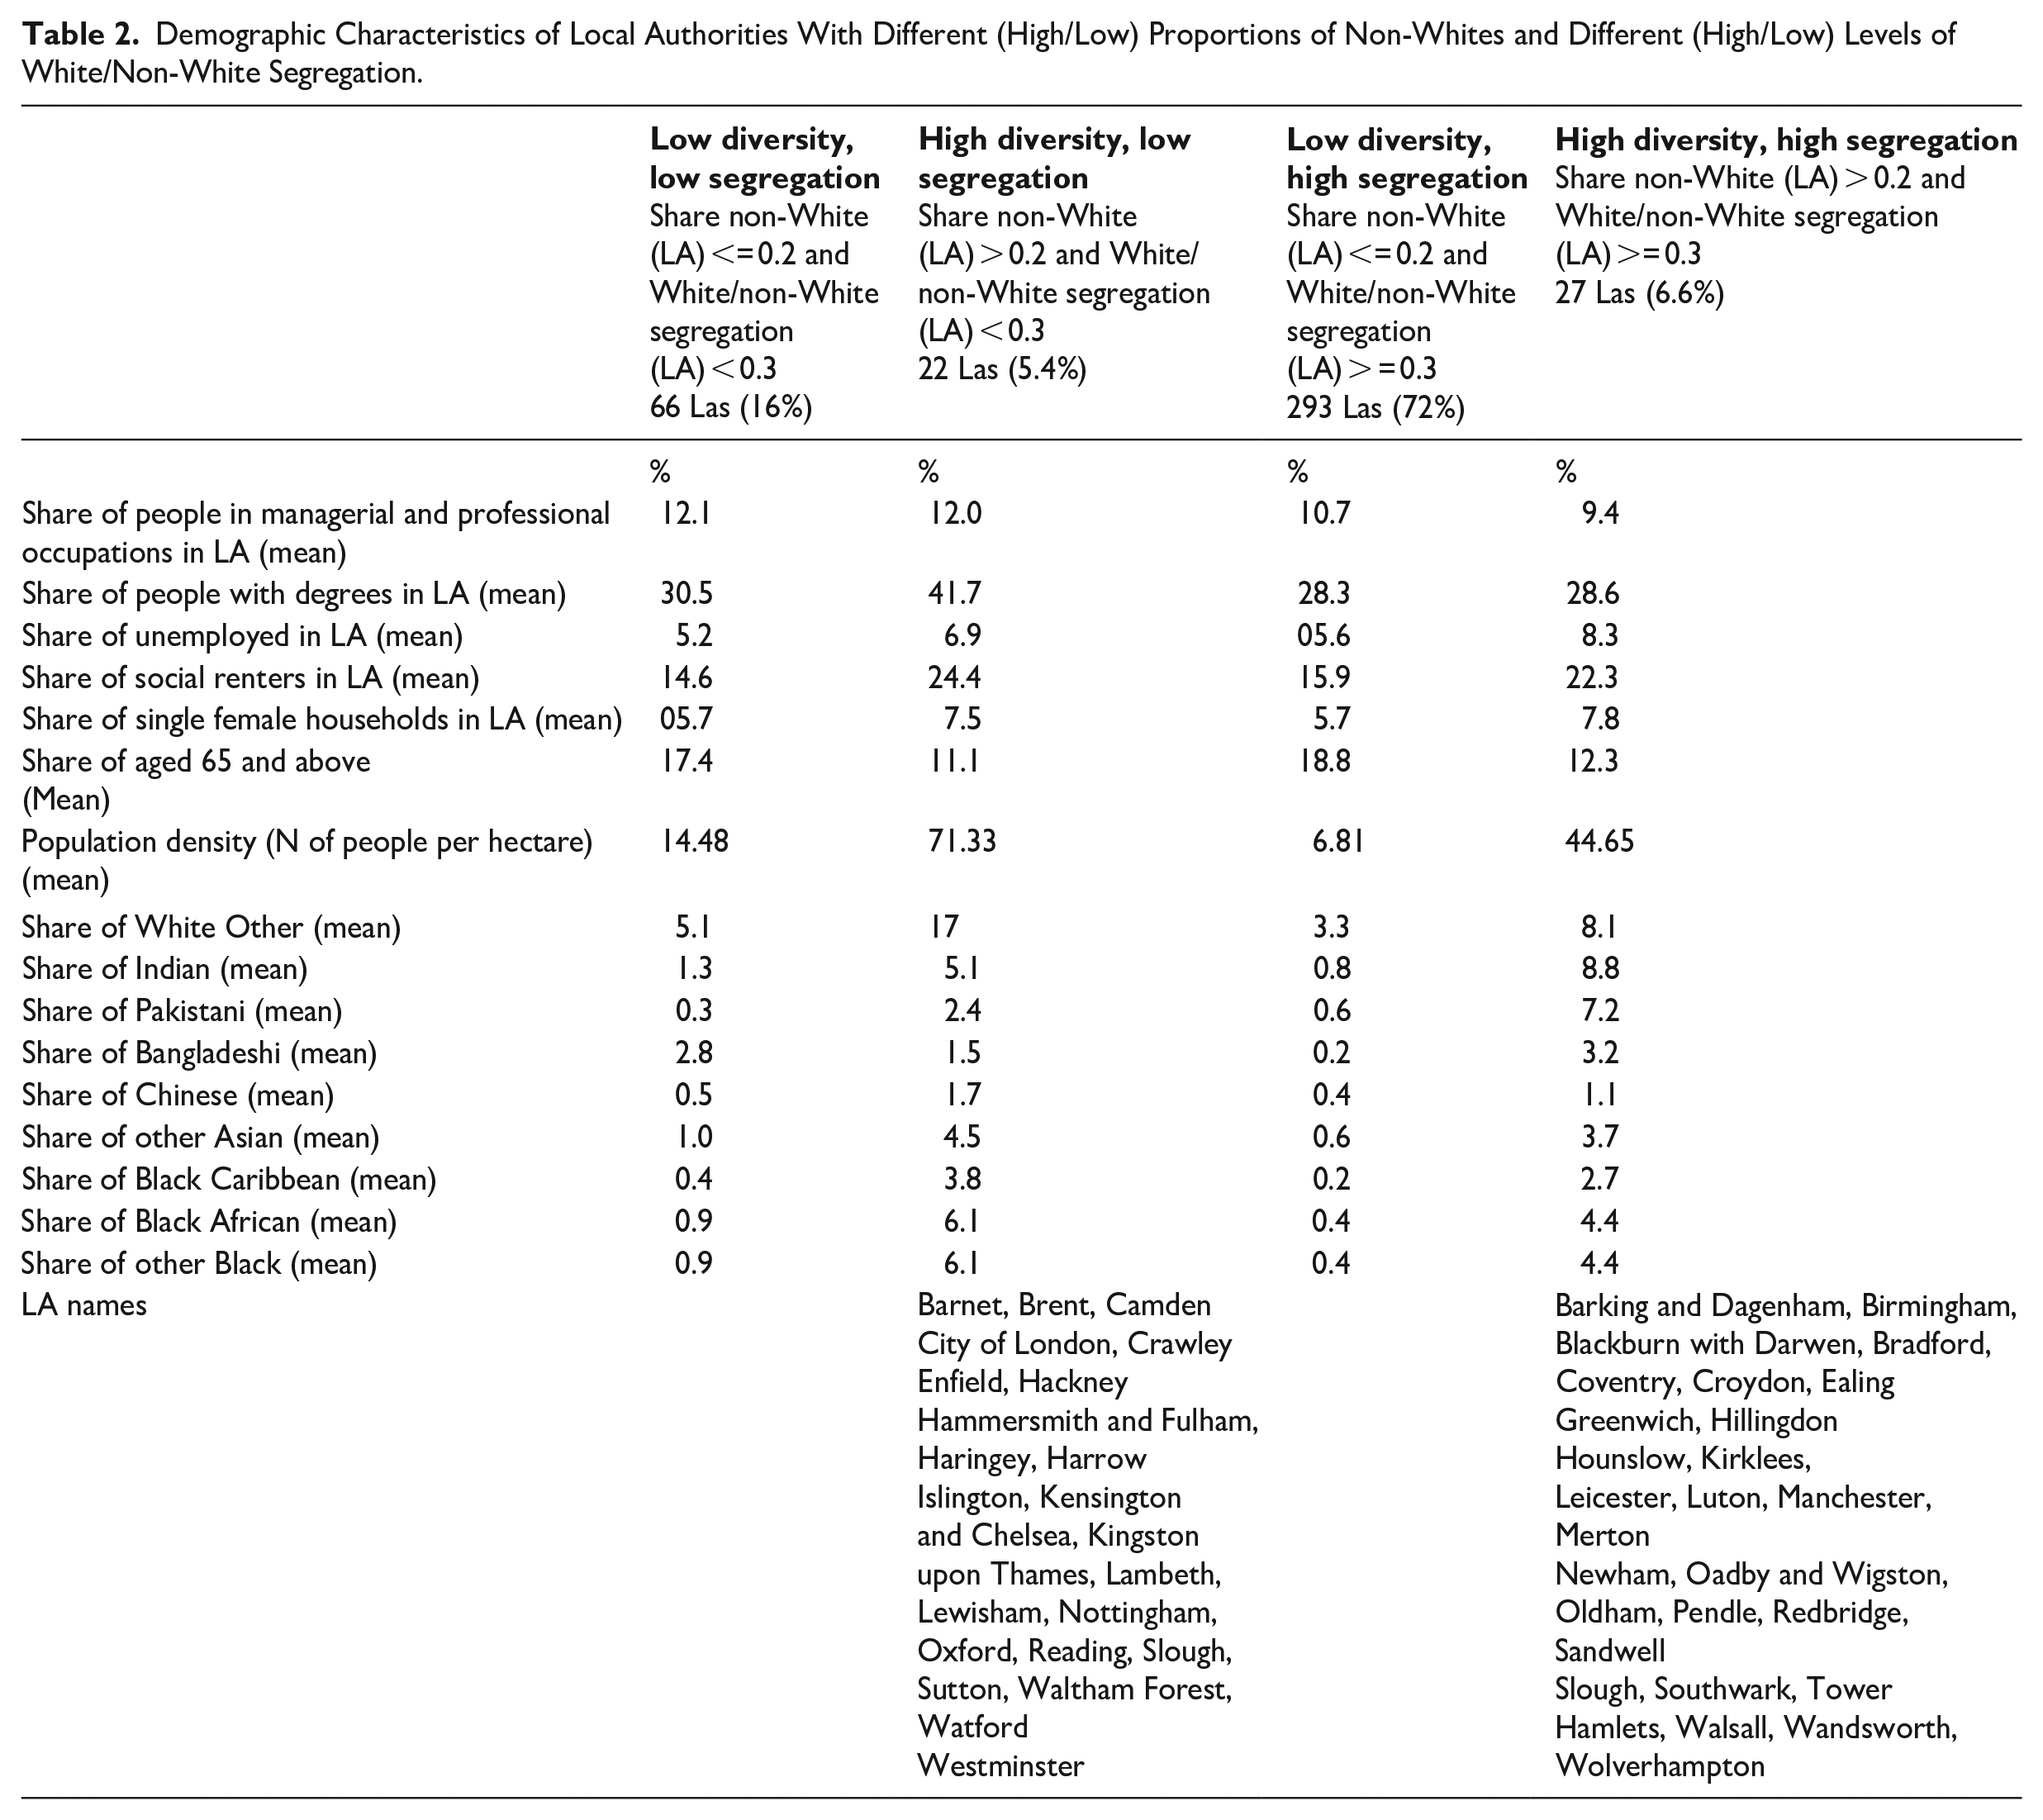
Demographic Characteristics of Local Authorities With Different (High/Low) Proportions of Non-Whites and Different (High/Low) Levels of White/Non-White Segregation.
Multilevel Logistic Regression Models Predicting Anti-Immigrant Attitudes (BES Data).
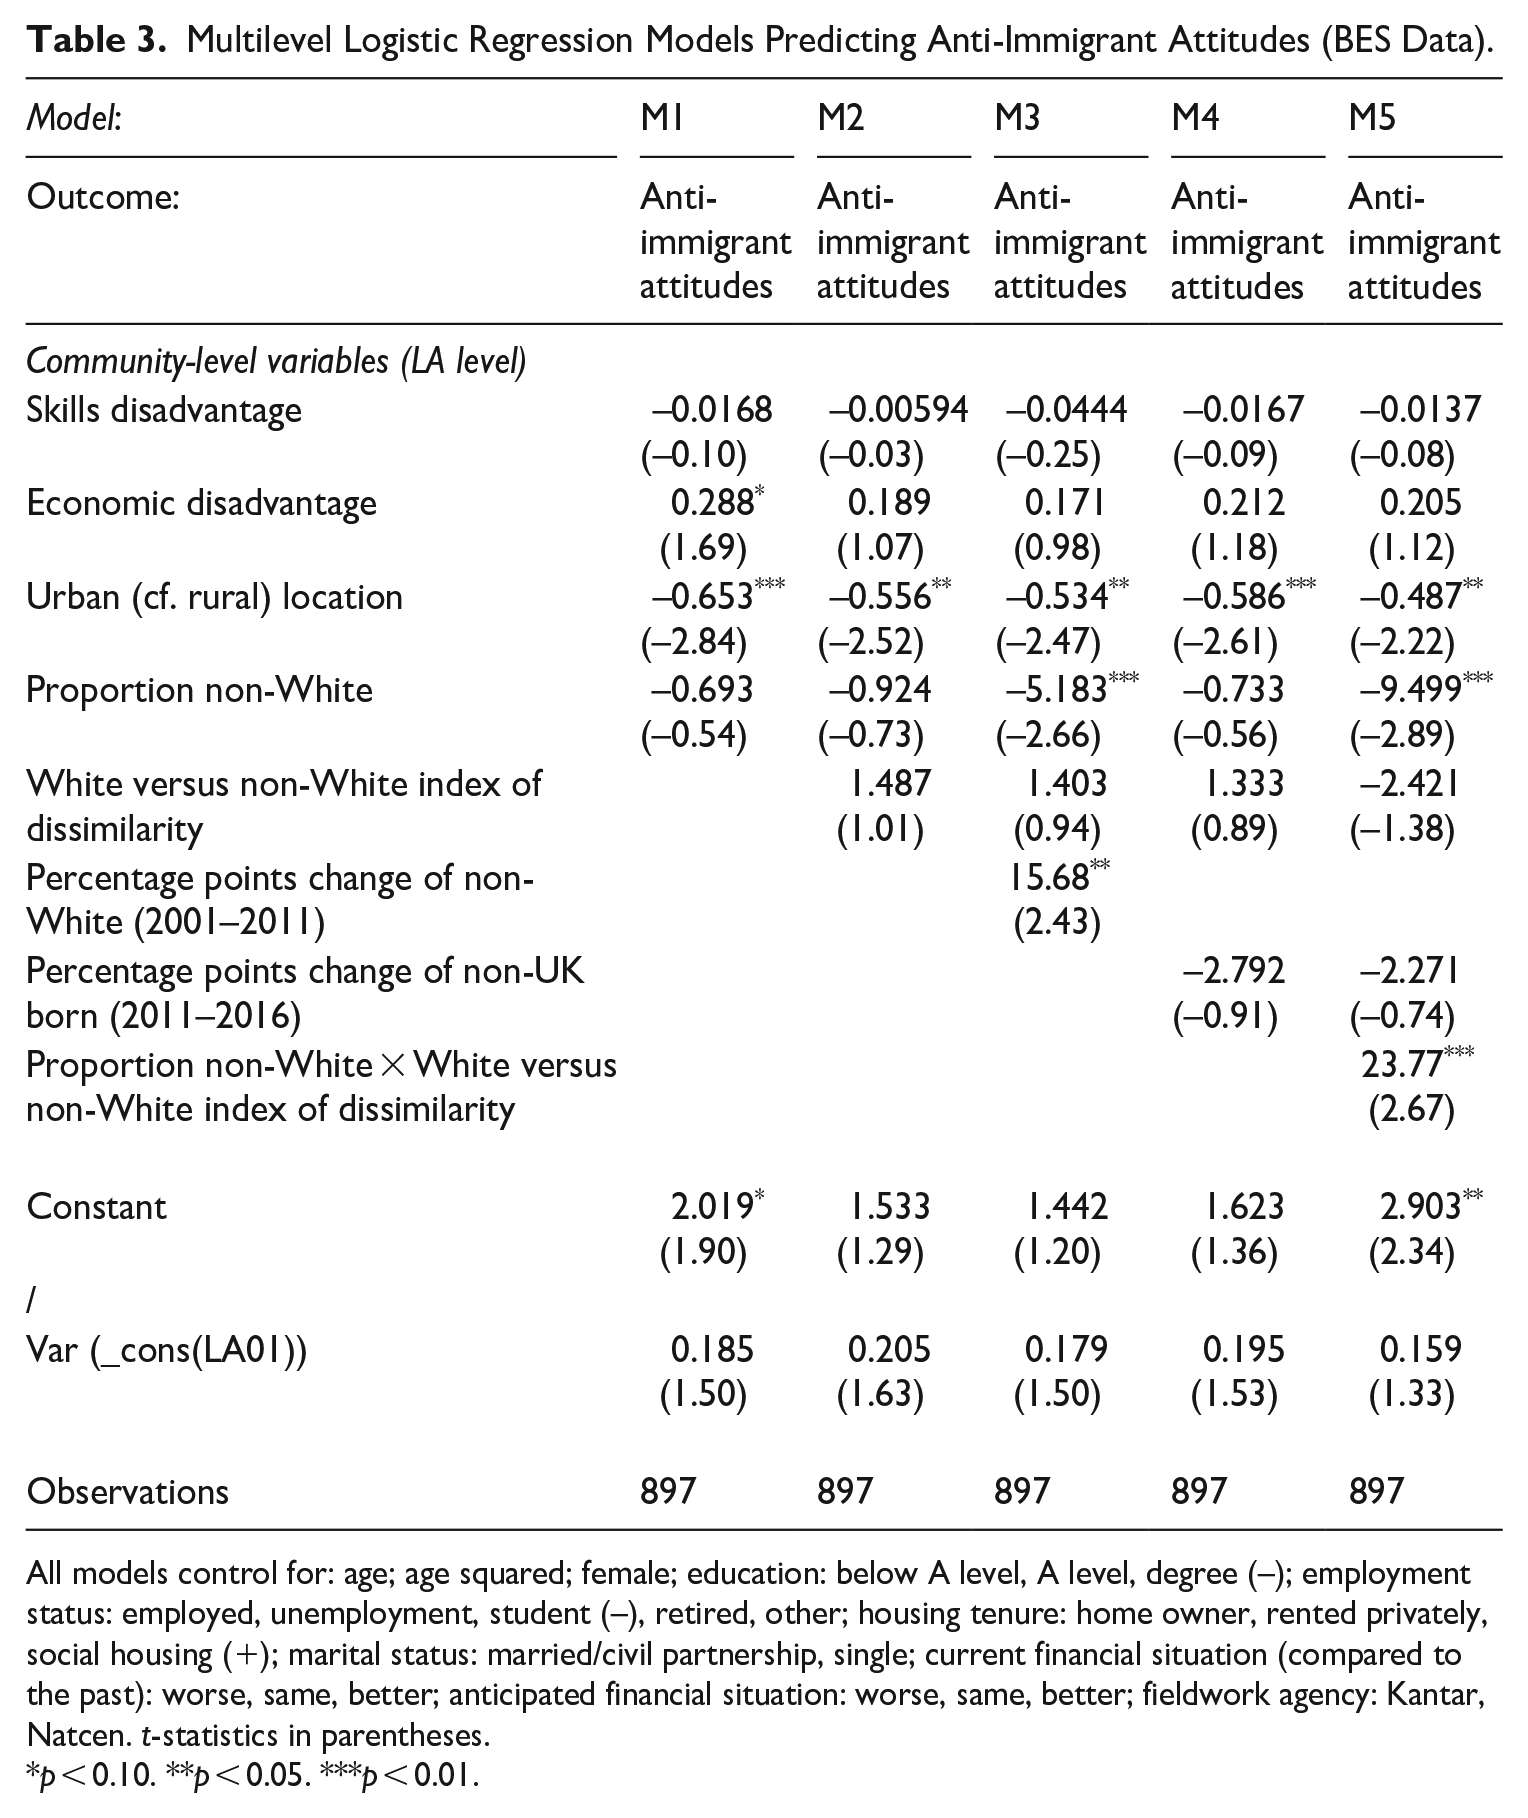
All models control for: age; age squared; female; education: below A level, A level, degree (–); employment status: employed, unemployment, student (–), retired, other; housing tenure: home owner, rented privately, social housing (+); marital status: married/civil partnership, single; current financial situation (compared to the past): worse, same, better; anticipated financial situation: worse, same, better; fieldwork agency: Kantar, Natcen. t-statistics in parentheses.
p < 0.10. **p < 0.05. ***p < 0.01.
Multilevel Logistic Regression Models Predicting Anti-Immigrant Attitudes (IP–UKHLS Data).
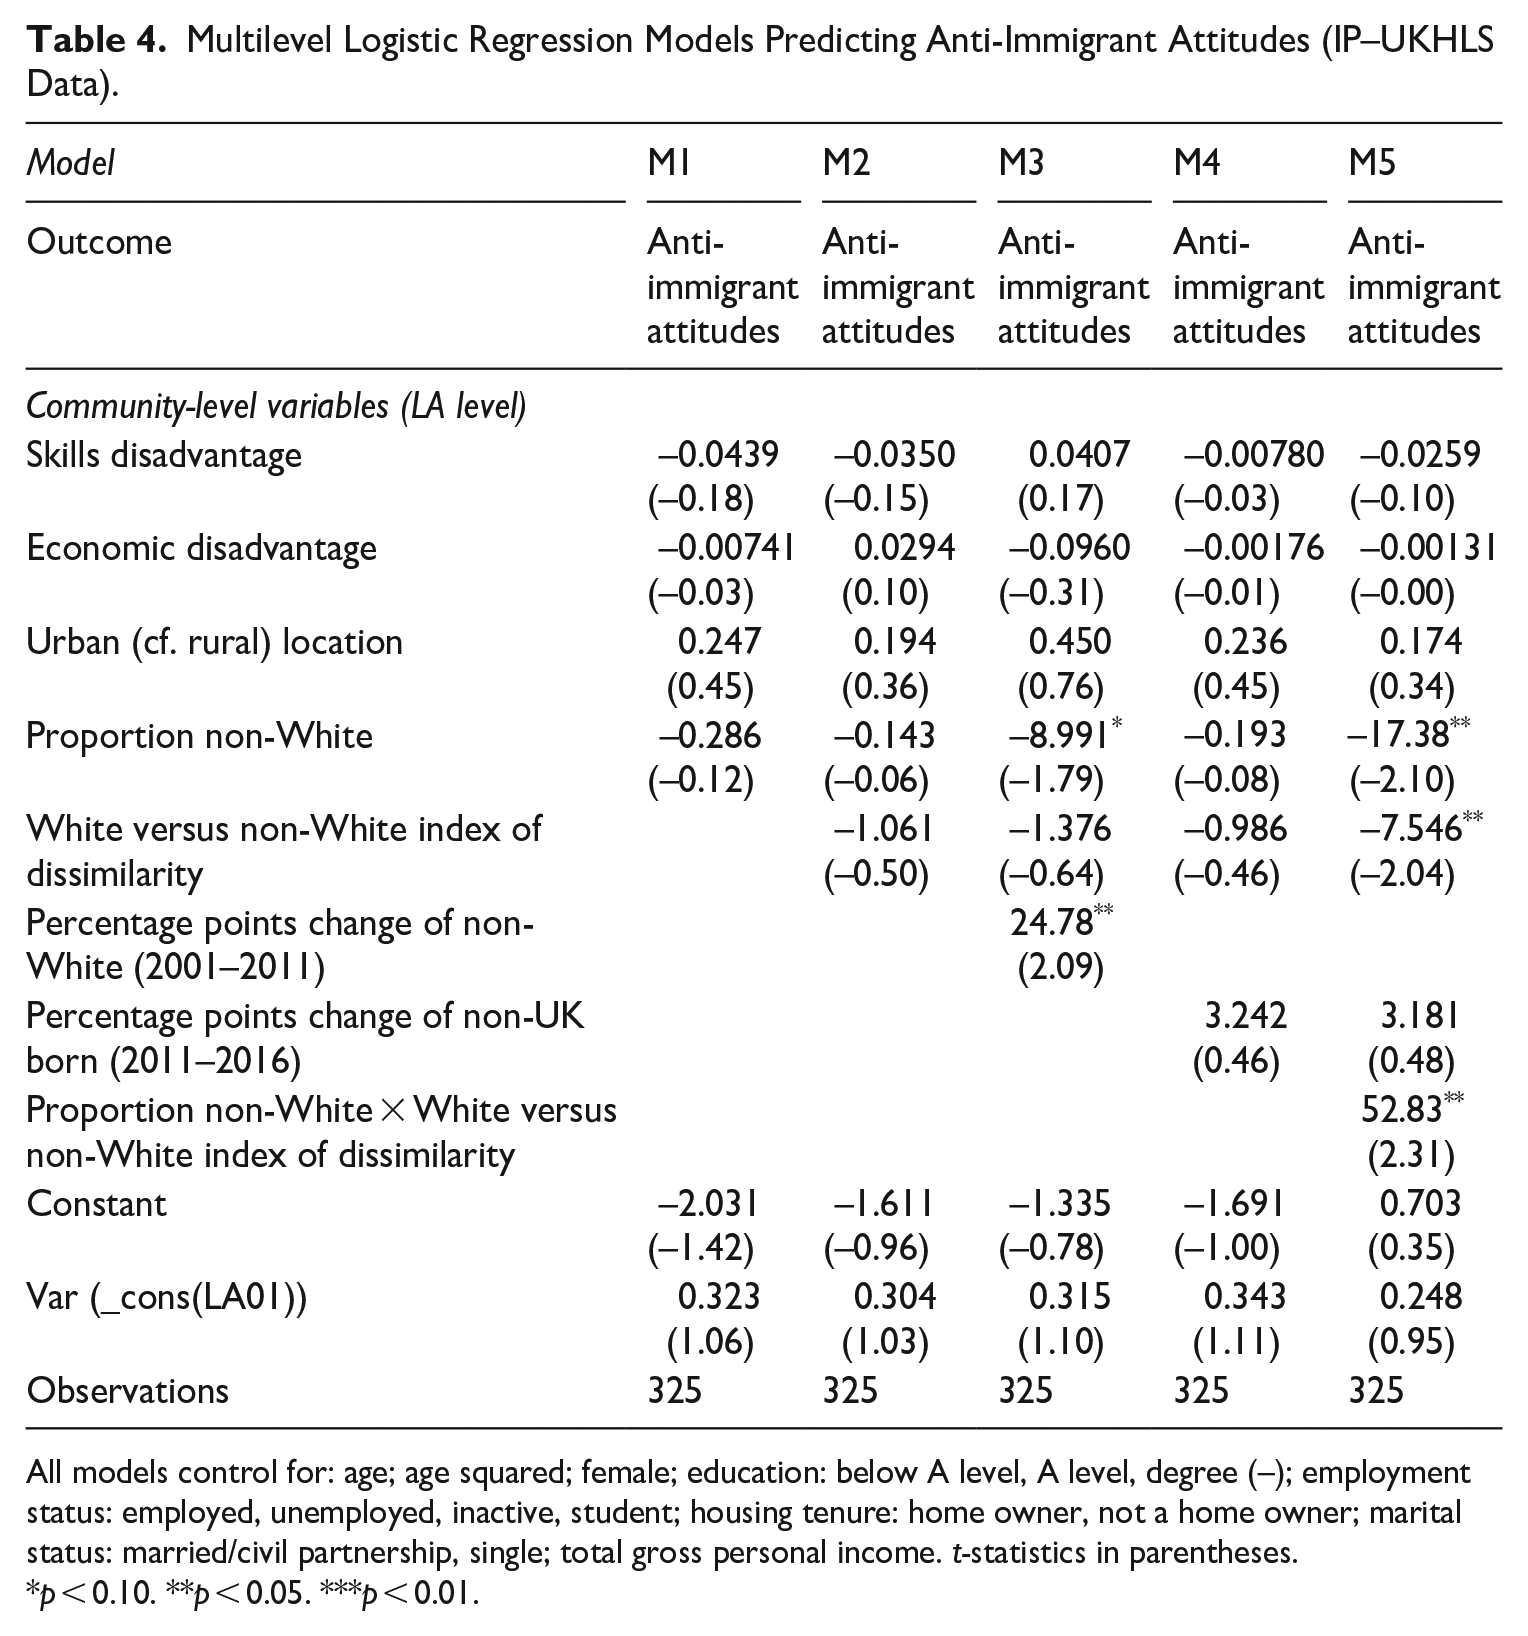
All models control for: age; age squared; female; education: below A level, A level, degree (–); employment status: employed, unemployed, inactive, student; housing tenure: home owner, not a home owner; marital status: married/civil partnership, single; total gross personal income. t-statistics in parentheses.
p < 0.10. **p < 0.05. ***p < 0.01.
Multilevel Logistic Regression Models Predicting Whether Respondent Voted for Brexit (BES Data).
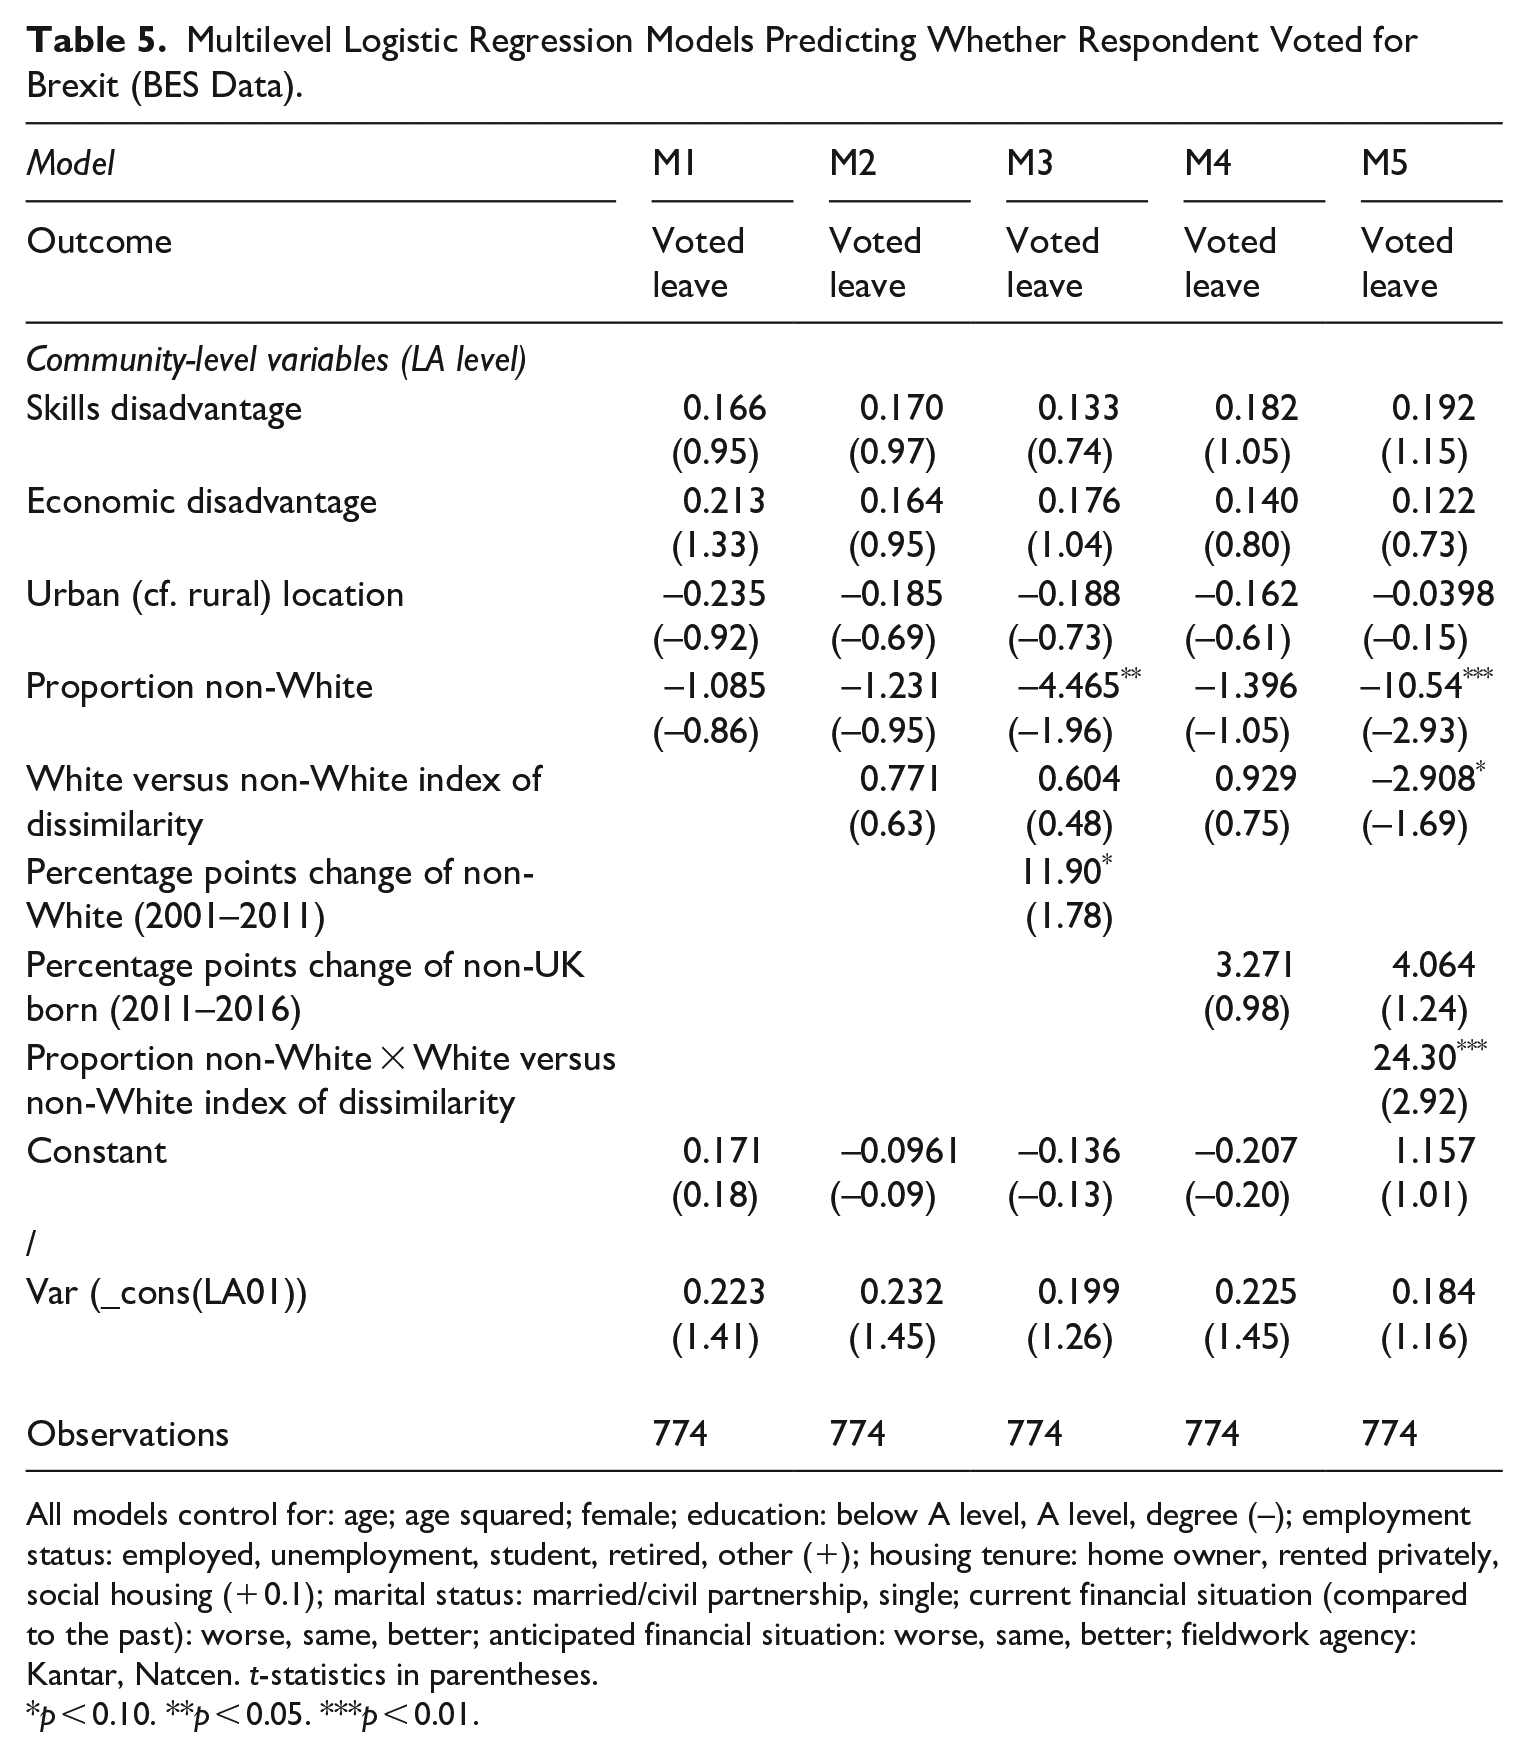
All models control for: age; age squared; female; education: below A level, A level, degree (–); employment status: employed, unemployment, student, retired, other (+); housing tenure: home owner, rented privately, social housing (+ 0.1); marital status: married/civil partnership, single; current financial situation (compared to the past): worse, same, better; anticipated financial situation: worse, same, better; fieldwork agency: Kantar, Natcen. t-statistics in parentheses.
p < 0.10. **p < 0.05. ***p < 0.01.
First, with full individual and community-level controls, we look at the direct effect of ethnic outgroup size defined as proportion non-White (models M1, Tables 2–5). We then include minority–majority segregation measured by the index of dissimilarity (models M2, Tables 2–5). In the next step, we add in the effect of medium-term minority outgroup size change (M3, Tables 2–5) and short-term change in immigrant share (M4, Tables 2–5). We then test, as hypothesised, whether the impact of minority outgroup size depends on (is moderated by) the level of segregation between minority–majority groups. To do so, we include an interaction term between these two measures (M5). Given the high correlation between 2001 and 2011 outgroup size change and the outgroup size level in 2011 (R2 = 0.9), in the final models with interaction effects, we control for the recent immigration change (between 2011 and 2016) rather than 2001–2011 outgroup size change, to avoid issues with multicollinearity.
Finally, we explore the extent to which the hypothesised relationship between area ethnic structure variables and Brexit support is mediated by any impact of area ethnic structure on attitudes to immigrants (solely using the BES data, which contain both measures). To test the significance of any indirect effects of area structure on Brexit support via immigration attitudes, we perform formal mediation testing within a path analysis framework, using generalised structural equation modelling (GSEM) to fit logistic regressions given both outcome (Brexit support) and mediator (immigration attitudes) are binary measures. We use the bootstrap method to estimate the indirect effects with bias-corrected confidence intervals, based on 5000 bootstrap samples (Preacher and Hayes, 2008).
In addition, we explore whether the way we measure the ethnic outgroup shapes our results. To do so, we test whether any effects of the ethnic structure of an area are driven more by outgroups defined as (a) non-White British or (b) non-UK born, as opposed to non-White in our main models. We report and discuss the implications of these alternative operationalisations of the outgroup in the text.
Results
Socio-Demographic Composition of LAs With Different Levels of Diversity and Segregation
Table 6 shows the distribution of key socio-demographic indicators of area composition in four exemplar types of LAs: (a) non-diverse, non-segregated; (b) diverse, non-segregated; (c) non-diverse, non-segregated and (d) diverse, segregated. The diversity cut-off set at 20% non-White at the LA level splits all LAs in England into 75% non-diverse and 25% diverse. We chose the diversity cut-off, so that, there is a visible proportion of non-White and, at the same time, there is still substantive proportion of communities that are classified as diverse. We also experimented with different cut-off points, that is, 15% and 25% non-White and the statistics presented in Table 6 led to substantively similar conclusions. Diverse/non-diverse LAs (based on the 20% non-White cut-off) were then split into two approximately equal groups according to the level of segregation, resulting in a cut-off of segregated/non-segregated communities at 0.3 (of the index of dissimilarity). These two cut-off points (20% for diversity and 0.3 for segregation) splits all LAs into four groups based on their levels of diversity and segregation as described in (a)–(d).
Multilevel Logistic Regression Models Predicting Support for Leaving the EU (UKHLS Data).
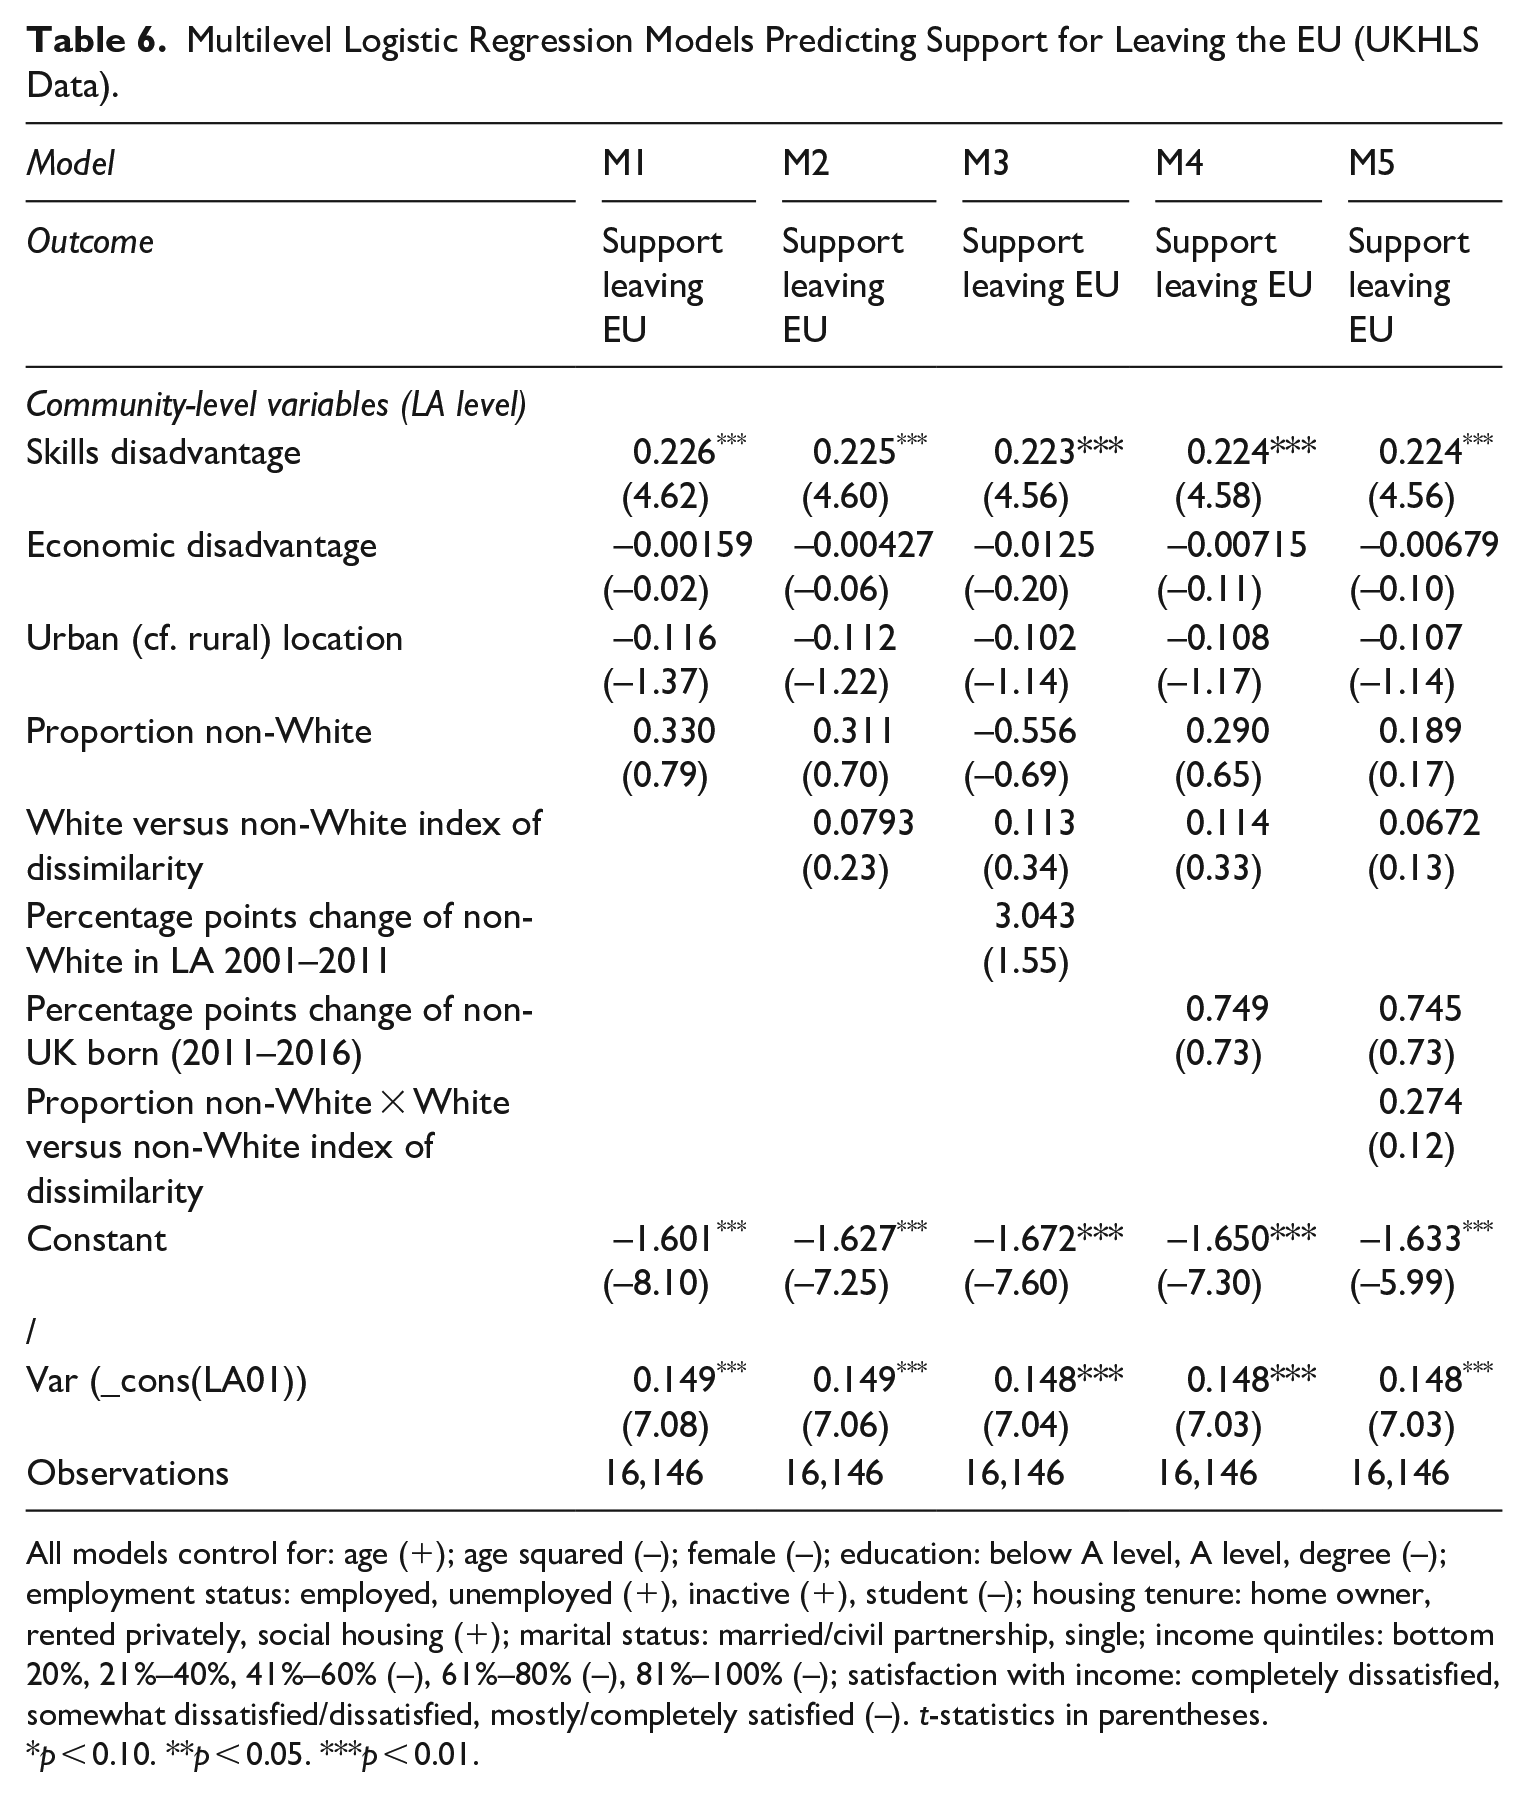
All models control for: age (+); age squared (–); female (–); education: below A level, A level, degree (–); employment status: employed, unemployed (+), inactive (+), student (–); housing tenure: home owner, rented privately, social housing (+); marital status: married/civil partnership, single; income quintiles: bottom 20%, 21%–40%, 41%–60% (–), 61%–80% (–), 81%–100% (–); satisfaction with income: completely dissatisfied, somewhat dissatisfied/dissatisfied, mostly/completely satisfied (–). t-statistics in parentheses.
p < 0.10. **p < 0.05. ***p < 0.01.
To understand the kind of LAs found in each category, we calculated key summary statistics of socio-economic composition based on the 2011 census. As shown in Table 6, ‘diverse non-segregated’ LAs are slightly better off than ‘diverse segregated local authorities’ in terms of some but not all socio-economic indicators. They have a slightly higher proportion of people working in professional/managerial occupations (12% vs 9%) and interestingly a higher proportion of people with higher education (42% vs 29%). However, the unemployment (7% vs 8%), proportion social renters (24% vs 22%), proportion of single female households (8% vs 8%), and proportion of people aged 65+ (11% vs 12%) are very similar in both types. ‘Diverse non-segregated’ places are more likely to be in densely populated areas compared to ‘diverse segregated’ places (average population density: 71 ppl/ha vs 45 pp/ha). Critically, we control for all these characteristics to adjust for possible confounding.
Multivariate Analysis
Individual and Local-Level Characteristics
Regarding the effects of the main individual-level controls, in line with the previous studies, having a university degree and/or being a student is the strongest individual-level predictor of favourable attitudes towards immigrants and a lower likelihood of Brexit support. Women and younger people also tend to be less pro-Brexit, which is also consistent with previous evidence. On the other hand, indicators of economic disadvantage, such as being unemployed or inactive, living in social housing, having a lower income and being generally less subjectively satisfied with one’s financial situation are associated with higher support for Brexit. In the final models, individual-level covariates are more likely to be statistically significant in the UKHLS sample, given its sample size.
Ethnic Structure and Attitudes to Immigrants
At the community level, we first examine the role of community (LA) ethnic structure on attitudes towards immigration, among White British in the BES data (Table 2, Models M1–M5) and the White group in the IP data (Table 3, Models M1–M5). Models using the BES data (Table 2) predict the likelihood of believing that ‘too many immigrants are allowed into this country’, whereas models using the IP data (Table 3) predict the likelihood of believing that immigrants from Muslim, Caribbean and Eastern European countries should not be allowed to ‘come and live in the UK’.
Across both data sets, majority group respondents who live among a larger proportion of ethnic outgroup are not significantly more likely report negative attitudes towards immigrants (accounting for individual-/community-level controls) (M1, Tables 2 and 3). However, whether this association is significant or not depends on whether models adjust for an area’s level of change in its ethnic composition. When measures of change are not included (M1–M2, Tables 2 and 3), outgroup share is not significant. When the amount of medium-term change in the share of non-Whites is included in the models (between 2001 and 2011 censuses), the measure of outgroup share on anti-immigrant attitudes is negative and statistically significant (M3, Tables 2 and 3). In other words, White British living in areas with a higher share of non-Whites have more positive attitudes towards immigrants if we account for the pace of ethnic change. In addition, larger medium-term (2001–2011) changes in the share of non-Whites are positively and significantly associated with anti-immigrant sentiment in both BES/IP data sets (M3, Tables 2 and 3). Shorter-term (2011–2016) changes in the share of people not born in the United Kingdom, however, are not associated with immigration attitudes in either BES/IP data sets (M4, Tables 2 and 3). As such, medium-term (2001–2011) changes in the share of non-Whites appear more salient for immigration attitudes. Overall, the above findings demonstrate evidence in favour of: H1a, that larger shares of outgroup are negatively associated with anti-immigrant sentiment, at least after adjusting for the change in the share of non-Whites (2001–2011).
Turning to the effects of segregation, across most specifications, higher segregation does not have a significant overall association with anti-immigrant sentiment in either BES or IP data (M2–M4, Tables 2 and 3). Thus, we find little support for H2a: an overall effect of segregation on immigration attitudes. We next test whether the effects of segregation and outgroup size are conditional on one another (expressed by the interaction term). Critically, in both the BES and IP data (M5, Tables 2 and 3) we observe a significant, positive interaction between diversity and segregation. This indicates that the effect of outgroup share on anti-immigrant sentiment is more positive in areas that also have higher levels of segregation.
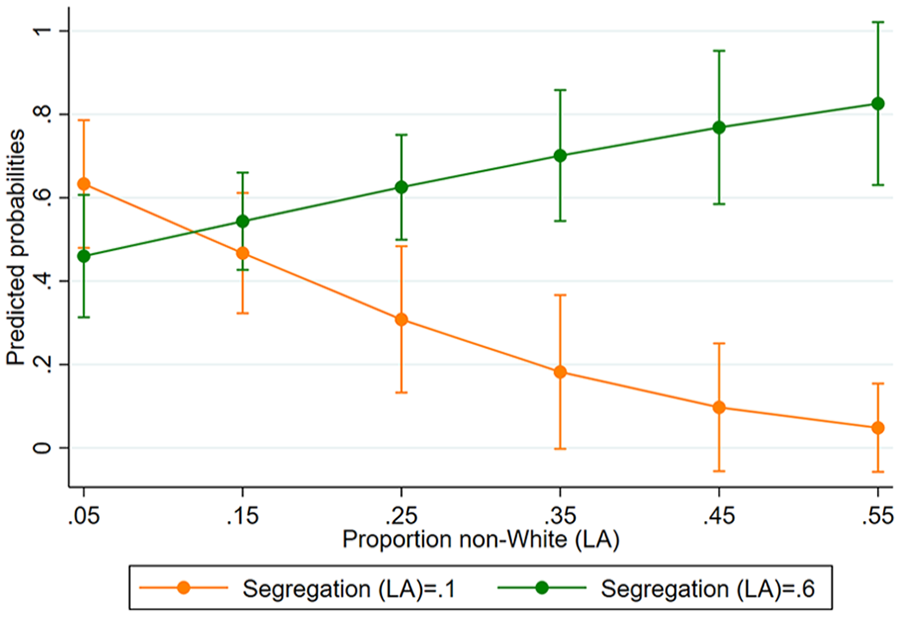
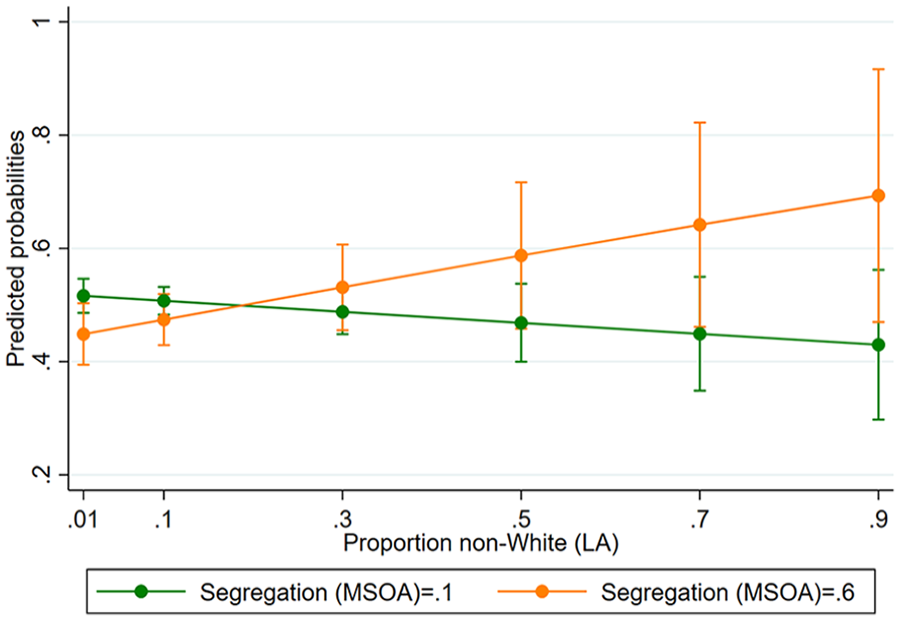
To examine how this interaction translates into levels of anti-immigrant sentiment among our samples, Figure 1 (BES, based on M5, Table 2) and Figure 2 (IP, based on M5, Table 3) show the predicted probabilities of holding negative attitudes towards immigrants across different levels of non-White share in the community. Both figures demonstrate this relationship in less segregated areas (an index of dissimilarity of 0.1) and more segregated areas (an index of dissimilarity of 0.6), based on previous definitions of higher and lower segregation in the literature (Massey and Denton, 1993). Across both data sets, respondents living in communities with low proportions of minority population have similar attitudes towards immigrants regardless of the level of segregation. However, immigration attitudes of those living in communities with a larger minority share are strikingly different depending on whether their communities are more integrated or segregated. In the BES data (Figure 1), those living in higher minority share communities with higher levels of segregation report much higher negative immigration attitudes. On the other hand, those living in similarly diverse but integrated communities are much less likely to hold negative attitudes towards immigrants. Similar patterns of polarisation are also observed in the IP sample (Figure 2).
Predicted Probabilities of Anti-Immigrant Attitudes (With 95% Cis), BES Sample.
Predicted Probabilities of Anti-Immigrant Attitudes (With 95% Cis), IP Sample.
A complementary way of exploring how the relationship between non-White share in an area and anti-immigrant sentiment is conditional on the level of segregation is to look at the marginal effects of non-White share on anti-immigrant sentiment at varying discrete levels of segregation. Figures A1 and A2 (Supplementary Appendix) show this relationship for anti-immigrant sentiment in the BES data (based on M5, Table 2) and the IP data (based on M5, Table 3), and complement Figures 2 and 3, respectively. Both these figures show that at lower levels of segregation, the marginal effect of non-White share on anti-immigrant sentiment is negative. However, as the level of segregation increases, this negative relationship gets smaller and less statistically significant, until an index of dissimilarity of around 0.3–0.4, where there is essentially no relationship between non-White share and anti-immigrant sentiment. After this point, as the level of segregation increases, the marginal effect of non-White share on anti-immigrant sentiment becomes increasingly positive and more statistically significant. These findings provide strong support for H2c.
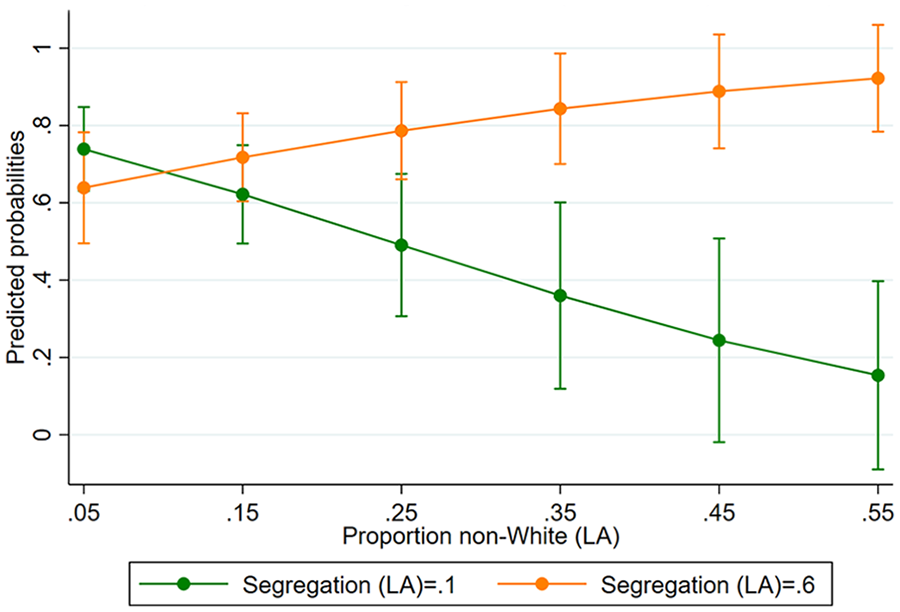
Predicted Probabilities of Brexit Vote (With 95% Cis), BES Sample.
Ethnic Structure and Brexit Support
We next examine the role of community (LA) ethnic structure for our key dependent variable – Brexit support, tested on the BES (Table 4) and UKHLS (rather than IP) data (Table 5). Models M1–M5 replicate the previous analyses on immigration attitudes but now examine, in the BES models, whether someone declared they voted for Brexit in the EU referendum (restricted to the validated vote sample), and in the UKHLS models, whether a respondent reports a preference for staying/leaving the European Union.
Generally, the findings for Brexit support in the BES data closely mirror the findings for anti-immigrant sentiment. Outgroup share is not associated with Brexit support (M1, Table 4) until we adjust models for medium-term ethnic change in the non-White share (M3, Table 4), after which a higher minority share is significantly associated with less Brexit support (evidence towards H1b). Similarly, a larger medium-term change in the share of non-Whites is significantly associated with a higher likelihood of voting for Brexit (M3, Table 4). In addition, as with immigration attitudes, a larger recent change in the share of non-UK born residents (2011–2016) is not significantly associated with Brexit support (M4, Table 4). We also see that segregation has no overall association with Brexit support (M2, Table 4), providing evidence against H2b. Yet, as with anti-immigrant sentiment, there is a significant, positive interaction between minority share and segregation for Brexit support (M5, Table 4), suggesting that areas with a higher minority share have a more positive association with Brexit support when they are also more segregated.
To explore the implications of this interaction for levels of Brexit support, Figure 3 (BES, based on M5, Table 4), plots predicted probabilities of voting ‘Leave’ across the share of non-White in the community, but explores this relationship in more and less segregated areas. As with anti-immigrant sentiment, majority group respondents in more homogeneous areas tend to report similar probabilities of voting ‘Leave’ regardless of how integrated or segregated their areas are. In high minority share, segregated areas, however, this probability rises significantly, while in high minority share, integrated areas the probability declines significantly. Increasing minority share thus appears to drive an increasing polarisation in support for Brexit depending on how segregated the area is (providing strong support for H2d).
We complement this figure by looking at the marginal effects of non-White share on Brexit vote at varying discrete levels of segregation (Figure A3, Supplementary Appendix) in the BES data (based on M5, Table 4). This again shows how, at low levels of segregation, the marginal effect of non-White share on Brexit vote is negative. This negative effect becomes weaker and less statistically significant up to around a level of segregation of 0.4. After which, the marginal effect becomes increasingly positive and statistically significant as segregation increases. These findings provide strong support for H2c.
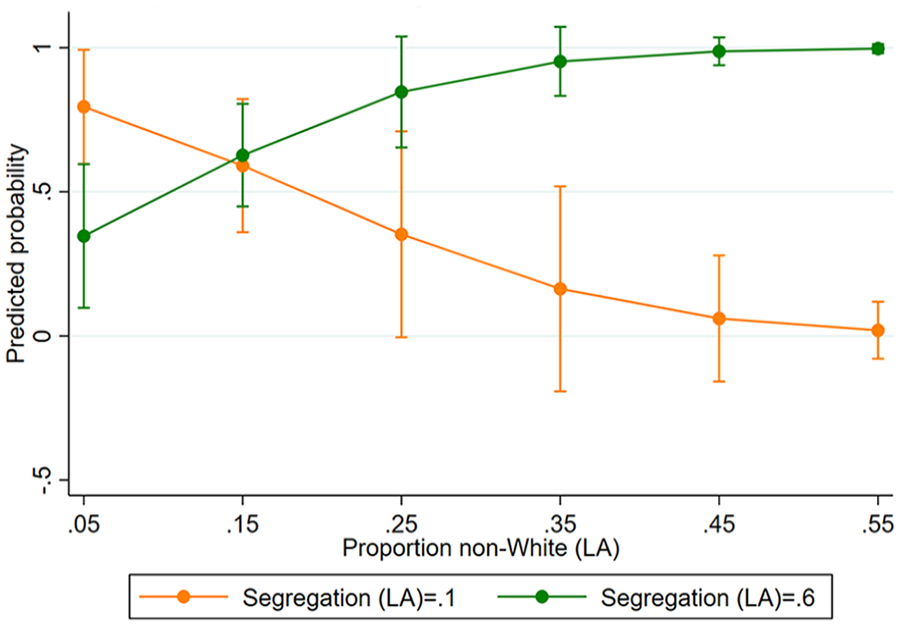
Despite the significant relationships in the BES data, we detect no significant effects of ethnic structure (non-White share, change in non-White share or segregation) on Brexit support at the LA level in the UKHLS data (Table 5). Nor do we observe a significant interaction between minority share and segregation (Figure 4) (although coefficient signs point in the same direction as the BES analysis). Additional analyses do show, however, that the interaction term is significant in the expected direction when we examine relationships across the smaller spatial scale of the Middle Super Output Area level. 4
Predicted Probabilities of Brexit Vote (With 95% Cis), UKHLS Sample.
Mediating Role of Anti-Immigration Sentiment in Brexit Support
We next seek to examine whether attitudes towards immigration mediate the observed relationships between community ethnic structure and Brexit support. As discussed, this mediation analysis is limited to the BES sample, given it is the only data set containing both outcome variables. This is conducted using GSEM (see Supplementary Table A1 for full model results).
We test the hypothesised indirect effects of segregation and the size of the non-White population in an LA. We previously observed a significant interaction effect between the proportion of non-Whites in a LA and its level of residential segregation for both anti-immigrant attitudes and Brexit support. Increasing proportions of non-White had a positive association with residents’ anti-immigrant attitudes and Brexit support when occurring in more segregated LAs and a negative association when occurring in more integrated LAs. As such, one reason why an increasing proportion of non-Whites is positively associated with Brexit support in segregated areas (and negatively in integrated areas) may be because it has a positive indirect effect via higher anti-immigrant sentiment (and a negative indirect effect via lower anti-immigrant sentiment in integrated areas).
To examine this, we perform a moderated mediation analysis to formally test the indirect effects of the proportion non-White at different levels of residential segregation (see Supplementary Table A1 for results). Table A2 demonstrates that the proportion non-White has a significant negative indirect effect on Brexit support via lower anti-immigrant sentiment in more residentially integrated areas (at the minimum value of segregation, and the first, the fifth and the tenth percentiles of segregation) but that this negative association becomes weaker and less significant as segregation increases. However, the proportion non-White also has a significant positive indirect effect on Brexit support via higher anti-immigrant sentiment in more segregated areas (at the maximum value of segregation, and the 99th and the 95th percentiles of segregation) but that the strength and significance of this association becomes weaker as segregation decreases. In sum, anti-immigrant sentiment mediates part of the more positive (negative) relationship between proportion non-White and Brexit support in more segregated (integrated) areas. However, even after accounting for immigration attitudes, the interaction term between the percent non-White and White/non-White segregation remains significant, suggesting that percent non-White continues to have a relationship with Brexit support outside of attitudes towards immigration alone (Table A1). This provides partial support for H3: that the reason an increasing non-White share in segregated communities is associated with more Brexit support and an increasing share in integrated communities associated with less, can be accounted for by residents’ attitudes towards immigration.
Measuring the Outgroup: Non-White, Non-White British and Non-UK Born
Thus far, we have explored how the share of an area that is non-White, and segregation between Whites and non-Whites, shape the immigration attitudes and Brexit support among the White British (majority group) population. This is based on suggestions that visible minorities, rather than migrants alone, were particularly salient in the context of the EU referendum (Goodwin and Heath, 2016). However, we also explicitly test whether this is the case by replicating all the main analyses but using two different operationalisations of the outgroup. First, we test the role of share of non-White British, and segregation between White British and non-White British (Tables A7–A10, Supplementary Appendix). This allows us to examine whether treating the ‘White Other’ group as part of the outgroup changes our findings, given, for example, the presence of ‘Other Whites’, such as Eastern Europeans, may also change the ethnic character of an area (e.g. the types of shops, or sorts of food sold in supermarkets) and speak different languages in the neighbourhood. Second, we test the role of the share of non-UK born and segregation between the UK born and non-UK born group (Tables A11–A14, Supplementary analysis). This allows us to examine whether migrant status rather than ethnic status is perhaps the more salient boundary.
The analyses show a high degree of consistency in findings between operationalising the outgroup as non-White or non-White British, with slightly stronger relationships observed when using the former. Substantively similar findings are found for the anti-immigrant sentiment outcomes when operationalising the outgroup as non-UK born (although the relationships are somewhat weaker). However, the interaction term between share of non-UK born in the community, and UK born versus non-UK born segregation, is not statistically significant in predicting Brexit vote (although the relationship is in a similar direction). These results provide some initial evidence that the ethnic status of people in a community may have been just as, if not somewhat more, important for immigration attitudes and Brexit vote than the migrant status of residents alone. However, disentangling the relative importance of ethnic versus migrant status of residents is difficult at the community level, given the very high correlations between non-White share, non-White British share and non-UK born share in an area. Future research seeking to distinguish such differences is required (see below).
Discussion
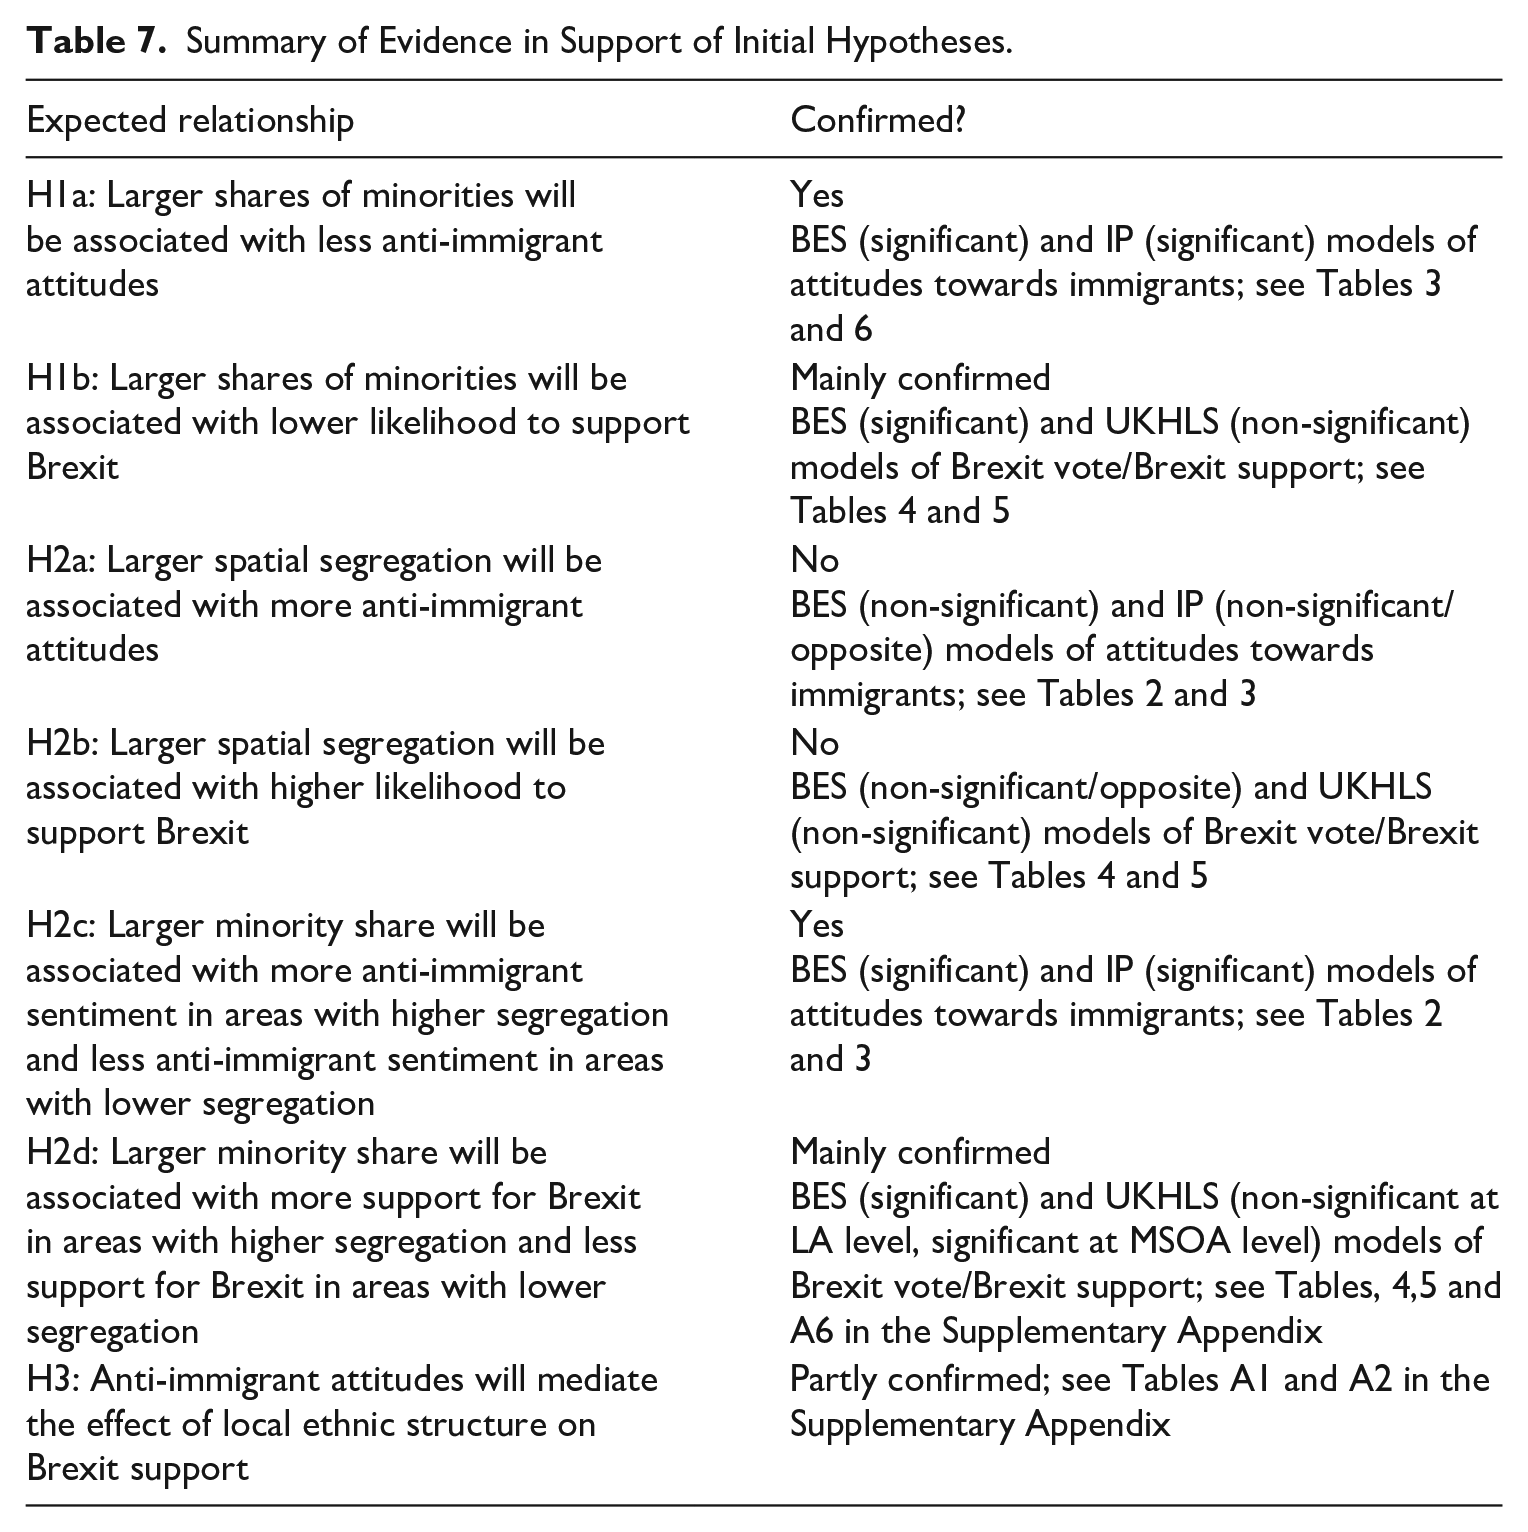
This article sought to explore how the ethnic structure of residential communities shapes majority group attitudes towards immigration, and the extent to which such processes have behavioural manifestations in the form of voting leave in the UK–EU referendum. We examined how these attitudinal and behavioural outcomes are affected by the relative size of ethnic outgroups in an area, the amount of recent ethnic change, and, in a novel contribution, the level of segregation and the intersection between the size of ethnic outgroups and the level of residential segregation. In Table 7, we summarise the evidence in support of our initial hypotheses and discuss the findings below.
Summary of Evidence in Support of Initial Hypotheses.
We observe that majority group individuals living among higher shares of non-Whites are less likely to vote for Brexit while those in areas experiencing a larger increase in the share of non-Whites (between 2001 and 2011) are more likely to vote for Brexit. We similarly observe that a higher share of non-Whites in an area is associated with less anti-immigrant sentiment, but a larger increase in the share of non-Whites (between 2001 and 2011) is associated with more anti-immigrant sentiment. These findings are in line with previous studies which suggest that living in more diverse areas may foster positive intergroup attitudes (e.g. through contact opportunities) while larger recent changes in diversity may harm attitudes (e.g. through perceived threat stemming from ‘acculturative stress’).
Residential segregation itself does not have an overall association with immigration attitudes, nor is it associated with support for Brexit. However, across multiple data sets, we find that the association between outgroup size and both attitudes and voting behaviour is moderated by the level of segregation in an area. It is where groups are more segregated from one another that larger outgroup size is associated with greater Brexit support; and where groups are integrated, larger outgroup size is associated with lower Brexit support. Testing also shows that an important part of why voting for Brexit is higher in diverse, segregated areas can be accounted for by more negative attitudes towards immigration among residents in these areas. However, not all of the effect of local ethnic structure variables on Brexit vote is mediated by anti-immigrant attitudes and there are a number of reasons for why this can be the case. For one, our measure captures only a particular aspect of anti-immigrant attitudes – support or opposition for more immigration. Given the ‘taking back control’ rhetoric that dominated pro-Brexit campaign, the opposition towards immigration is arguably the most relevant measure. However, we also know that those who supported Brexit tended to express anti-diversity concerns beyond simple immigration control (Evans and Kelley, 2019). Therefore, it is likely that a more comprehensive anti-diversity attitudes measure would be a better mediator of the contextual ethnic structure effects on Brexit support. Second, it is possible that local ethnic structure affected Brexit support through other channels, such as social influence and targeted campaigning. Unfortunately, our data sets do not contain measures that would allow us to assess those effects. Testing different mechanisms through which local ethnic structure shapes political behaviour would be an important goal for future research.
To return to our original hypotheses, we find evidence of an overall negative association between the share of non-Whites in an area and anti-immigrant sentiment (H1a) and Brexit support (H1b) (after adjusting for the change in the share of non-Whites). However, we do not find evidence to support an overall positive association between segregation in an area and either anti-immigrant sentiment (H2a) or Brexit support (H2b). What we do see though is strong evidence in support of H2c and H2d. That the effect of non-White share and residential segregation on anti-immigrant sentiment and Brexit support are conditional on one another. In particular, that higher minority share is associated with more anti-immigrant sentiment in areas with higher segregation and less anti-immigrant sentiment in areas with lower segregation (H2c), and higher minority share is associated with more support for Brexit in areas with higher segregation and less support for Brexit in areas with lower segregation (H2d). We also find partial support for H3: that part (but not all) of the reason non-White share and segregation are associated with Brexit support appears to come through residents’ attitudes towards immigration.
Taken together, these findings have important implications for understanding the role residential communities played in Brexit and for immigration attitudes more widely. Prior work suggests that people living in areas with higher shares of ethnic minorities were less likely to support Brexit. This study adds a key condition to this perspective: Brexit support depended on the level of segregation in communities. Increasing minority share across England’s communities may thus have contributed to the polarisation of the electorate over the Brexit issue, with residents of high minority, spatially integrated communities increasingly less likely to support Brexit and those in high minority, spatially segregated communities increasingly more likely. In addition, the findings may provide some insights into the mixed evidence base for the link between outgroup share in an area and residents’ anti-immigrant sentiment. Competing evidence for positive and negative effects, as well as the significant number of studies demonstrating no association, could be partly shaped by differing levels of segregation across contexts. Beginning to account for the moderating role of segregation in future studies would be useful for testing its generalisability and potentially resolving the mixed findings across contexts.
We also find that the effect of change in the share of ethnic outgroup in an area depends on how it is measured. Only the medium-term change (2001–2011) in the share of non-White residents, and not shorter-term (2011–2016) change in the share of non-UK born residents has a statistically significant association on our outcome measures (which are captured in 2016/2017). There may be several reasons for this difference. The most obvious may be that the latter measure captures changes in the share of people born abroad, while the former captures changes in the share of non-Whites. It may be that it is changes in non-White that matters most. However, we tested a measure of medium-term change in the share of people born abroad over the 2001–2011 period, which produced substantively identical results to the change in share of non-White over the same period. A second possibility is that it takes time for changes in people’s residential context to manifest themselves as hostility, with attitude changes lagging behind changes in context. Therefore, while recent changes (2011–2016) have little effect, changes in the medium-term past (2001–2011) manifest themselves as current anti-immigrant sentiment. Another explanation could be simply that the medium term (2001–2011) was a period of greater increases in immigration in the United Kingdom than the shorter term (2011–2016) period directly prior to the UK–EU referendum. As such, the latter variable may have much less variance. A final explanation is that the data for the 2001–2011 period are more accurate, being based on UK Census data, while the data for the period 2011–2016 are estimates generated from various administrative data sources, for example, the International Passenger Survey (IPS), National Insurance Number registrations or general practitioner (GP) registrations.
Despite the insights gleaned, this study has limitations. First, given the cross-sectional nature of the data, we cannot discount the possibility that our findings may be driven by endogeneity. In particular, segregation may be as much a product of intergroup attitudes, such as prejudice/ethnocentrism, as a driver of them (Clark and Fossett, 2008; Krysan et al., 2009). As such, segregation may not be moderating the effect of outgroup size on intergroup attitudes; instead, segregation may be a product of where increasing outgroup size has triggered threat, and thus segregation. Our data preclude more robust tests of our causal framework, although prior longitudinal and experimental analysis suggest that segregation’s effect on intergroup attitudes may be, in part, causal (Enos and Celaya, 2018; Laurence et al., 2019). Future work will seek to explore more causally robust approaches to establish how intersecting patterns of minority outgroup share, the pace of change and segregation shapes both political attitudes and behaviours. In addition, the present article focusses on the size of, and segregation between, the ethnic majority group (White) and ethnic minority group (non-White) in communities. However, potentially, the dynamics observed here may differ for different ethnic minority sub-groups. For example, the size of, and level of segregation from, the Asian population in an area may have different effects on White British attitudes compared to the size of, and level of segregation from, the Black population in an area. Future research will explore whether such minority group-specific differences exist.
Supplemental Material
sj-docx-1-psx-10.1177_00323217241261748 – Supplemental material for The Role of Ethnic Diversity and Residential Segregation in Shaping Anti-Immigrant Sentiment and Support for Brexit
Supplemental material, sj-docx-1-psx-10.1177_00323217241261748 for The Role of Ethnic Diversity and Residential Segregation in Shaping Anti-Immigrant Sentiment and Support for Brexit by Magda Borkowska and James Laurence in Political Studies
Footnotes
Declaration of Conflicting Interests
The author(s) declared no potential conflicts of interest with respect to the research, authorship, and/or publication of this article.
Funding
The author(s) disclosed receipt of the following financial support for the research, authorship, and/or publication of this article: This work was supported by Economic and Social Research Council: (grant nos: ES/W00349X/1 and ES/S012486/1).
Supplemental Material
Additional Supplementary Information may be found with the online version of this article.
Contents.
Table A1 Generalised Structural Equation Model Fitting Logistic Regression to Test Mediating Role of Anti-Immigrant Sentiment for Brexit Support; Local Authority as Level 2 Unit; Ethnic Outgroup Defined as Non-White.
Table A2 Indirect Effects of Proportion non-White on Brexit Support Via Anti-Immigrant Attitudes Conditional on Level of Residential Segregation; Local Authority as Level 2 Unit.
Table A3 Multilevel Logistic Regression Models Predicting Anti-Immigrant Attitudes (BES Data); MSOA as Level 2; Outgroup Defined as Non-White.
Table A4 Multilevel Logistic Regression Models Predicting Whether Respondent Voted for Brexit (BES Data); MSOA as Level 2; Outgroup Defined as Non-White.
Table A5 Multilevel Logistic Regression Models Predicting Anti-Immigrant Attitudes (IP–UKHLS Data); MSOA as Level- 2; Outgroup Defined as Non-White.
Table A6 Multilevel Logistic Regression Models Predicting Support for Leaving the EU (UKHLS Data); MSOA as Level 2; Outgroup Defined as Non-White.
Table A7 Multilevel Logistic Regression Models Predicting Anti-Immigrant Attitudes (BES Data); Local Authority as Level 2; Outgroup Defined as Non-White British.
Table A8 Multilevel Logistic Regression Models Predicting Anti-Immigrant Attitudes (IP–UKHLS Data); Local Authority as Level 2; Outgroup Defined as Non-White British.
Table A9 Multilevel Logistic Regression Models Predicting Whether Respondent Voted For Brexit (BES Data); Local Authority as Level 2; Outgroup Defined as Non-White British.
Table A10 Multilevel Logistic Regression Models Predicting Support For Leaving the EU (UKHLS Data); Local Authority as Level 2; Outgroup Defined as Non-White British.
Table A11 Multilevel Logistic Regression Models Predicting Anti-Immigrant Attitudes (BES Data); Local Authority as Level 2; Outgroup Defined as Non-UK Born.
Table A12 Multilevel Logistic Regression Models Predicting Anti-Immigrant Attitudes (IP–UKHLS Data); Local Authority as Level 2; Outgroup Defined as Non-UK Born.
Table A13 Multilevel Logistic Regression Models Predicting Whether Respondent Voted for Brexit (BES Data); Local Authority as Level 2; Outgroup Defined as Non-UK Born.
Table A14 Multilevel Logistic Regression Models Predicting Support for Leaving the EU (UKHLS Data); Local Authority as Level 2; Outgroup Defined as Non-UK Born.
Figure A1. Average Marginal Effects of Diversity (With 95% CIs), BES Sample.
Figure A2. Average Marginal Effects of Diversity (With 95% CIs), IP Sample.
Figure A3. Average Marginal Effects of Diversity (With 95% CIs), BES Sample.
Figure A4. Share of People with Degree in LA.
Figure A5. Share of Unemployed in LA.
Figure A6. Share of Social Renters in LA.
Figure A7. Share of Single Female Households in LA.
Figure A8. Share of People Aged 65 and Above in LA.
Figure A9. Population Density in LA.
Figure A10. Share of Indian in LA.
Figure A11. Share of Pakistani in LA.
Figure A12. Share of Bangladeshi in LA.
Figure A13. Share of Chinese in LA.
Figure A14. Share of Other Asian in LA.
Figure A15. Share of Black Caribbean in LA.
Figure A16. Share of Black African in LA.
Figure A17. Share of Other Black in LA.
Figure A18. Share of White Other in LA.
Notes
Author Biographies
References
Supplementary Material
Please find the following supplemental material available below.
For Open Access articles published under a Creative Commons License, all supplemental material carries the same license as the article it is associated with.
For non-Open Access articles published, all supplemental material carries a non-exclusive license, and permission requests for re-use of supplemental material or any part of supplemental material shall be sent directly to the copyright owner as specified in the copyright notice associated with the article.