
Abstract
What is the effect of providing personally tailored budgetary information on public attitudes to tax and spending? We address this question with a survey experiment based on the annual tax summaries introduced by the UK tax authorities in 2014. By subtly manipulating the categories of state spending – in particular, the controversial category of ‘welfare’ – to invoke a sense of unfairness, we show how budget information in general and the United Kingdom’s annual tax summaries in particular impact support for state spending. Though the stated aim of providing personalised tax receipts to income taxpayers is to enhance fiscal transparency, doing so may also damage support for state spending if the information provides a sense that existing redistribution is unfair. The article contributes to political science debates about public attitudes to tax and spending, the character and trade-offs of fiscal transparency, and the framing effects of welfare.
In November 2014, the United Kingdom’s HM Revenue and Customs (HMRC) began posting an annual tax summary to every income taxpayer providing them with an itemised breakdown and visualisation of how the government has spent their tax over the past year. For example, a taxpayer earning £30,000 will be informed that they have contributed £1663 to welfare and £1280 to health at the top end, and £78 to overseas aid and £51 to the European Union (EU) budget at the bottom end. Costing an estimated £5.3m (Sweet, 2015), then Chancellor George Osborne justified the scheme as a ‘revolution in transparency’ that ‘will show how hardworking taxpayers have to pay for what governments spend’ (Gov.uk, 2014).
The media coverage that followed the launch highlighted serious concerns about how unorthodox and unconventional accounting and categorisation practices ensured that ‘welfare’ was the largest spending category (BBC, 2014 ). Dame Anne Begg, former Chair of the House of Commons Work and Pensions Committee, claimed that the tax summaries were part of an attempt to ‘make the phrase welfare almost appear as a dirty word’ by giving ‘people the impression [that] the bulk of welfare goes to working-age unemployed people when in reality that is a very small proportion’ (Guardian, 2014). Meanwhile, Frances O’Grady, General Secretary of the Trade Union Congress, went as far to call the documents ‘party political propaganda masquerading as neutral information’ (BBC, 2014). The nonpartisan Institute for Fiscal Studies (IFS) stated that ‘this is not spending that would normally be classed as “welfare”’ (Hood and Johnson, 2014).
Underpinning this policy debate is a broader question of relevance to political science: What is the effect of providing personally tailored budgetary information on public attitudes to tax and spending? In addressing this policy-relevant and theoretical question, we draw on a novel experiment embedded in a national survey based on the UK annual tax summaries. Rather than manipulating information regarding expenditure flow – for example, by seeing whether participants react differently to hypothetical information about either a 40% or 20% welfare spend – we instead manipulated the way in which real spending data are categorised and calculated. To do so, we used alternative annual tax summaries created by civil society actors in which welfare was disaggregated into smaller categories. By randomly assigning survey participants to receive one of these three tax summaries (and a fourth no-information control condition) prior to a survey that measures attitudes towards tax, spending and welfare, we are able to test whether the categories used on the HMRC annual tax summaries affect public support for current state spending arrangements.
Our results demonstrate that participants exposed to the HMRC treatment are less likely to agree with how tax money is spent and less likely to suggest that the current allocation of public funds is a good use of taxpayers’ money. Despite the subtle character of the experimental manipulation, our results therefore demonstrate that the way in which budgetary information – and, in particular, welfare – is categorised and presented can influence support for public spending. Ultimately, while providing budgetary information in the name of greater transparency may be considered part of good governance, budgetary information can be utilised for political ends given that national accounting categories are contestable and indeed contested.
Our findings contribute to three interrelated debates in political science. First, by testing theories about state–taxpayer relations, we contribute to a long-standing literature on taxation and democracy (Levi, 1989; Martin et al., 2009; Moore, 2004; Ross, 2004; Steinmo, 1993), as well as contemporary political science research that draws on methodological innovations and experimental methods in studying attitudes towards tax and state spending (Brockmann et al., 2015; Paler, 2013; Zhang et al., 2016). Second, our work contributes to the literature on policy-relevant discussions about fiscal transparency by highlighting the potential trade-offs and political dynamics of providing ostensibly objective budgetary information (Alt et al., 2014; Alt and Lassen, 2006; Benito and Bastida, 2009; Heald, 2003, 2012; International Monetary Fund (IMF), 2007; Organisation for Economic Co-operation and Development (OECD), 2002). Finally, by placing the welfare-deservingness association within an explicit fiscal context, the article contributes to the literature on the framing effects of welfare (Petersen et al., 2011; Slothuus, 2007; Smith, 1987; Van Oorschot, 2006).
Theory and Context
Tax as a Transaction
The government’s introduction of annual tax summaries highlights a number of problems and puzzles that lie at the heart of modern liberal democracies. Why, for instance, do people pay tax? And how does the state ensure that it can legitimately extract revenue from its population? This quasi-forceful extraction is required for the state to function and therefore lies at the heart of politics as we know it. For Joseph Schumpeter, who coined the term tax state, ‘this is why “tax” has so much to do with “state” that the expression “tax state” might almost be considered a pleonasm’ (Schumpeter, 1954 [1918]).
There are many tensions within the contemporary tax state. When taxing individual citizens’ income, these tensions can manifest themselves in the character of the exchange between taxpayers and the state (Steinmo, 1993: 193–195). On one hand, taxpayers get nothing in return for their revenue. Taxation is the obligation to contribute money or goods to the state in exchange for ‘nothing in particular’ (Martin et al., 2009). To be clear, ‘nothing’ does not preclude the instances in which taxes are sometimes reserved for certain uses, or that the contemporary tax state has no obligation to put those resources to public goods and services. Rather, it highlights how taxation is an unusual form of economic transaction. Most familiar types of transactions – ranging from the most formal to the most informal – involve reciprocal giving and receiving on the basis that a calculable and abstract parity between the two actors can be restored. This goes for exchanging cash for consumables in a contemporary supermarket as much as it does for when one friend claims back a favour 2 years after the original deed – the key difference between the two being that in the former, there is a legal exchange of property rights. Taxes do not work like this. Although there is a legal exchange of property rights, there is no promise of restoring parity between state and taxpayer either formally or informally. Although there may be certain expectations, paying taxes comes with no explicit guarantees beyond a complex set of social obligations and responsibilities that are normally an irredeemable part of the citizenship package. Taxpayers can therefore, in some sense, expect nothing in return, even if and when taxation is considered integral to one’s civic duty.
On the other hand, in modern democratic societies with elected leaders, the contemporary tax state has an obligation to provide something in exchange for tax. If taxpayers literally get ‘nothing in particular’ in exchange for tax, then the social relations between state and citizen would wane or even break down. Michael Ross (2004) captures this dynamic by demonstrating that there is no link between the absolute tax burden and fiscal preferences. Rather, fiscal preferences are driven by the tax burden relative to the goods and services the government provides. This implies that citizens perform a cost–benefit analysis in which the costs of funding the government are weighed against the benefits they themselves receive. Ultimately, citizens care about the relative price of public goods rather than their absolute cost (see also Paler, 2013).
However, taxpayers do not have perfect information about revenue and expenditure nor the immediate cognitive capacities to fully conduct the cost–benefit analysis required to calculate the relative price they pay for public goods and services – let alone whether they are getting good value for money (Edlund, 1999; Larsen, 2007: 152–154; Rothstein et al., 2012: 8–10; Svallfors, 2013). Instead of a quantitatively generated price based on aggregates of revenue and expenditure (which Ross produces), this ‘price’ manifests not numerically but as a sense derived through the aggregate of micro-level perceptions and experience of state institutions: ‘Are we getting what we deserve?’ If there is a widespread sense that tax and expenditure is unfair in comparison to public expectation, then revenue extraction will be harder to justify. Whereas absolute cost implies that taxpayers have only a single preference about taxes, relative price implies that taxpayers have a dual and relative preference about both taxes and expenditure as refracted through experiences and framings of state institutions. This difference is subtle but important.
This theoretical foundation is consistent with contemporary economics literature on tax compliance, evasion and morale (e.g. Kirchler, 2007; Torgler, 2007). Seeking to move beyond the previously foundational assumption that taxes are a cost that rational actors wish to minimise, this literature demonstrates how ‘tax morale’ – that is, an individual’s intrinsic willingness to pay taxes (Alm and Torgler, 2006) – increases when political institutions have higher legitimacy (Torgler and Schneider, 2007). When there is broader trust in society, then moral appeals to fairness may improve tax morale – because enforced or coerced compliance can corrupt tax morale in an environment of trust (Kirchler et al., 2010). It is also consistent with recent political science research into preferences for redistribution. For instance, Lucy Barnes (2015) finds that the public imagination tends to make a distinction between the level of government spending and its structure. She reveals that the most common type of attitude towards tax policy is an ostensibly contradictory one, in which a desire for lower tax levels (i.e. decreased progressivity) is matched with a desire to see the rich pay more relative to the rest (i.e. increased progressivity). Alongside Barnes’ (2015: 7–9) evidence that respondents were able to make a link between levels of spending and levels of taxation, this suggests that fiscal preferences are driven by relative price rather than absolute cost.
One way to ensure that taxpayers are getting a good price for their public goods and services is to increase transparency and provide citizens with information about the budget. In recent times, there has been a push towards transparency in both fiscal policy and other areas. Scholars and policymakers have argued that greater fiscal transparency is a crucial aspect of good governance that allows citizens to monitor and assess ‘the necessary trade-offs between different policy options can be assessed’ (see also Heald, 2003; OECD, 2002: 9). The UK annual tax summaries have been justified by the state as an innovation in fiscal transparency. The assumption is that greater information in the form of annual tax summaries will provide taxpayers with the knowledge to make an informed decision on whether they get a good price for public goods and services in exchange for their tax revenue.
The Meaning of Welfare
The way in which HMRC accounted for welfare on the annual tax summaries is unorthodox and unconventional inasmuch that it goes against the grain of national accounting procedures. As the accompanying official government guidance explains, the accounting on the summaries is based on the data published every year by the government in the Public Expenditure Statistical Analysis (PESA) (Gov.uk, 2015). PESA is, in turn, structured around the United Nations’ Classification of the Function of Government, which accounts for 10 main public expenditure categories: general public services; defence; public order and safety; economic affairs; environmental protection; housing and community amenities; health; recreation, culture and religion; education; and social protection (McInnes, 2014). For the purposes of the tax summary, the PESA category of ‘social protection’ was split up into ‘pensions’ and ‘welfare’. While the ‘pensions’ category was relatively straightforward, the resulting ‘welfare’ category included a number of areas – such as military and nurses pensions, or long-term social care – that are not typically considered as welfare. As we discuss in the next section, this categorisation of welfare is the crux of our experimental design.
It should be noted here that there is nothing a priori controversial about welfare, to the extent that we would expect different categorisations of welfare to significantly affect whether taxpayers agree with how the government spent their money and whether that spending is a good use of taxpayer money. After all, the National Health Service is one of the most popular public institutions in the United Kingdom, and many British citizens would likely support programmes that aimed to improve the welfare of the country as a whole. Rather, the term ‘welfare’ has come to possess negative connotations, with associations in particular with means-tested cash transfers to the poor rather than with social protection per se. The comparative welfare states literature suggests the most convincing explanation for this shift in the meaning of the term.
This scholarship has long argued that a feedback loop explains low levels of support for redistribution in liberal welfare regimes such as the United Kingdom (Larsen, 2007). Those regimes tend to favour means-tested or selective social protection in a way that implies a judgement that some recipients are worthier than others (Rothstein, 1998). Those who receive means-tested benefits are typically stigmatised as undeserving of help (Soroka et al., 2013). There is a consistent pattern regarding the deservingness of different social groups: the elderly are seen as the most deserving, and the unemployed and immigrants are seen as the least deserving, with other social groups somewhere between (Van Oorschot, 2006). In liberal welfare states (such as the United Kingdom) in which hard work and self-reliance are considered important to maximising life chances, it is unsurprising that welfare recipients are often considered undeserving.
The British Social Attitudes (BSA) survey provides an authoritative overview of trends in British public opinion and helps identify prevailing stereotypes about welfare. As the political science literature suggests, the disabled and children are consistently high priorities, while the unemployed are considered the least important (Park et al., 2013; Taylor-Gooby, 2013: 53). Moreover, public attitudes towards unemployment benefit have significantly hardened in recent times. On this topic, the survey asks participants whether they believe that unemployment benefit is either too low and causes hardship or too high and discourages work (Park et al., 2014; Taylor-Gooby, 2013: 35). Throughout the 1980s and up until the middle of the 1990s, nearly half of those surveyed said that unemployment benefit was ‘too low’ and ‘cause[s] hardship’ in comparison to around 30% who answered ‘too high, discourage work’. Between 1997 and 2003, this trend reversed, with upward of 60% now answering ‘too high, discourage work’ compared to 20% who answer ‘too low, cause hardship’.
This simultaneous shift in British attitudes towards social protection and in the meaning of the word welfare mirrors earlier trends in the United States. The term has become synonymous with dependency and labour market activation rather than its historical roots in promoting equality and social justice (Lister, 1998). Political scientists have held a long-term interest in the framing effects of welfare (e.g. Jacoby, 2000). US research has especially focused on the racially coded character of welfare (Gilens, 1999), which is less, but not uncompletely, relevant to the United Kingdom (Ford, 2015). Beyond race, Smith (1987) demonstrated how US survey participants provided systematically different answers when asked a variety of questions about whether spending should be increased on ‘welfare’ compared to ‘assistance for the poor’ and ‘caring for the poor’. Smith found that asking about ‘welfare’ produced consistently more negative evaluations than ‘the poor’ (Feldman and Steenbergen, 2001: 668–669; Smith, 1987: 76), and he essentially explains this result with reference to deservingness (Smith, 1987: 79). Other research has shown how tax preferences can also be explained by framing effects (Löfgren Nordblom, 2009; McCaffery and Baron, 2004). Overall, this suggests that welfare can have framing effects through triggering concerns about the ‘price’ of public services and individuals’ relative tax burden.
In sum, we expect that annual tax summaries will affect support for current state spending arrangements. By providing itemised and individually tailored information about how the state spends an individual’s revenue, the annual tax summaries should alter the price that taxpayers think they get in exchange for their tax: this information should provide a sense of getting a better or worse price than expected, which should ultimately affect whether current state spending arrangements are justifiable. We therefore expect that manipulating the welfare category on the annual tax summaries presented to participants will make a difference: in contrast to those that receive the HMRC statement that shows welfare as the largest category, those that receive a summary in which welfare is disaggregated in line with conventional accounting procedures will be more supportive of government spending, more supportive of welfare spending, and think that there are less people on welfare.
Research Design
Survey-Embedded Experiment
We designed our stimulus materials based upon the official HMRC tax summary, as well as alternatives provided by two civil society actors that have been active in the resulting public debate. The first alternative summary was compiled by the IFS, which argues that ‘there might be a case’ for providing a more detailed breakdown of welfare spending (Hood and Johnson, 2014). The IFS tax summary is exactly the same as the official HMRC version, except that it draws on formal government accounting frameworks to disaggregate the welfare category into four parts: personal social services, public service pensions, other benefit spending on pensioners and other benefit spending on those of working age. Crucially, this ensures that ‘health’ is now the largest category on the annual tax summary.
The second alternative summary was presented on the Tax Research UK (TRUK) blog (Murphy, 2014). Rather than simply disaggregating welfare, the TRUK summary uses alternative accounting figures that results in 25 distinct categories. We opted to include the TRUK summary because it provides two interesting contrasts to both the HMRC and IFS equivalents. First, like the IFS summary, the TRUK version disaggregates welfare, but, unlike the IFS summary, the TRUK version has ‘specific non-employment benefits’ as the largest category. Second, the TRUK includes ‘spends’ such as tax reliefs that are not typically considered expenditure. In combination with the larger quantity of categories, this means that the TRUK summary is more complex and thus harder to digest than the other two. It is important to note that each of the annual tax summaries is based on justifiable, albeit contestable, accounting procedures. They provide the basis of our experimental conditions and provide greater external validity because they are legitimate alternatives to the information that taxpayers would receive.
Participants were assigned to one of four treatment conditions, which corresponded to the three different tax summaries (HMRC, IFS, TRUK) and a true control condition without any tax information (see Appendix 1 for examples of the materials used in each condition). Great care was taken to ensure that the tax summaries mimicked the original document that was mailed to UK households, and that the different versions were as comparable as possible across treatment conditions. To add to the authenticity of the experiment, we ensured subjects received tax information relevant to their self-reported income bands (we created tax summaries for annual income that was estimated at £20,000, £40,000 or £60,000). 1 In total, our experiment had nine potential versions of the tax summary documents resulting from a 3 (organisation: HMRC, IFS, TRUK) × 3 (income: £20k, £40k, £60k) between-subjects design, plus a true control condition. 2
Following exposure to the tax summary document (or no information in the control condition), participants answered three blocks of questions focussing on (1) the value and benefit of the tax summary documents; (2) government spending, budget priorities, tax and welfare; and (3) the category of welfare. For the first set of questions, we included several items to assess participants’ attitudes towards the tax summaries along three qualitatively different dimensions. This entails evaluating the extent to which the tax summaries (1) provide information about government spending, (2) create accountability for spending priorities and (3) offer value to the public. Two items tapped each of these three dimensions (on 5-point scales from ‘Strongly Disagree’ to ‘Strongly Agree’): information was measured by questions about the degree to which participants agreed that tax summaries would ‘make tax clearer’ and ‘inform citizens about government’; accountability was assessed by ‘increase the transparency of government’ and ‘make government more honest’; and value was captured with ‘provide good value for money’ and ‘be useful to me personally’.
For the second set of questions, our regression models focus on four outcomes of interest that capture a range of potential effects from our survey-embedded experiment. First and foremost, we asked participants whether they agreed with how the government apportioned their individual tax: ‘Thinking about your Annual Tax Summary, do you agree or disagree with how the government spent your tax money last year?’ Responses ranged from ‘Strongly Disagree’ to ‘Strongly Agree’ on a 5-point scale (M = 2.96, standard deviation (SD) = 0.94). Second, we asked participants, ‘Overall, would you say that the government’s current allocation of public funds is a good use of taxpayer money?’ Responses to this item ranged from ‘Not At All Good Use’ to ‘Very Good Use’ on a 4-point scale (M = 2.47, SD = 0.72). Third, we gauged participants’ perceptions towards welfare by asking, ‘If you had to guess, what percentage of an average taxpayer’s contribution do you think goes towards welfare?’ Responses could range from 0% to 100% (M = 22.78, SD = 16.89). 3 Finally, we asked participants about their preference towards welfare spending on a 5-point scale: ‘Do you think the government should spend more, less, or about the same for welfare?’ High values indicate support for greater spending on welfare (M = 2.83, SD = 1.13). These four dependent variables allow us to specifically test the effect of exposure to variations of the tax summaries on public attitudes towards tax and welfare.
For the final set of questions about the category of welfare, we devised two ways of uncovering how the public define the term. First, we provided participants with a number of different scenarios that detailed situations in which people received benefits from the state, and then asked whether these people should be considered welfare recipients. One example scenario reads, ‘Imagine an out-of-work single mother who currently receives £423 per week in various benefits to help support her three children. Should this person be considered a welfare recipient?’ Scenarios that corresponded to the HMRC definition of ‘welfare’ were included (i.e. nurses employment pension, family tax credit). Second, we then provided participants with a list of different types of state-provided social protection and asked participants to judge whether each type should be considered welfare. The types tested were workplace pensions for nurses, visiting a general practitioner (GP) surgery (i.e. an appointment with a doctor), state pension, winter fuel allowance (i.e. a tax-free payment of between £100 and £300 to help the elderly pay heating bills), long-term care for the elderly, child tax credit, child benefit, jobseekers allowance, income support and housing benefit. These were selected on the basis that they correspond to well-noted differences in perceived deservingness and to again test public definitions of welfare against the HMRC definition used in the tax summaries.
Data
A total of 2722 participants completed our online survey from 8 to 14 July 2015, roughly 2 months after the 2015 UK General Election. 4 After filtering the data for quality control, we ended up with a sample of 1932. 5 Demographically, our sample compares quite favourably to other high-quality Internet panels within the United Kingdom. In Table 1, we provide key demographics from our survey in comparison to a November 2014 YouGov survey on government spending (which we will discuss later as a robustness check), and Wave 6 of the 2014–2017 British Election Study Internet Panel, which was conducted in May 2015. The median age of participants is 50 years old, and participants resided in 77 different counties. The sample also contained a good mix of supporters of the various UK political parties: Conservative Party (29%), Labour Party (24%), UK Independence Party (10%), Liberal Democrats (7%), Green Party (5%) and the Scottish National Party (3.2%), as well as those affiliated with other parties or unaffiliated (22%). Roughly even numbers of men and women completed the survey (54% of the sample is female), and the modal income category was £10,000 to £29,999 (47%). One-third of survey participants reported that they held a university degree or higher, and nearly everyone (96%) indicated that they were British citizens. In short, our survey data reflect a good mix of individuals in the United Kingdom.
Sample Comparisons by Key Demographics.
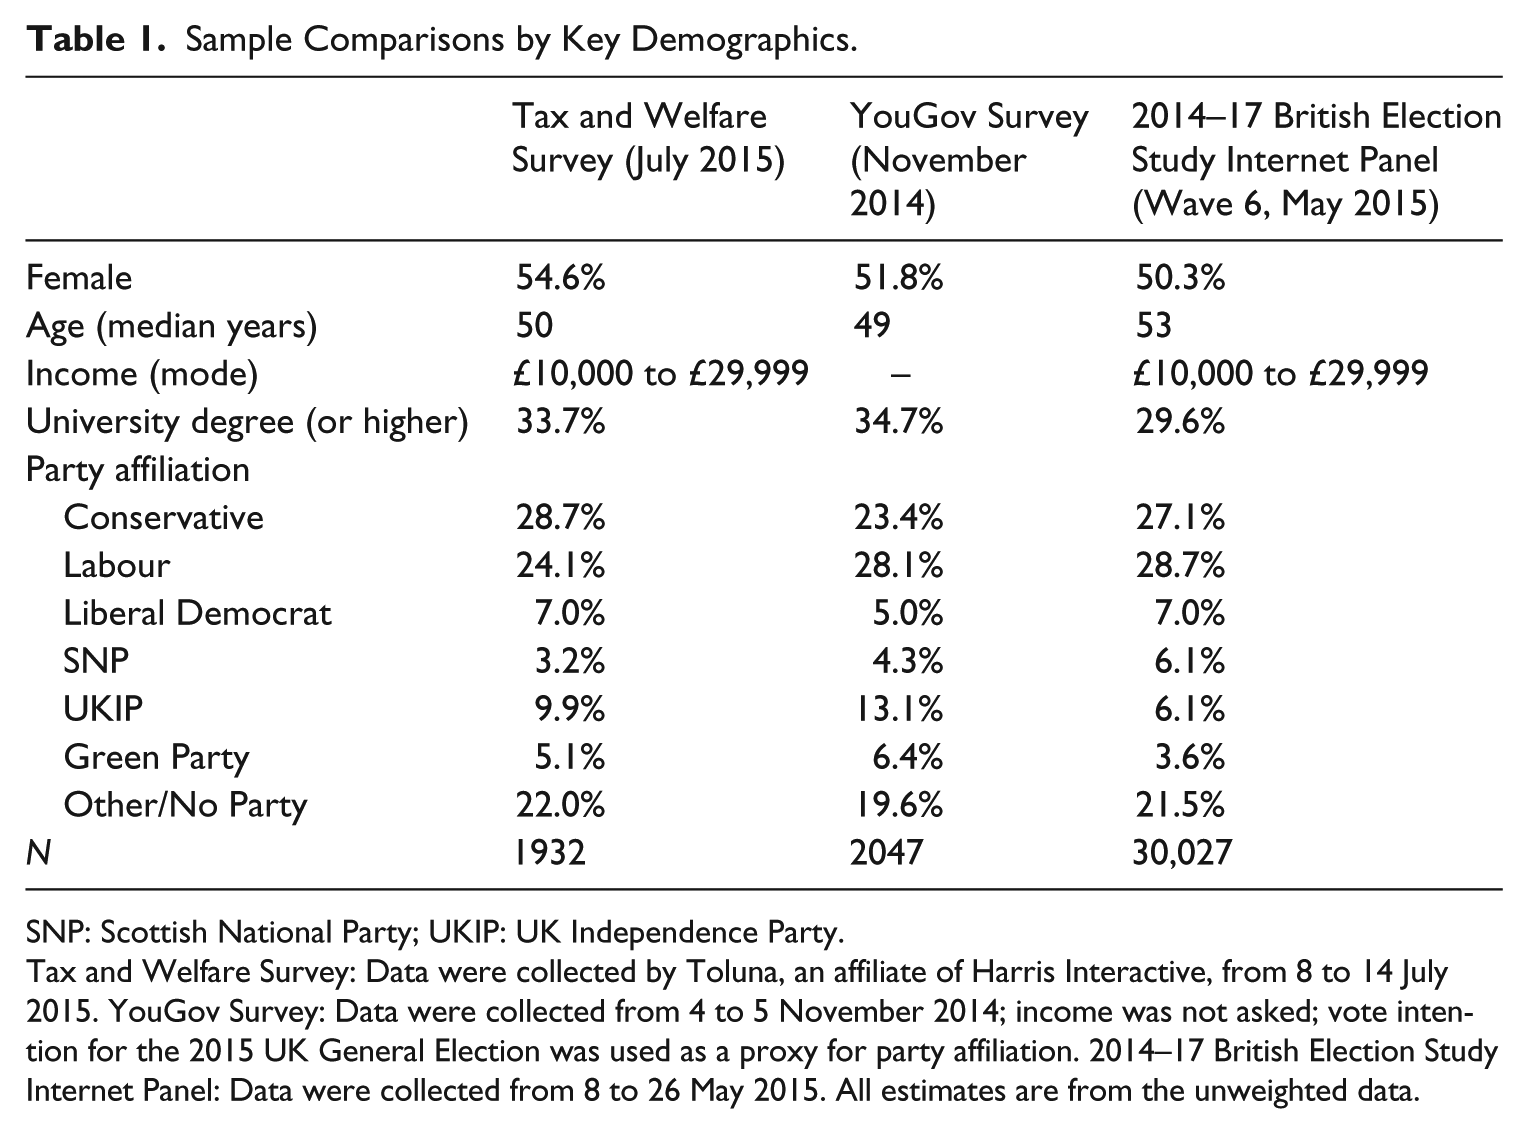
SNP: Scottish National Party; UKIP: UK Independence Party.
Tax and Welfare Survey: Data were collected by Toluna, an affiliate of Harris Interactive, from 8 to 14 July 2015. YouGov Survey: Data were collected from 4 to 5 November 2014; income was not asked; vote intention for the 2015 UK General Election was used as a proxy for party affiliation. 2014–17 British Election Study Internet Panel: Data were collected from 8 to 26 May 2015. All estimates are from the unweighted data.
Results
Attitudes towards Budgetary Information
We begin by exploring public perceptions of the UK government’s tax transparency programme by comparing those who received tax summaries with those who were in the control condition (n = 584). 6 For the control group, there appears to be mixed support for the tax summaries across the three dimensions of information, accountability and value (see Figure 1). First, we find that a majority of these participants agree that the tax summaries should increase information: 58% agreed that the documents would make tax clearer, and the same proportion of participants felt the documents would provide citizens with information. Half of the sample (53%) agreed that the tax summaries would increase government transparency, yet only 38% felt that the tax summaries would make government more honest. Interestingly, citizens seemed to think that the tax summaries would not be particularly useful, with only 40% agreeing with this statement, while only one in four participants thought they would provide good value for money. In short, citizens acknowledged that the tax summaries would provide information, are mixed about whether they would lead to greater accountability and do not seem to think they provide good value for money.
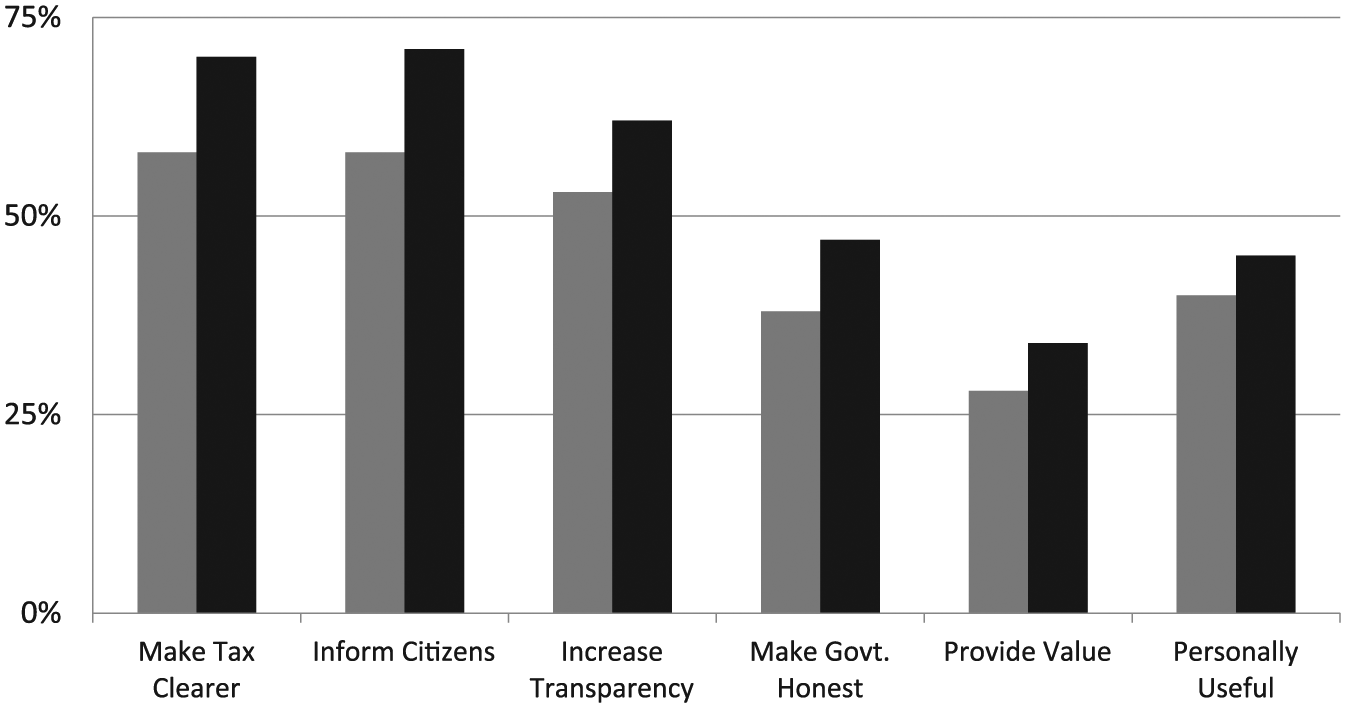
Public Opinion towards the Tax Summary Documents.
One added benefit from our survey-embedded experiment is that we can test whether actually receiving a tax summary document affects public perceptions towards the government’s transparency programme (see Figure 1). Compared to those in the control condition, participants in the treatment conditions – regardless of tax summary version – were significantly more likely to agree that the tax summaries increased information, accountability and value. On average, respondents showed a 10 percentage point increase in the three aforementioned areas. Thus, citizens responded favourably to the actual HMRC tax summary (and IFS and TRUK alternatives) once they were given an opportunity to peruse them.
Attitudes towards Tax, Spending and Welfare
Now we move on to test whether providing individuals with detailed information about how their tax contributions were allocated would affect their attitudes towards government spending, particularly with respect to welfare. To this end, we regressed agreement with how their tax money was spent on our treatment dummy variables (the HMRC version served as the excluded category because this question was only asked of those who viewed their tax summary). Looking at the results presented in Table 2 and the leftmost portion of Figure 2, we find a statistically significant increase in support for tax spending for the IFS condition (b = 0.29, se = 0.12, p < .05, n = 1340), such that exposure to the IFS tax document increases the probability of support for how the UK government spent their tax money. The coefficient for those in the TRUK condition was in the correct direction, but did not reach conventional levels of statistical significance. Although no treatment group showed great support for how tax was spent, the predicted probability of support for tax spending was highest in the IFS version (0.35) and lowest in the HMRC version (0.29), with TRUK in the middle (0.33). In short, there was a modest decrease in support for current spending of tax money when presented with the HMRC version of the tax summary relative to the IFS version. Given that this manipulation was the only difference between the two documents, the subtle change in the presentation of spending information is the mechanism at play.
Regression Results of Preferences towards Government Spending by Tax Summary Treatment Condition.
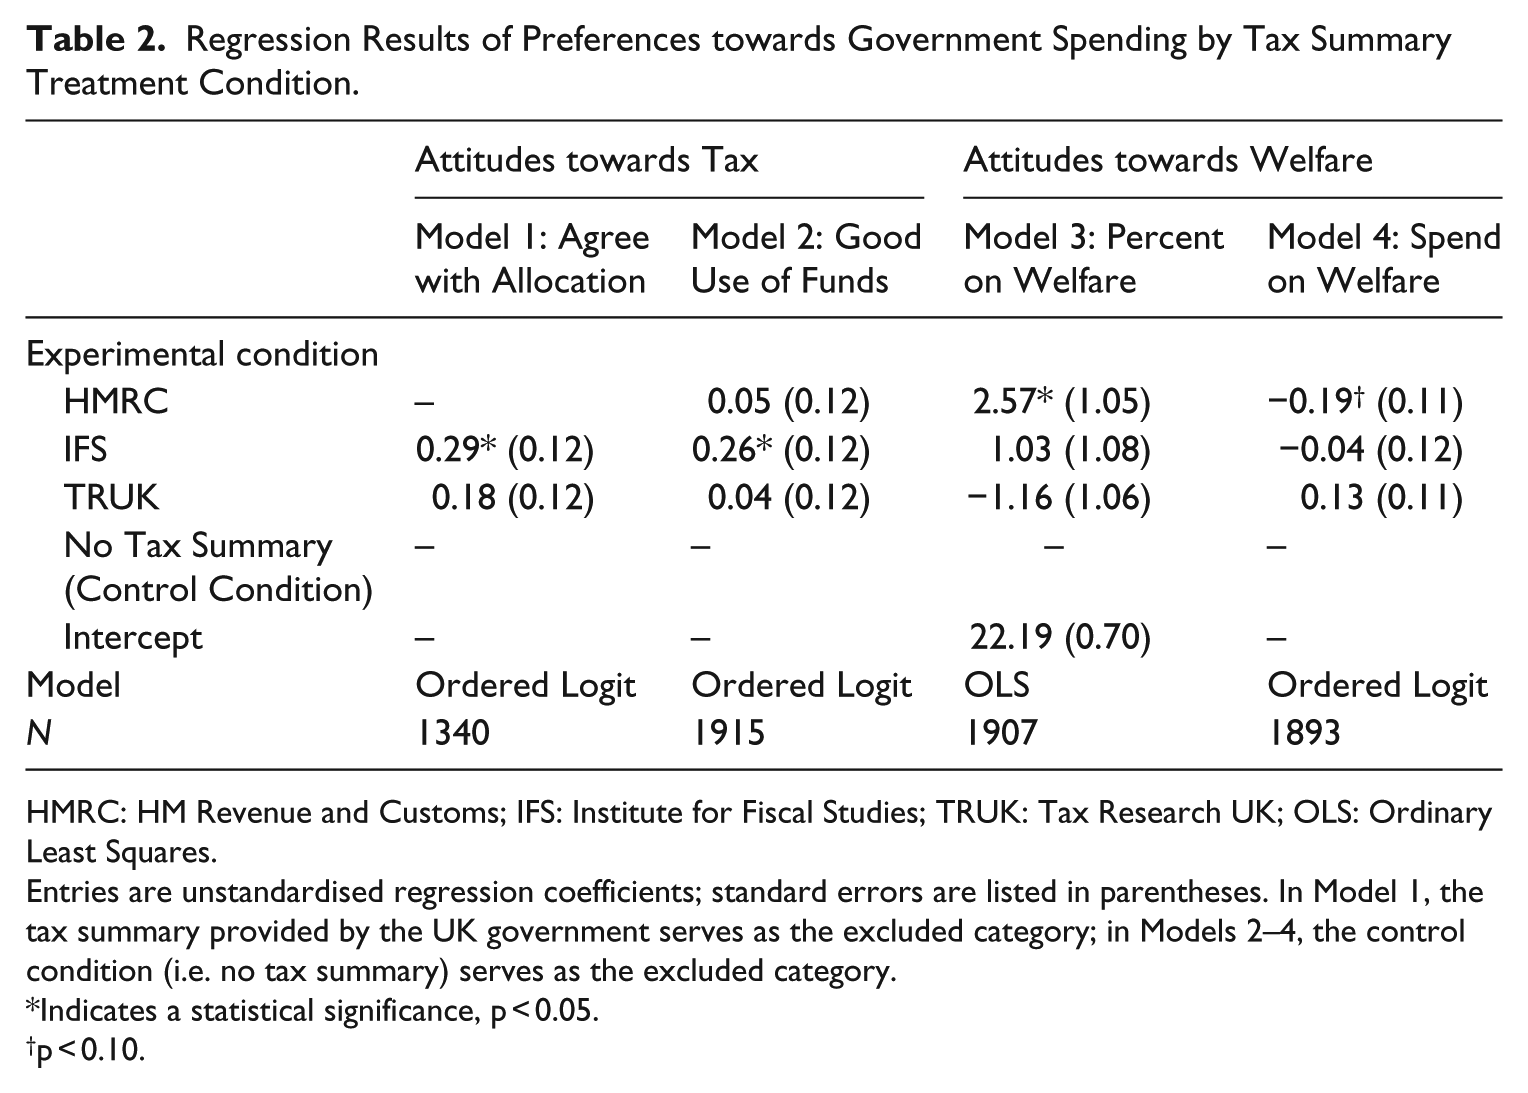
HMRC: HM Revenue and Customs; IFS: Institute for Fiscal Studies; TRUK: Tax Research UK; OLS: Ordinary Least Squares.
Entries are unstandardised regression coefficients; standard errors are listed in parentheses. In Model 1, the tax summary provided by the UK government serves as the excluded category; in Models 2–4, the control condition (i.e. no tax summary) serves as the excluded category.
Indicates a statistical significance, p < 0.05.
p < 0.10.
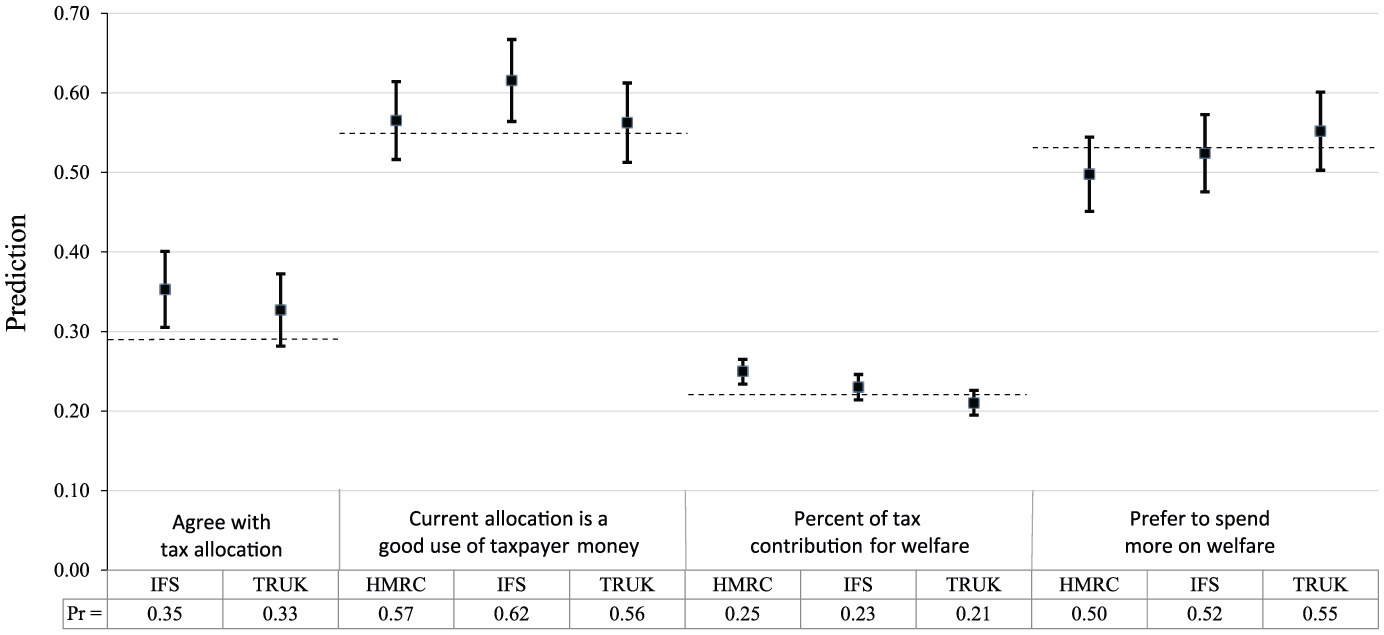
Effects of Exposure to Different Versions of Tax Summary Information on Attitudes towards Tax and Welfare Spending.
Next, we regressed whether citizens felt the current budget allocation was a good use of taxpayer money on our treatment dummies (this time using the no tax summary control condition as the excluded category). Once again, we find a statistically significant increase in evaluations for participants in the IFS condition (b = 0.26, se = 0.12, p < .05, n = 1915), but no comparable increase for those in the HMRC condition (b = 0.05, se = 0.12, p = .65) or TRUK conditions (b = 0.04, se = 0.12, p = .72). The results are provided in column 2 of Table 2, and the predicted probabilities of agreement are presented in Figure 2. The results show that participants in the IFS version had a different attitude towards government spending than their peers.
Given the associations between welfare and deservingness within the wider public debate, it is also important to test whether the HMRC tax summary causes individuals to provide significantly higher estimates of the proportions of the budget going to welfare. To test this possibility, we regressed estimates of the portion of tax that goes towards welfare on the treatment conditions (the control condition serves as the excluded category). In line with our expectations, we find a statistically significant effect for participants in the HMRC condition (b = 2.57, se = 1.05, p < .05, n = 1907). There are no other statistically significant differences across treatment conditions: IFS (b = 1.03, se = 1.08, p = .34), TRUK (b = −1.16, se = 1.07, p = .28). The estimates from this regression are provided in column 3 of Table 2, and the predicted values are presented in Figure 2. These results demonstrate that while the effect size is modest, citizens who receive the HMRC version of the tax summary are more likely than those in the control condition to say that a larger portion of their tax money is spent on welfare. Although not necessarily surprising, this finding is nonetheless important because it demonstrates that exposure to the tax summaries shapes knowledge about state spending – and, in turn, that the categorisation of the spending information matters.
Finally, we regressed support for welfare spending on our experimental treatments (the control condition served as the excluded category). Here, we do not find a statistically significant increase in support among any of the treatment conditions (though there is directional evidence of a decrease in support for welfare spending only among those in the HMRC condition; b = −0.19, se = 0.11, p < .10, n = 1893) relative to those in the control. The results are presented in column 4 of Table 2 and plotted in the rightmost portion of Figure 2.
Robustness Check
One way to ensure the robustness of our results is to test the effect of the different tax summaries in another dataset. A November 2014 YouGov survey experiment (n = 2047) into the impact of the annual tax summaries on public attitudes about tax and government spending is of particular use (see Table 1 for the demographic profile of the sample). Rather than building their experimental manipulation on alternative tax summary documents, the YouGov experiment instead presented two randomly assigned groups with different tax summary prompts (also based on the HMRC and IFS conditions as in our experiment) prior to a series of survey questions on government spending and welfare. These prompts are as follows: Version 1: ‘According to the government figures, a total of 37% of government spending goes on welfare and state pensions. This is broken down by the government as 25% on welfare and 12% on state pensions’ (n = 1,011). Version 2: ‘According to the Institute for Fiscal Studies (IFS), a total of 30% of government spending goes on welfare and state pensions. This is broken down as follows: 14% on benefits aimed at older people (including the state pension), 6% on benefits for the unemployed and those on low incomes, 5% on benefits for the sick and disabled, 5% on benefits aimed at families with children’ (n = 1.036).
Following each prompt, participants were asked to answer the following question on a 5-point scale (high values indicate that the government spends ‘too little’): ‘Do you think the government spends too much, too little or about the right amount on welfare?’ Although this question differs from ours, it nevertheless tests the same theoretical claims regarding fiscal preferences, budgetary information and the framing effects of welfare.
We regressed opinion towards welfare spending on the treatment dummy variable (Version 1 served as the excluded category). In line with our results, we find a statistically significant treatment effect: those participants who received Version 2 (the IFS prompt) were significantly more likely to say that the government spends much too little on welfare relative to those who were exposed to Version 1 (the HMRC prompt); b = 0.34, se = 0.08, p < .001, n = 1815. In other words, citizens who were exposed to HMRC budgeting information (Version 1) were more likely to think the government is already spending too much on welfare. The predicted probability of reporting that the government spends too much on welfare is 0.44 in the Version 1 condition, while only 0.36 in the Version 2 condition. Although the effects of the experimental conditions are modest – a 23% increase in the predicted probability – we would nevertheless stress that they result from what appears to be a brief exposure to information about tax.
Categorising Welfare
Finally, participants were asked whether a number of different personal scenarios and types of social protection should be categorised as welfare or not. The results are presented in Figures 3 and 4. The results demonstrate the uneven way in which people who receive benefits or protection from the state are categorised as ‘welfare recipients’ (or not). Figure 3 highlights how the vast majority think that the single mother and the recently unemployed person are welfare recipients. The families receiving tax credits are somewhere in the middle. The retired nurse and the Eastern European visiting the doctor are generally not considered welfare recipients. Figure 4 clearly demonstrates this pattern. As expected, these results highlight a link between the perceived deservingness of a group and the extent to which they are considered a welfare recipient. The results also highlight how certain areas of social protection, such as unemployment benefits, are more likely to be considered as welfare than others, such as tax credits, and especially pensions.
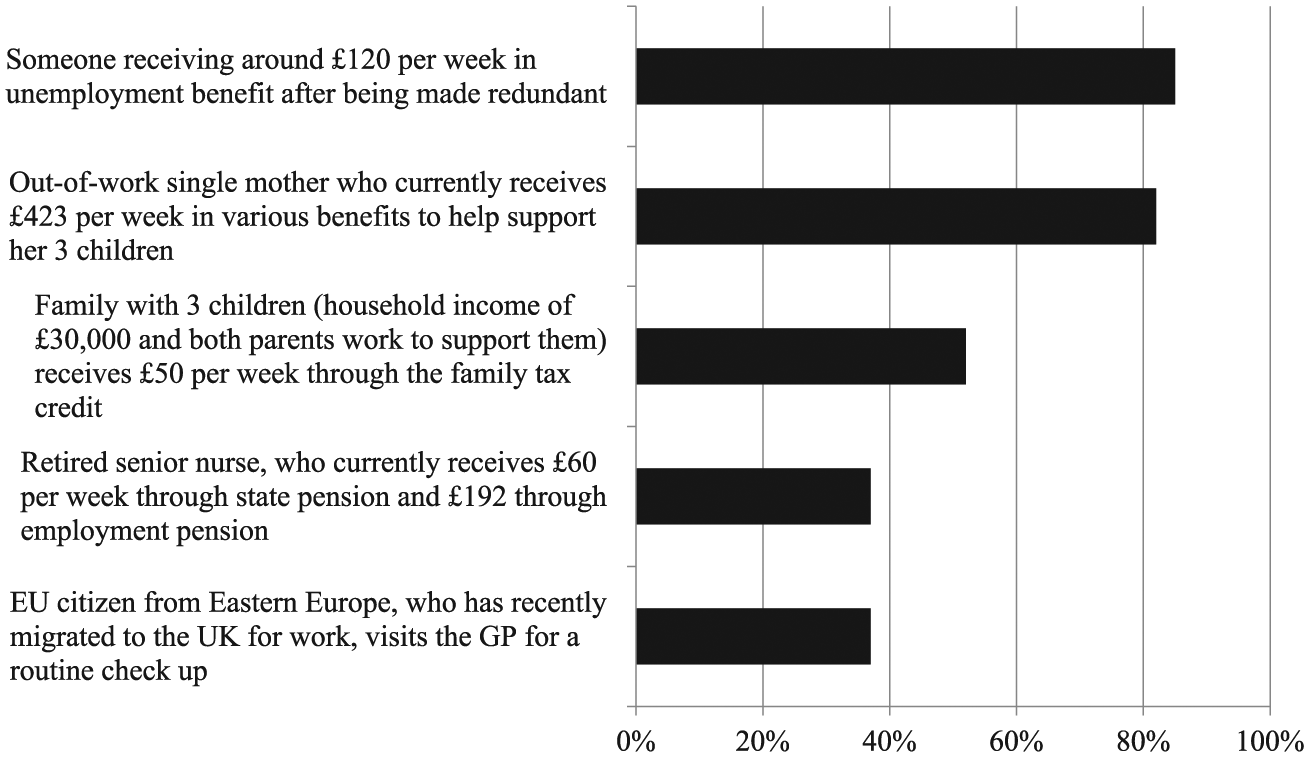
Public Attitudes of What Constitutes Welfare by Hypothetical Scenarios.
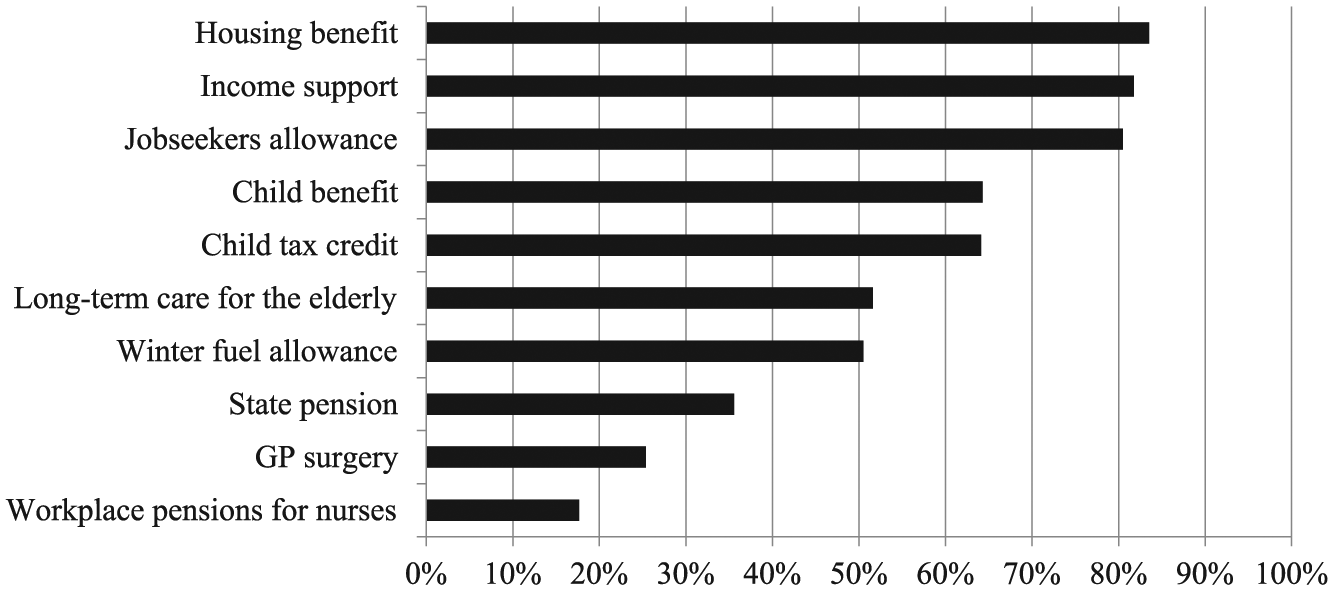
Public Attitudes of What Constitutes Welfare by Named Benefit.
Thus, the label of a welfare recipient is not applied based upon the quantity of state support received; rather, some sort of value judgement is a more important determinant. This is especially clear when it comes to pensioners. The state spends around 20 times more on state pensions than it does on unemployment benefits. However, since pensioners are typically deemed the most deserving recipients of state help, unemployment benefit recipients receive much more public vitriol. This is reflected in our results, in which pensioners are not typically considered as welfare recipients. All in all, these results suggest that the category of ‘welfare’ used by HMRC in the annual tax summaries does not reflect the meaning of the term in the popular imagination.
Discussion and Conclusion
Beyond the immediate and self-evident implications for the annual tax summary policy in the United Kingdom, these results have implications for three debates in political science: (1) the interaction between state-taxpayer relations and state legitimacy, (2) framing effects on tax preferences and (3) the trade-offs of providing ostensibly objective budgetary information in the name of transparency. The discussion about fiscal state legitimacy started from the observation that the relationship between the state and income taxpayers is unusual. On one hand, taxpayers ought to expect nothing in return for their quasi-voluntary tax compliance, as parity cannot be restored between the two parties because of the character of public goods and services. On the other hand, taxpayers certainly do expect at least something in return for their tax money; otherwise, the social relations and sense of civic duty that underpin ostensibly coercive income tax collection would be unjust, and therefore, the legitimacy of the state could wane. On the basis of these dynamics, fiscal preferences are theorised as emerging from the relative price paid for public goods and services – but because of imperfect information and other factors, this price manifests itself as a sense of fairness and is refracted through institutional settings and framing effects.
We have placed fiscal transparency, budget information and the annual tax summaries within this context. We discovered differences between those who received the HMRC summaries and, in particular, those who received the IFS summaries. Generally, and in comparison to those who received the IFS summaries, those who received the HMRC are (1) less likely to agree with how the government spent their money, (2) less likely to indicate that current government spending is a good use of taxpayer money and (3) more likely to guess that the government spends more on welfare. Crucially, the only difference between the HMRC and IFS summaries was the way in which social protection was represented.
We explain this finding through the framing effects of welfare: the British public typically make a link between that term and undeserving benefit recipients. The results from the final part of the survey on categorising welfare demonstrate that although many different groups of people receive state-funded help, members of the public instead focus on certain groups in society: the less stereotypically ‘deserving’ a group is considered, the more likely they are to be deemed to be welfare recipients. The annual tax summaries effectively signal to taxpayers that other types of people are the beneficiaries of their money – and that, by extension, current spending arrangements are a poor use of taxpayers’ money. In other words, the tax summaries affect taxpayers’ sense of what price they are paying for their public goods and services. The findings therefore support and extend existing research on the framing effects of tax on redistributive preferences.
It is important to emphasise the effect sizes we observed are modest. This is indeed what we would expect given the character of the experimental study. After all, this experiment systematically tested whether support for state spending is affected by manipulating just the categories of state spending, as opposed to state spending per se. Furthermore, the effects we found occur after a brief exposure to the tax summary information (i.e. less than 1 minute mean perusal time). We might expect larger effects if taxpayers were to attend to the information more carefully, or if they discussed it with family, friends and others within their social networks.
The results also have implications for how we understand fiscal transparency. Up to this point, we have purposely avoided the question of whether the HMRC or IFS summary is more accurate or transparent than the other. In response, we would suggest that this is the wrong question to be asking. The existing literature on fiscal transparency sometimes uses the analogy of a trade-off between the ‘value of sunlight’ and ‘the danger of over-exposure’ when states strengthen their fiscal transparency (Heald, 2003: 723–729). On the basis of our argument, we would like to push this logic even further.
Rather than conceptualising fiscal transparency through an optical analogy in which light is allowed to pass through budgeting so that objects behind can be distinctly seen, fiscal transparency can also be conceptualised as a type of tool that allows information to be built and disseminated in a particular way. In this alternative tool-based analogy, national accounting, like all forms of economic calculation and accounting, is not simply a neutral representation of an underlying reality (Miller and Rose, 1990: 11–14). Instead, those categories and calculations are the result of political forces in which a choice of one method is selected over an alternative (Mügge, 2016). Providing budget information in the name of fiscal transparency can never be truly objective inasmuch as there is no object to represent (Larsen, 2017; MacKenzie et al., 2007); there are only certain tools that, in a sense, make and re-make knowledge of state spending in particular (political) ways. That is not to say that some representations may simply be misleading or erroneous, but that once past that point, there is still plenty of room to move within the boundaries of legitimate accounting. The inherently political character of national accounting decisions may occasionally shine through the otherwise misty grey world of day-to-day fiscal affairs – as it did with HMRC’s annual tax summaries. Most of the time, however, it does not. Deliberation and public debate to ensure that accounting categories are justifiable and in line with the values and conventions of society might, therefore, help ensure that budget information is impartial.
Footnotes
Funding
The author(s) disclosed receipt of the following financial support for the research, authorship, and/or publication of this article: This research was funded by the University of Sheffield.