
Abstract
Facial soft tissue thickness (FSTT) data are currently widely used in forensic and medical science. In the forensic sciences, they form the basis for craniofacial reconstruction and identification methods. Since there are few FSTT data in the Slovak population, this study aims to enrich the data in well-defined age categories, taking into account differences between sexes and body mass index (BMI). The sample consisted of 127 participants aged 17 to 86 years from Slovakia. In addition to biological sex and age information, stature and body weight were recorded to calculate BMI. Subsequently, 17 facial anthropometric landmarks were used to measure FSTT using a noninvasive General Electric LOGIQe R7 ultrasound device. The mean values of FSTT were greater in the mouth region in males and in the zygomatic and eye regions in females. Differences between males and females, regardless of sex and BMI, were significant only at two landmarks. When BMI and age were taken into account, there were differences in 12 of 17 landmarks. Linear regression results showed the strongest correlation of most landmarks with BMI, followed by age and sex. When the FSTT was estimated in association with sex/age/BMI, landmarks in the zygomatic, mandibular, and frontal regions were the best regressors. The results of the present study demonstrate that B-mode ultrasound measurements of FSTT can be used in facial reconstruction as a function of BMI, age, and sex of the subject. Furthermore, the present regression equations can help practitioners in the forensic/medical field to calculate individual tissue thickness.
Keywords
Introduction
Facial soft tissue thickness (FSTT) includes tissues such as skin, subcutaneous tissue, muscle, adipose tissue, and the vascular system of the head. 1 The bony tissue, the skull, is the support for the soft tissues and gives the head its shape. 2
Facial soft tissue thickness data allow reconstruction methods to capture a relatively correct facial volume in the connections of the anthropometric points of the skull and the facial surface. These FSTT data, obtained by anthropometric quantification analysis, are important for anthropology, but also for other fields of science. Anthropometry is often used in the context of medical examinations, to monitor the evolution of diagnosed pathological lesions, or to monitor natural variability in the population. It can be considered an indispensable part of sciences such as medicine, cosmetology, 3 dermatology, 4 criminology, archeology, forensic pathology, 5 and paleoanthropology. 6 It is also needed in art, especially in sculpture, where it has been used since ancient Greece. 3
Currently, FSTT data of different populations are mainly used for facial reconstruction of skulls of historically important figures 5 and in the context of forensic pathology to identify unknown individuals when other identification methods have failed. It is also used in paleoanthropology, where it is possible to reconstruct faces or entire bodies of prehistoric individuals. 6 Facial soft tissue thickness should be consistent with age in facial reconstruction – the resulting reconstruction should match the shape of the deceased at the time of death or a slightly younger version. 7
The factors that influence FSTT can be divided into internal (sex, age/aging, ethnicity) and external factors. Of the internal factors, aging has the greatest influence on soft tissue thickness, which in turn is strongly influenced by external factors such as environmental conditions, mechanical wear and tear of muscles, and lifestyle.5,8
The aging process is a natural phenomenon that changes the appearance of the face at a consistent rate throughout life. This process is caused by bone thinning, muscle atrophy, and skin changes. Gradually, the soft facial tissues are exposed to various external and internal influences as well as loss of bone support. 4
Body mass index (BMI) is used for basic determination of underweight (< 18.5 kg/m2), normal weight (18.5–24.9 kg/m2), overweight (25.0–29.9 kg/m2), and obesity (≥ 30.0 kg/m2). In the past, BMI was considered informative in population studies. However, it is currently inappropriate for diagnosing an individual because it does not take into account the percentage of fat that may be present when determining obesity, such as an athlete who has a low percentage of fat and a high percentage of muscle. BMI can be calculated as the ratio of weight (kg) divided by the square of height (m2). 9
De Greef et al. 10 confirmed the important role of BMI in the changes of FSTTs that can “erase” the differences between the sexes. Starbuck and Ward 11 studied different types of subjects’ faces divided by weight: emaciated, normal, and obese faces to reconstruct facial appearance. The emaciated face has similar or smaller FSTT values than the normal face, and the FSTT values of the normal face are equal to or smaller than the FSTT values of the faces of obese subjects. 11
Despite the great scientific attention given to FSTT recently, there are few data on the average FSTT in the Slovak population. As far as the authors are aware, only one such study has been conducted with 160 participants using CT scans. 12 This puts anthropologists and forensic scientists in Central Europe in the unfortunate position of being able to rely on only a single data set generated using only one of the possible methods of FSTT measurement. The study was designed to determine FSTT in the upright position in the Slovak population using noninvasive B-mode ultrasound device to determine the sexual dimorphism of FSTT both in relation to and independent of age and BMI. Also, to determine the relationship between sex, age, and BMI and anthropometric characteristics for predicting FSTT in the Slovak population. By performing ultrasound measurements in the upright position, this study complements the previously mentioned data on FSTT in the Slovak population. 12 The present data and observations may be useful for facial reconstruction by anthropologists and forensic scientists.
Materials and methods
This study analyzed a group of 127 volunteer participants from Slovakia from 2019 to 2021. Participation was voluntary and based on written informed consent, which included details about the study, its aims, methods, and expected participation. Participants were guaranteed that anyone could withdraw from the study without giving a reason. A questionnaire and ultrasonography were used to collect data. The study is assessed under the number ECH19026 and was approved by Ethics Committee for human research at the Faculty of Natural Sciences Comenius University in Bratislava, Slovakia. Questionnaires were used to collect subjects’ basic data - biological sex, date of birth, and date of examination to obtain decimal age, weight (kg), height (m), BMI (kg/m2), and relationship to smoking. The subjects who reported possible injuries and medical interventions in the questionnaire that could affect the measurement were excluded from the study group.
The subject group (N = 127) consisted of 78 females and 46 males, who were not athletes and did not participate in professional or competitive sports and was divided according to the following criteria.
age into three different age categories:
from 17 to 26 years old (N = 71), from 45 to 59 years old (N = 20) from 60 to 86 years old (N = 36) body mass index (BMI) in four different BMI categories:
9
underweight, below 18.5 kg/m2 (N = 5) normal weight, from 18.5 to 24.9 kg/m2 (N = 63) overweight, from 25.0 to 29.9 kg/m2 (N = 40) obese, above 30.0 kg/m2 (N = 19).
A General Electric LOGIQe R7 ultrasound device, B-mode, with a probe frequency of approximately 20 MHz was used for measurement. The B-mode ultrasound method was used because of its many advantages, including ease of use, as this version of USG is also a portable device, noninvasiveness, as it does not contain ionizing radiation, lower cost compared with CT (or CBCT), possibility of repeated and safe measurements, and suitability for measuring living, upright individuals.13,14
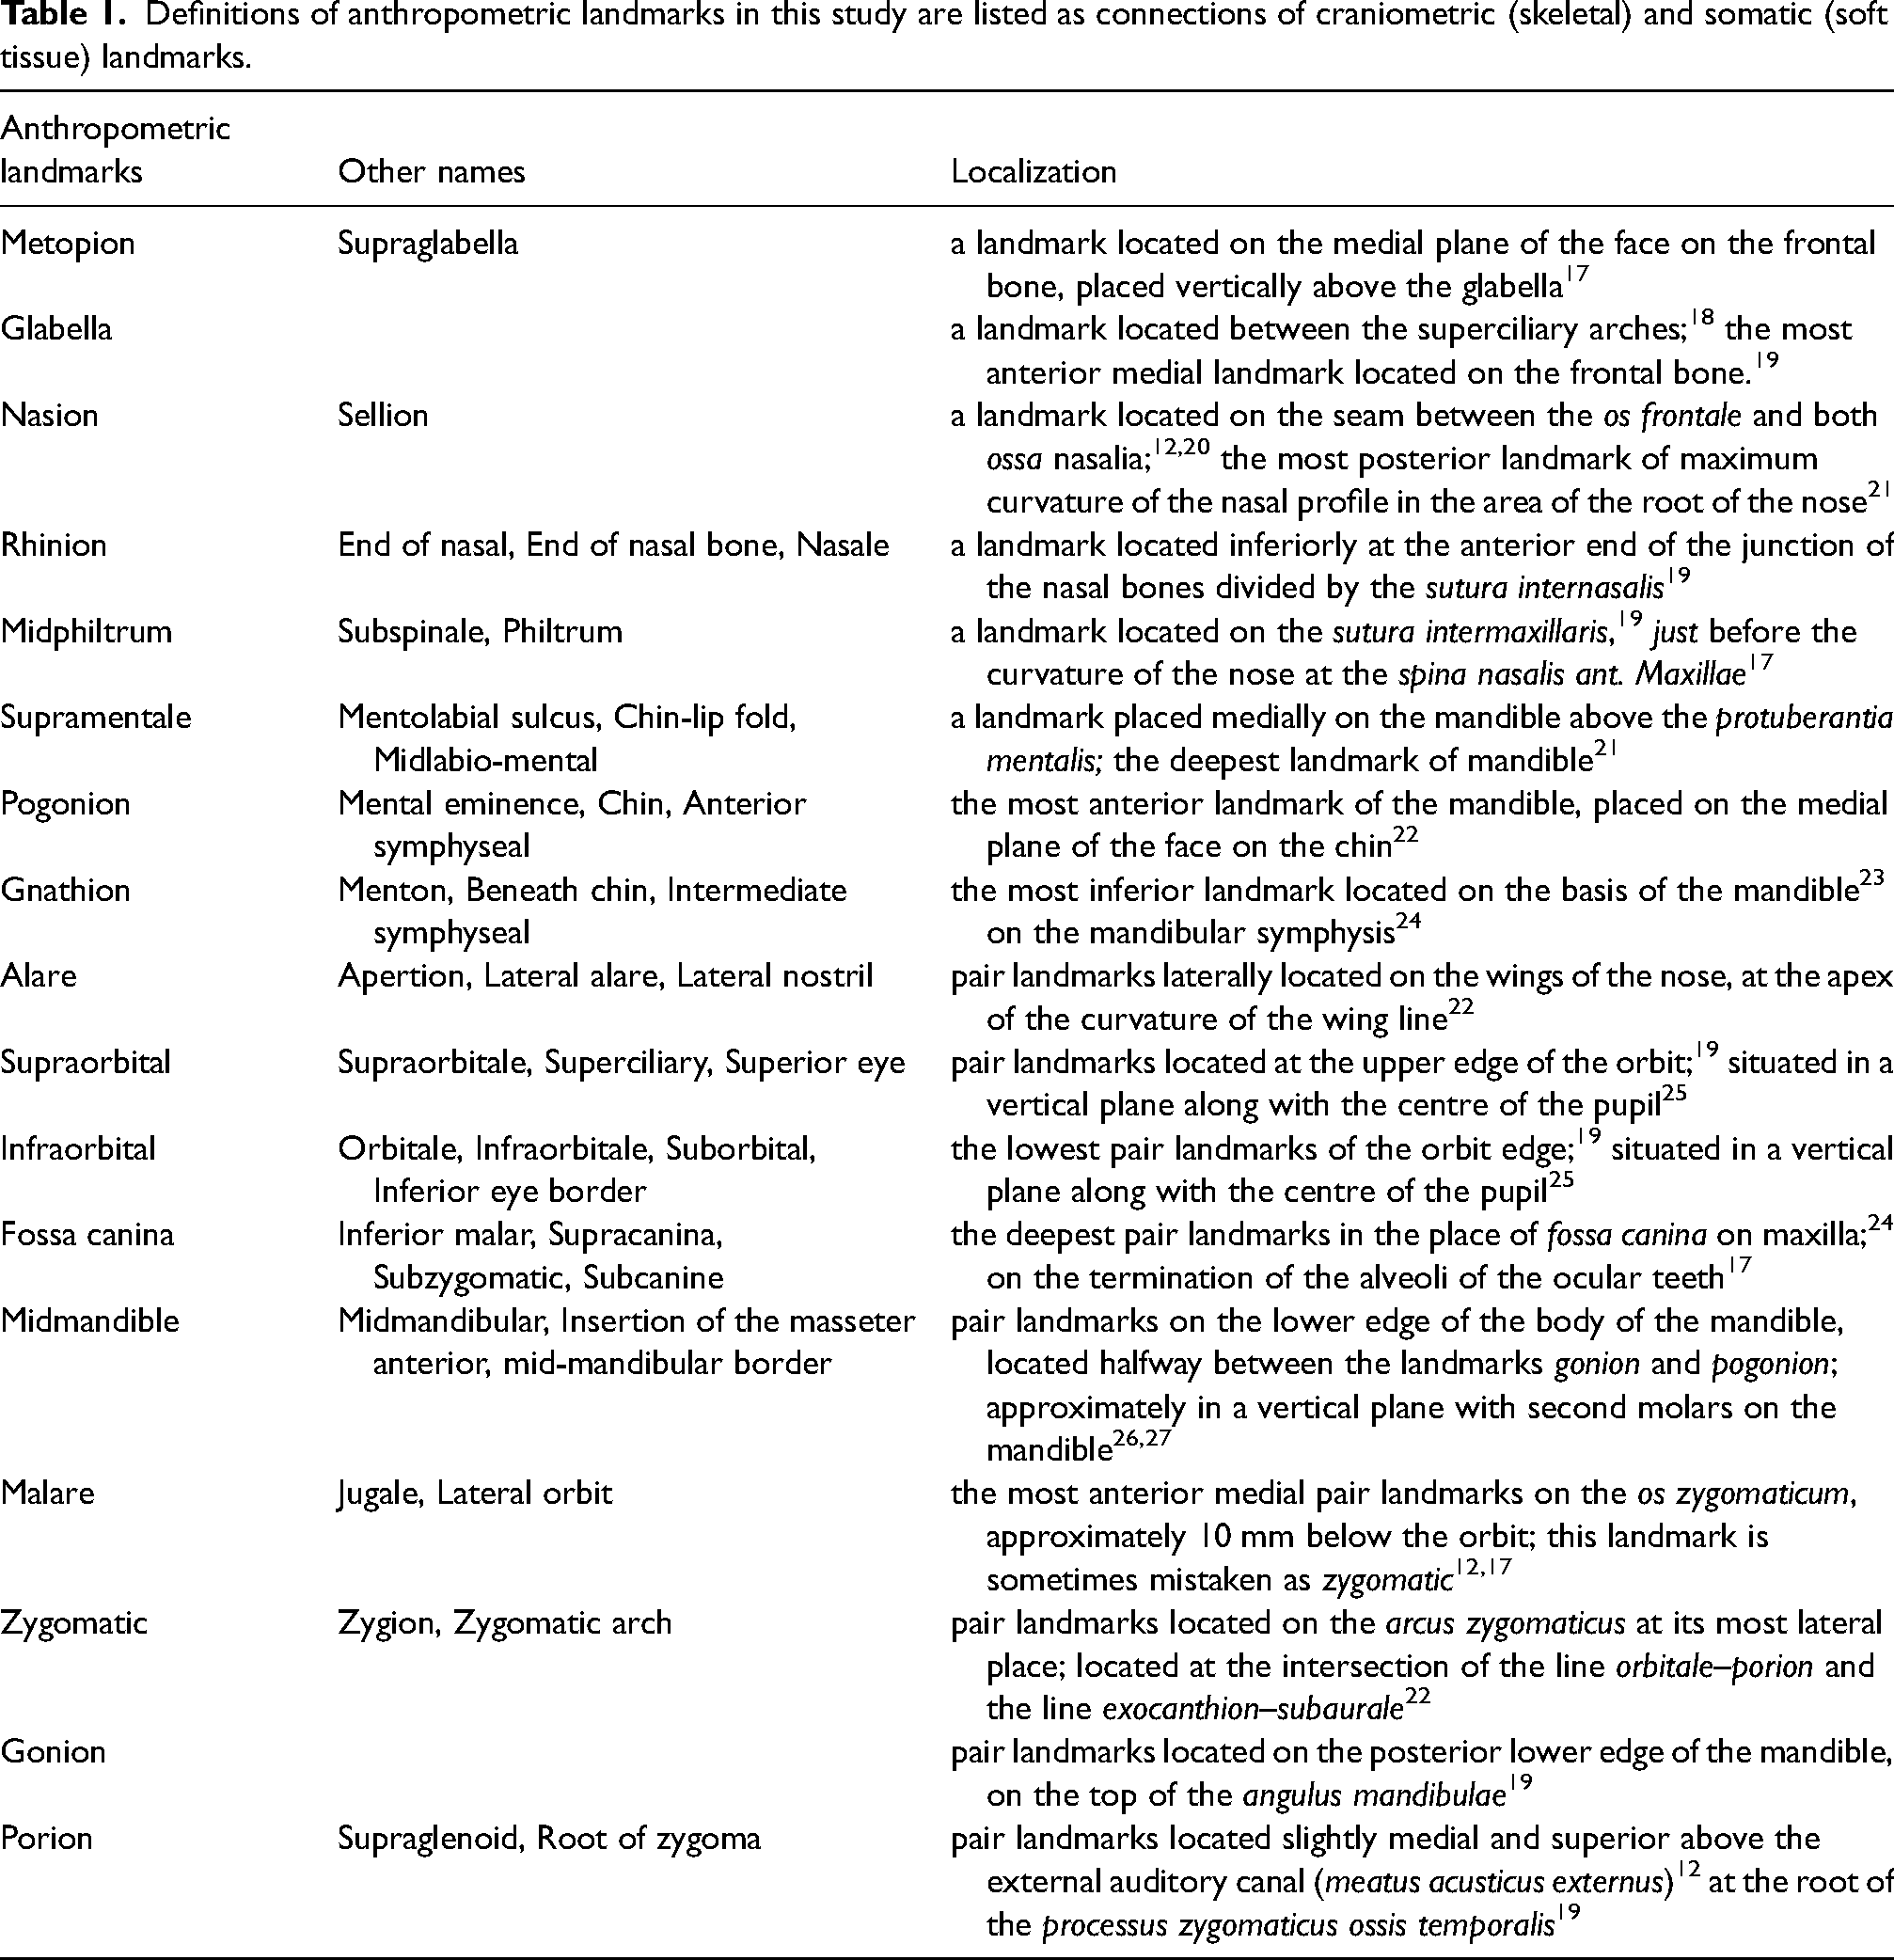
In this study, FSTT was measured at 17 anthropometric landmarks in the upright position – eight landmarks in the medial facial line and nine bilateral landmarks measured on the left side of the face only (based on nonsignificant bilateral differences described in the Results section). Anthropometric landmarks were designated as links between various craniofacial landmarks and soft facial tissue landmarks, e.g., g – g’ as glabella (Figure S1). The selection of landmarks used in the present study was based on the studies of Peckmann et al., and Jia et al.15,16 The definitions of the landmarks used, with appropriate references and their names, are provided for more precise localization in Table 1.
Definitions of anthropometric landmarks in this study are listed as connections of craniometric (skeletal) and somatic (soft tissue) landmarks.
On 10 subjects in an upright posture, 16 facial landmarks were measured twice and repeated 3 days after the first measurement by a single investigator to determine intrapersonal precision. The absolute technical measurement error (TEM), relative technical measurement error (rTEM), and reliability coefficient (R) were calculated. The technical measurement error is defined as the square root of the sum of squared deviations divided by twice the sample size – TEM = √(Σd2)/2N. The absolute TEM was converted to the relative TEM (rTEM) to obtain the error expressed as a percentage, which is the overall average of the variables analyzed – rTEM = (TEM / VAV) × 100, where VAV is the average value of the variables (the arithmetic mean of the means between the two measurements). The reliability coefficient (R) was calculated as a percentage – R = 1 – [(TEM2)/SD2], where SD2 is the total intra-subject variance for the study.28,29
Statistical analysis was performed using the Statistical Package for Social Sciences (SPSS), version 26.0. The significance level was set at 5%. Normality of data was tested by Shapiro–Wilk test, calculation of skewness and kurtosis, examination of histograms, normal Q-Q plots, and box plots. The independent samples t-test and ANOVA were used to assess differences between sexes, age, and BMI categories of FSTTs. Bilateral differences were tested using the paired-samples t test. Linear regression was then performed to find the best regressor for determining the FSTT.
Results
Visual inspection of histograms, normal Q-Q plots, and boxplots showed that the data were approximately normally distributed, with a slight skewness and kurtosis that did not deviate significantly from the normal distribution. The choice of the left side of nine bilateral landmark measurements was based on nonsignificant bilateral differences in the studied sample regardless of sex and age category, with mean differences ranging from 0.04 to 0.24 mm (p < 0.05). The mean values of the studied sample regardless of sex and age are shown in Figure S2.
The absolute TEM and relative technical measurement errors (rTEM) for a single observer are shown in Figure S3. TEM ranged from 0.2 to 1.2 mm, corresponding to an rTEM of 3.1% to 17.8%. In addition, the reliability coefficient (R) was determined for the 16 landmark measurements. The values of R can range from 0 to 1, where 1 means that there was no measurement error. In most cases (11 landmarks), R values were greater than 0.90 (highest for the gonion and supraorbital landmark), a value considered sufficiently accurate for biological studies. 28 For three landmarks, the R value ranged from 0.82 to 0.87, with the lowest values occurring for the nasion (R = 0.78) and supramentale (R = 0.79) landmarks.
In the sample studied, FSTTs were sexually dimorphic in the midphiltrum (p < 0.001) and zygomatic (p = 0.002) landmarks, with differences in the mean values of FSTTs in these two landmarks ranging from 1.5 mm to 1.8 mm. FSTTs were larger in the mouth region in males and in the zygomatic and ocular regions in females (Table 2).
Intersexual differences of FSTTs regardless age and BMI.
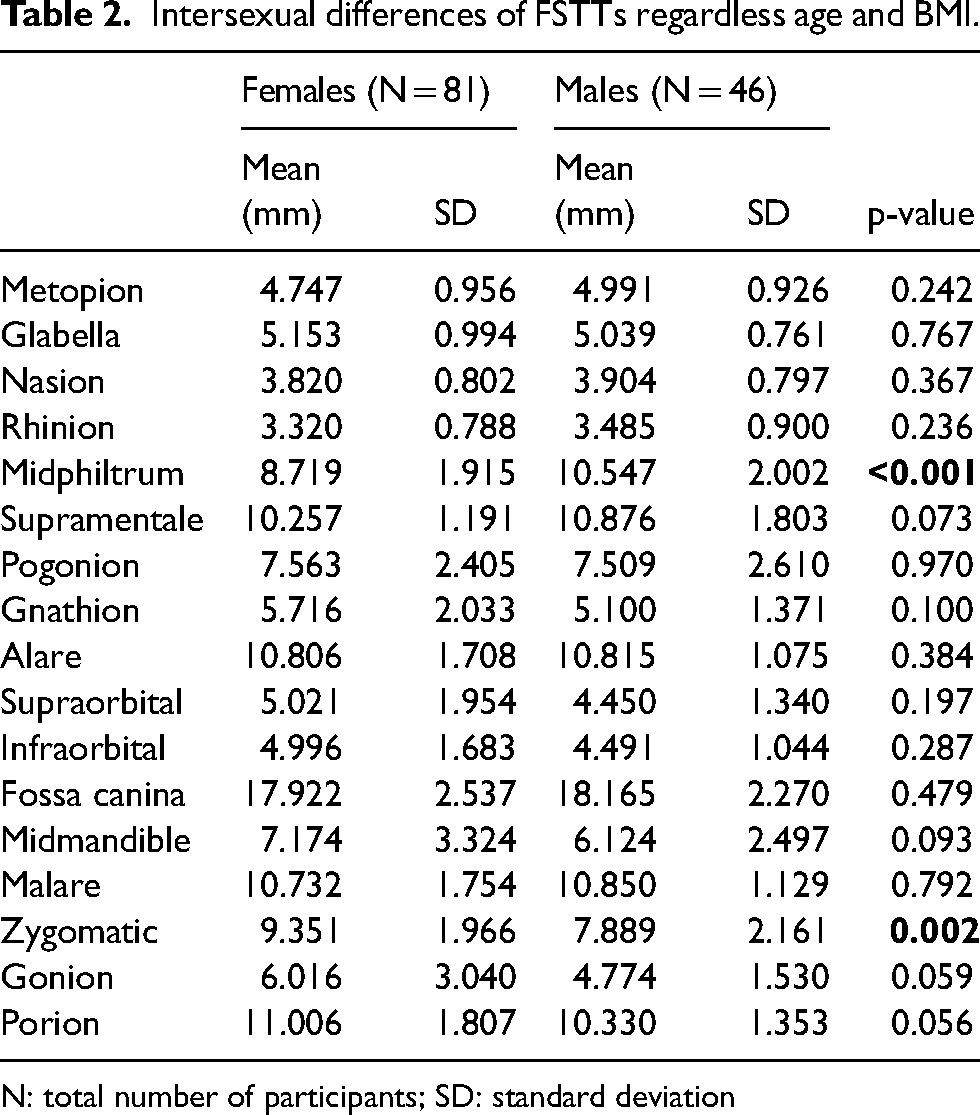
N: total number of participants; SD: standard deviation
In Table 3, subjects were categorized by age and BMI. The “normal weight” category had significant sex differences at the midphiltrum (p < 0.001) and zygomatic (p = 0.004) landmarks. Several anthropometric landmarks were significant in younger subjects – metopion (p = 0.042), nasion (p = 0.034), midphiltrum (p < 0.001), and zygomatic (p = 0.002). In the “overweight” category, significant differences were found in the midphiltrum (p = 0.047), and zygomatic (p = 0.003), gonion (p = 0.017), and porion (p < 0.001) bilateral landmarks.
Intersexual differences of FSTTs regard to age and BMI category.
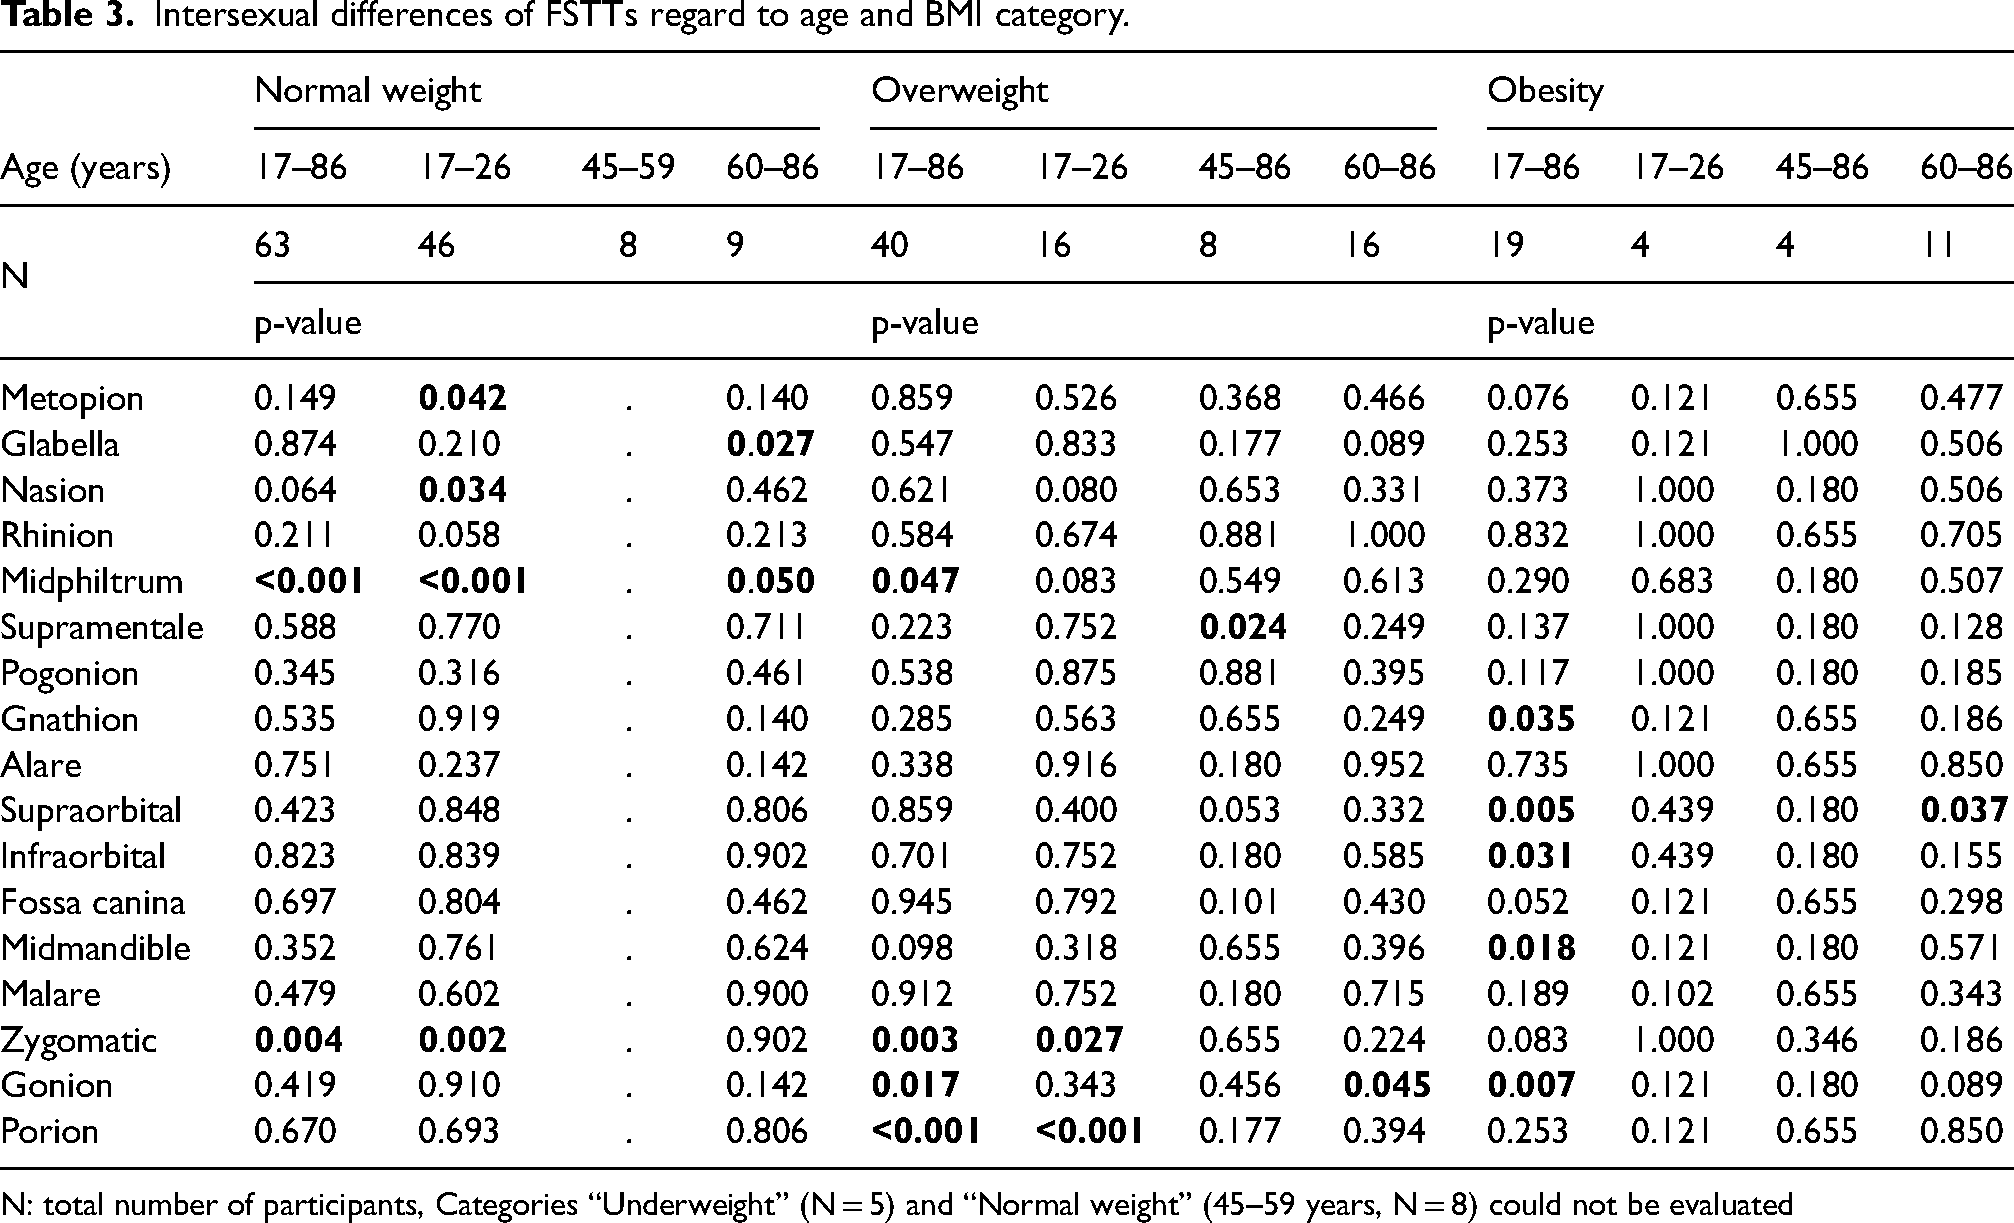
N: total number of participants, Categories “Underweight” (N = 5) and “Normal weight” (45–59 years, N = 8) could not be evaluated
In the obesity category, significant differences were found in the landmarks gnathion (p = 0.035), bilateral landmarks of the ocular region supraorbital (p = 0.005) and infraorbital (p = 0.031), and further significant differences were found in the landmarks midmandible (p = 0.018) and gonion (p = 0.007). However, the detailed age subcategories of the obesity category did not show differences between the sexes, except for the older category (60–86 years) at the supraorbital landmark (p = 0.037). According to our results, the differences between sexes could be influenced by increasing BMI values (Table 3). Statistically significant age differences (independent of sex) in FSTT were found in 11 of 17 anthropometric landmarks (Table 4). Differences in mean FSTT values of these landmarks between the younger age category (17–26 years) and the middle age category (45–59 years) ranged from 0.4 mm to 2.4 mm, with greater differences in the cheek and eye areas. Differences between the middle age category (45–59 years) and the older age category (60–86 years) ranged from 0.1 mm to 1.1 mm, with greater differences in the cheek area. Between the younger age category (17–26 years) and the older age category (60–86 years), differences ranged from 1.0 mm to 3.5 mm. Statistically significant differences between the four BMI categories of the FSTT were found at 10 of 17 anthropometric landmarks (Table 5).
Age differences of FSTTs regardless sex.
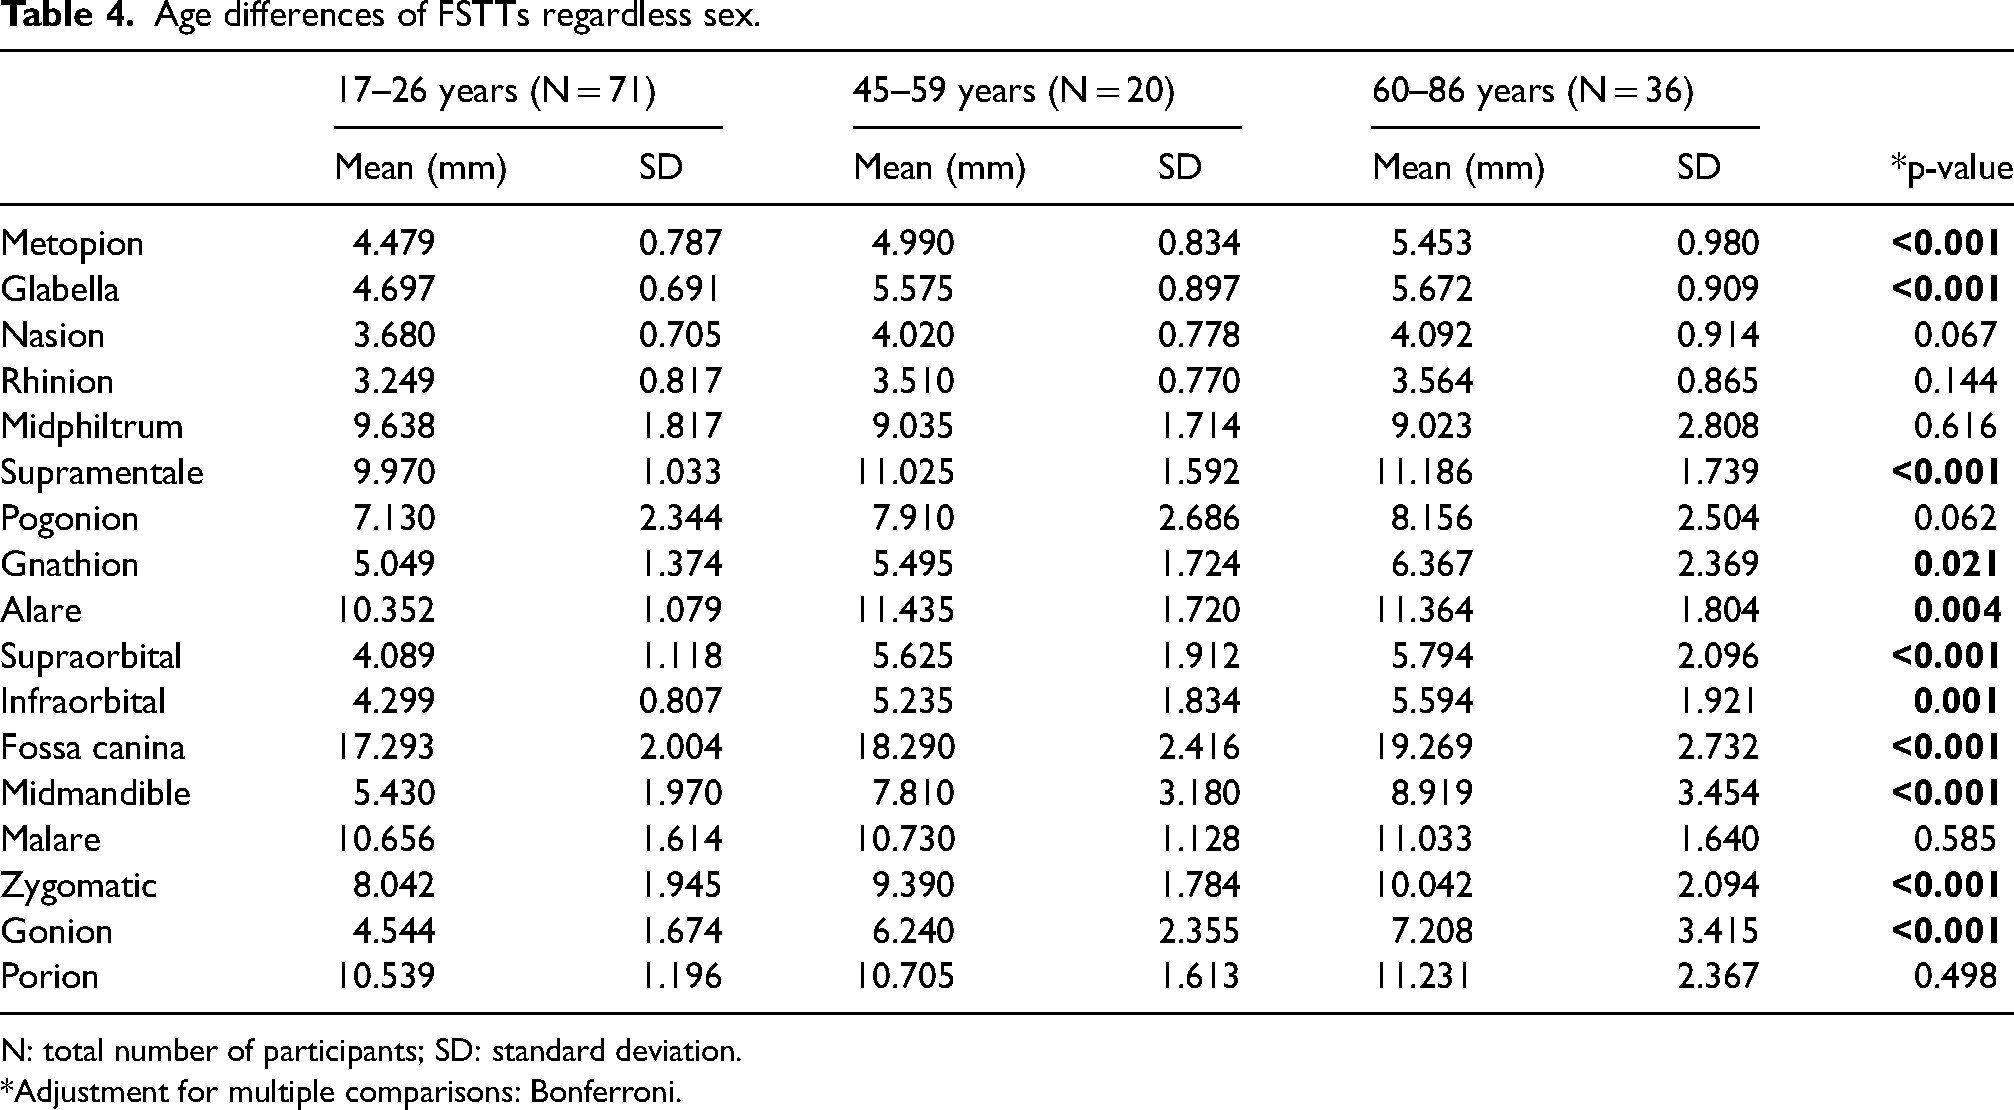
N: total number of participants; SD: standard deviation.
*Adjustment for multiple comparisons: Bonferroni.
Differences among BMI categories of FSTTs regardless sex and age.
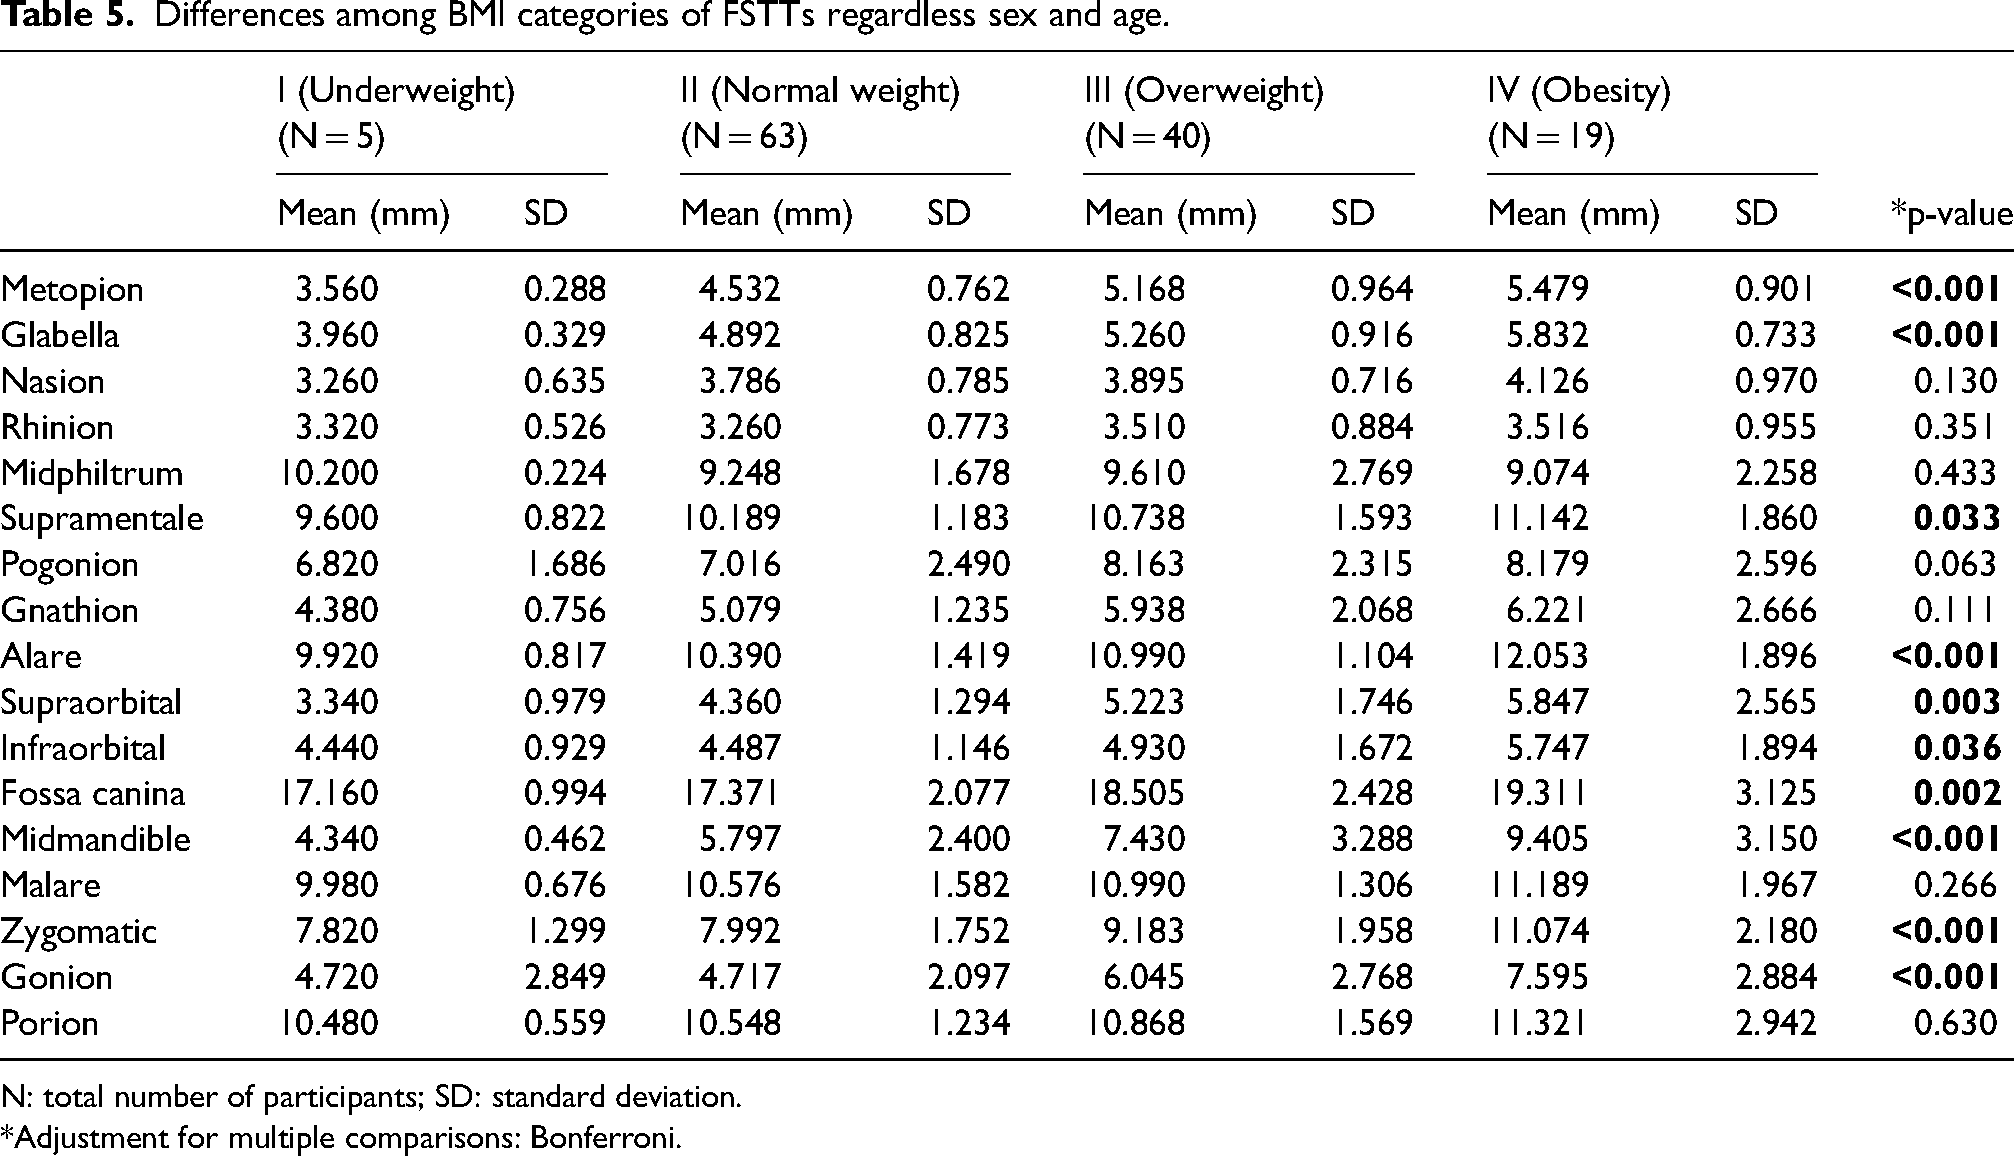
N: total number of participants; SD: standard deviation.
*Adjustment for multiple comparisons: Bonferroni.
Differences in mean FSTT values in the significant landmarks between the “underweight” category and the other categories ranged from 0.003 mm to 1.5 mm for “normal weight,” from 0.5 mm to 3.1 mm for “overweight,” and from 1.3 mm to 5.1 mm for “obese.” Larger differences were found in the cheek area (midmandible) and the eye area (supraorbital). The smallest differences in significant landmarks comparing the “underweight” category and the others were measured at the infraorbital anthropometric landmark. There were differences in significant landmarks between the “normal weight” category and the other two categories: from 0.4 mm to 1.6 mm for the “overweight” category and from 0.9 mm to 3.6 mm for the “obese” category, with the largest differences in the cheeks (midmandible, zygomatic, and gonion). The smallest differences in the mean values of the FSTTs at significant landmarks were in the forehead area (glabella and metopion). Differences in mean values of FSTTs in the overweight and obese categories ranged from 0.3 mm (metopion) to 2.0 mm (midmandible). Linear regression analysis showed that BMI, age, and sex could predict FSTT in some specific facial regions (Table 6). Sex, age, and BMI showed a relationship with FSTT in the midmandibular, zygomatic, and gonion landmarks. The theoretical value of FSTT can be calculated using the linear regression formula by adding missing values for sex, age, and BMI:
Linear regression equations from measured FSTTs in this study (n = 127) y = b0 + b1*sex + b2*age + b3*BMI; sex – male (1), female (2); age – years; BMI – kg/m2.
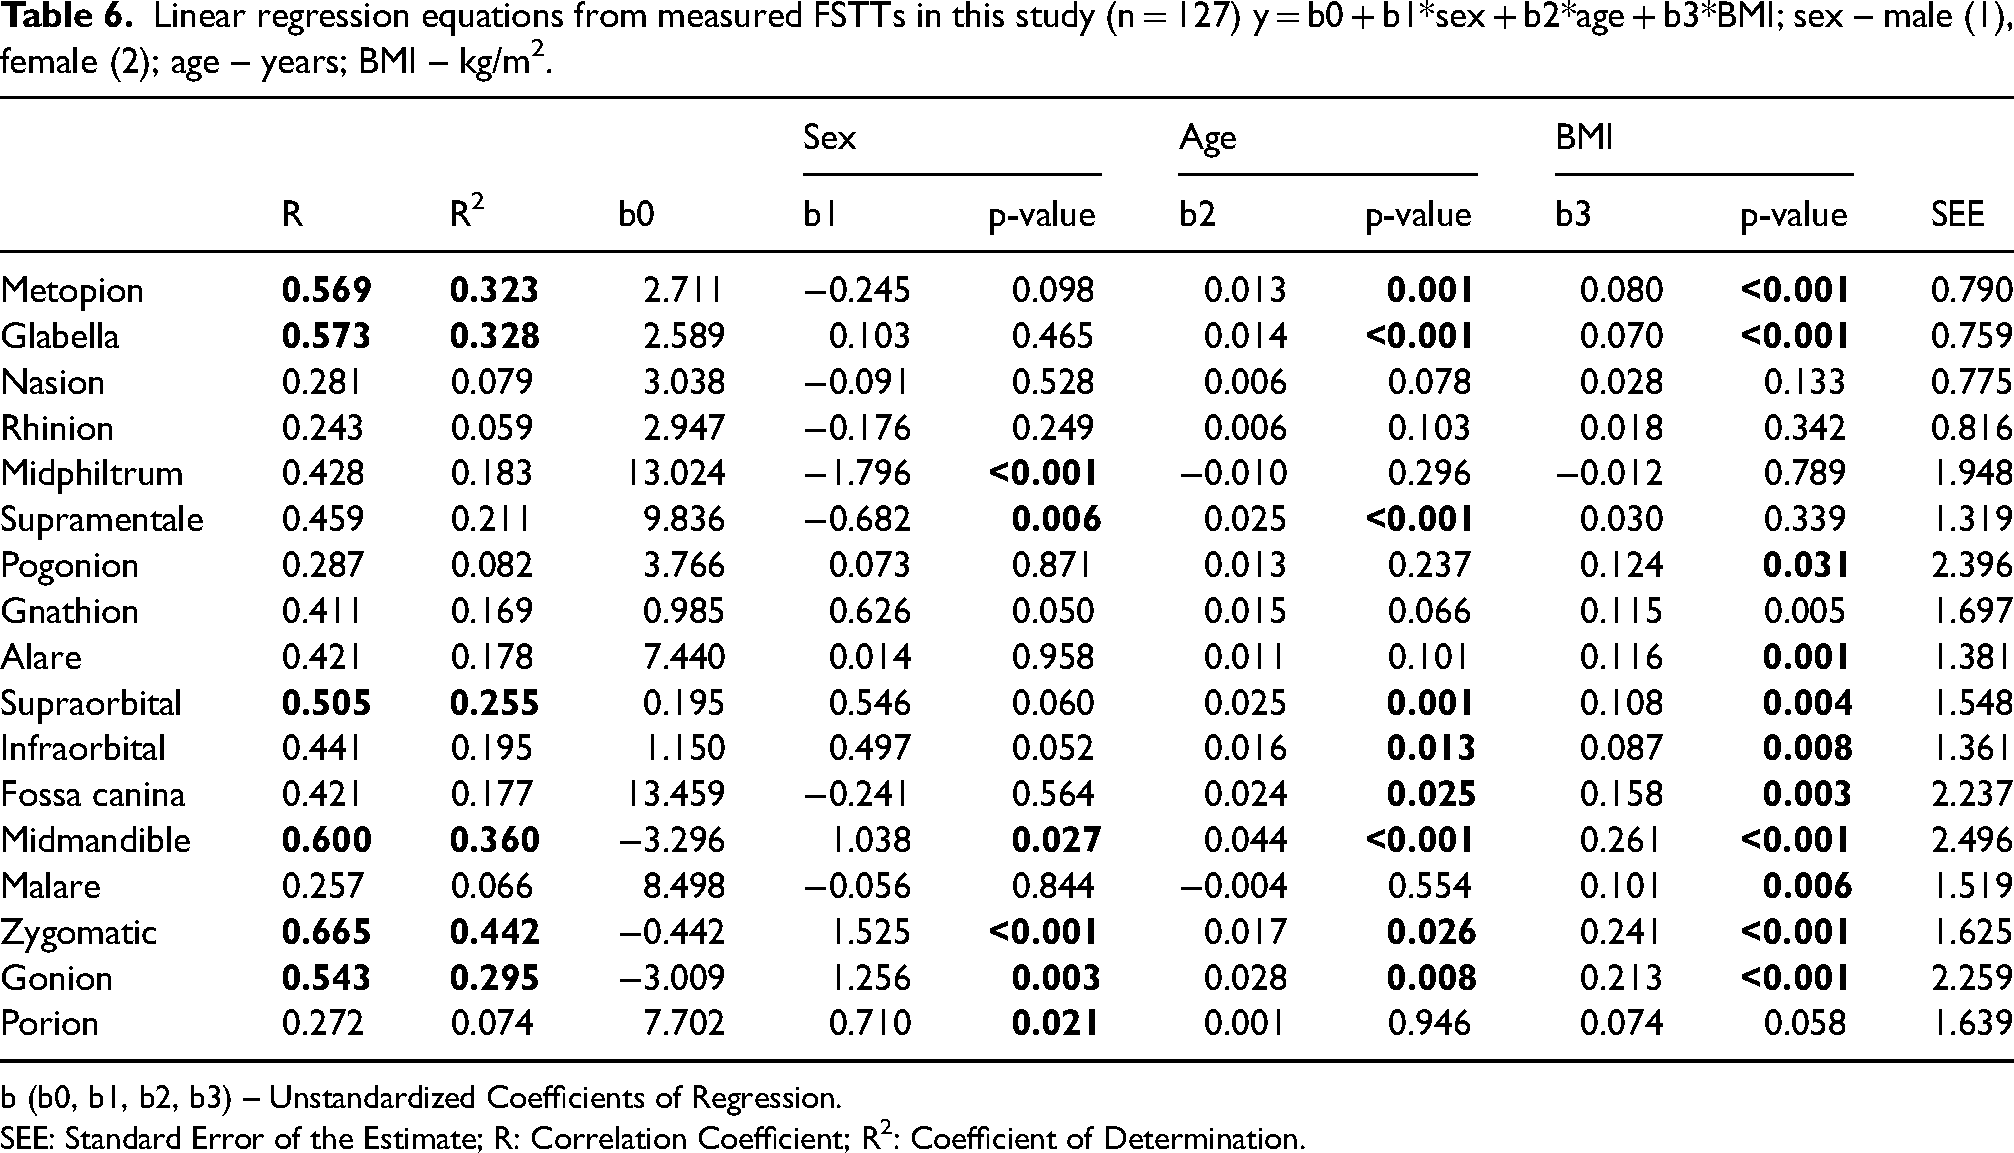
b (b0, b1, b2, b3) – Unstandardized Coefficients of Regression.
SEE: Standard Error of the Estimate; R: Correlation Coefficient; R2: Coefficient of Determination.
When estimating FSTT associated with age, sex, and BMI, the best regressors were metopion, glabella, supraorbital, midmandible, zygomatic, and gonion (Table 6).
Discussion
This study was conducted to investigate the relationship between facial soft tissue thickness and biological parameters such as age, sex, and BMI. In our study, FSTT was measured using noninvasive B-mode ultrasound technique in the upright position. We found that only two of 17 landmarks were sexually dimorphic and that there were no significant bilateral differences in paired landmarks. Differences between sexes could be influenced by increasing BMI values, except for midphiltrum, which we found to be influenced by sex. Statistically significant differences between age groups were present for the majority of landmarks measured. In addition, BMI was found to be statistically significant for most of the measured anthropological characteristics and had a positive correlation with them. Moreover, the study provides regression coefficients with significant strongest relationship between the landmarks and BMI, followed by age and sex in relation to the estimation of FSTT. Thus, both age and BMI should be considered as significant factors in relation to the virtually reconstructed facial structure, as they show positive changes in facial soft tissue thickness values. Together with the above, the present study provides research data on FSTT for Slovaks as a part of Slavic nations and Central Europe for further studies dealing with ethnic differences.
The B-mode ultrasound method was used because this method offers great advantages, such as noninvasive, safe in terms of absence of ionizing radiation, less expensive compared to CT (or CBCT), allows for both repeated measurements and safe measurements, and the ability to measure living, upright individuals.13,14 For facial reconstruction (mostly of skeletal remains or cadavers with missing soft tissue), it might be more useful to use measurements on living subjects in the upright position, as FSTT changes both negatively (thinner) and positively (thicker) in the measurement positions (upright and horizontal/supine). 26 In addition, the study by Stephan and Preisler 14 points out that in the context of craniofacial identification, data in the upright position are needed, as previous studies were mostly conducted in the supine position.
In the study by De Greef et al., 10 the differences between the sexes were mainly in the zygomatic region, with a difference in FSTT values of more than 2 mm. Other differences ranged from 1 to 1.5 mm in the upper and lower lip regions, where FSTTs were thicker in males. In females, FSTTs were thicker on the cheeks, around the eyes, and around the forehead, the glabella, then in males. 10 Compared with De Greef et al., 10 our measurements didn’t reveal differences of more than 2 mm.
We also found that the FSTT in most of the anthropometric landmarks of the medial line was thicker in males, except for the glabella and the chin area. The FSTT of lateral anthropometric landmarks had higher values in females, except for three landmarks – alare, fossa canina, malare, but these differences weren't statistically significant. According to our results, differences between the sexes could be influenced by increasing BMI values, except for midphiltrum, which was influenced by sex.
According to the study of De Greef et al., 10 the age differences were in the range of 1 to 2 mm. They found that the facial areas most affected by aging were the upper lip (middle philtrum, alare, canine fossa), the occlusal line, the lower edge of the orbit, and the mandibular angle. 10 Age-related changes are usually reflected in the data and are influenced by the position of the measured individual. 30 In this study, FSTTs were measured only in the upright position.
An example of various age-related changes is the study by Deng et al., 31 in which the authors examined the thickness of facial soft tissues in the Han population aged 21 to 50 years using the cone beam method CT. The influence of age proved to be insignificant as statistically significant differences (p < 0.05) were found in the nose, mouth, and cheeks, but there were only two significant points (p < 0.001) out of 60 anthropometric points: midmandible on the right side and prosthion. 31
Our results, on the other hand, show statistically significant differences between age groups for the majority of the measured landmarks, which could be due to a wider range of age categories used in our study, a difference in the ethnicity of the measured subjects between these two studies, or the difference in the method used (ultrasound vs. cone beam CT).
Some studies10,32 have confirmed the important role of BMI in FSTT for facial approximation. According to the study by De Greef et al., 10 the facial areas most affected by BMI were the anthropometric landmarks on the mandible (gonion and midmandibula), the occlusal line, and the inferior border of the orbit (orbitale). At these landmarks, the differences were up to 5 mm. In contrast, the upper lip (midphiltrum), nose (alare and rhinion), 10 and forehead (glabella) 26 weren’t affected at all or were minimally affected.
Similarly, we found statistically significant differences in anthropometric landmarks on the mandible and the inferior border of the orbit. Differences were also found in the forehead region, which could be due to the different ethnic origin of the subjects in these studies.
In the study by Kotrashetti and Mallapur, 32 a significant relationship was found between landmarks and sex and BMI in a linear regression. Age as a factor wasn’t significant at all. This could be due to the small age range of the participants. Sex was significant for most measured landmarks and had positive correlations with all medial landmarks. Negative correlations of the FSTTs were found in the chin and cheek regions. Positive correlations of FSTTs were found with BMI, which was significant for most landmarks. Similar to their study, we found that BMI was statistically significant for most of the measured anthropological landmarks and had a positive correlation with them.
Study limitations
Although the study makes an important contribution, there are some limitations that need to be mentioned. Population specificity must be considered for an accurate estimate. As mentioned earlier, the study was performed in Slovak individuals, so it might be interesting for further studies to compare the FSTT using the same technique (ultrasound) in Slavic nations or nations from Central Europe. Unfortunately, because the study was conducted during a pandemic, the number of participants was limited. When assessing sex differences, regardless of age or weight (BMI), the study sample was adequate due to the pandemic, which significantly affected the sample size. Further research is needed to increase the sample size for each age category, including adolescents, and the role of ethnicity should be investigated in further studies. In addition, in the context of body mass index (BMI) inaccuracy in athletes, individuals who participate in professional and competitive sports, and individuals with high muscle mass, it should be investigated how this may affect facial soft tissue thickness compared to average (non-athletic) individuals.
Conclusions
The present study contributes to the current research on FSTT by demonstrating the differences in FSTT values in relation to sex, age, and BMI in the Slovak population in the upright position using ultrasound. To the best of our knowledge, the study is the first of its kind in terms of the population, the study sample, the method of measurements and analysis, and the specific combination of factors studied. Beyond the above contributions, we provide valuable research data on FSTT for the Slovak population as part of the Slavic nations and as part of Central Europe from a historical-geographical perspective. We found that differences between the sexes in the FSTT were significant in only two of 17 anthropometric landmarks. The most significant dimorphism was observed in the cheek area, which was also evident when comparing age categories. For BMI, the smallest differences were between the “underweight” and “normal weight” categories, and the largest differences were between the two “underweight” and “normal weight” to “obese” categories. In terms of linear regression coefficients, the strongest relationship was between the landmarks and BMI, followed by age and sex in terms of estimating FSTT. The age and BMI factors showed evidence of positive changes in facial soft tissue thickness values, and these factors should be considered significant in relation to the virtually reconstructed facial structure. The measured values of soft tissue thicknesses can be effectively used in facial reconstruction or complex orthodontic and surgical procedures in the facial region.
Footnotes
Acknowledgements
The authors acknowledge the efforts valuable comments of the anonymous reviewers who helped to improve the quality of a manuscript and made it worth publishing.
Author contributions
Conceptualization and methodology: PŠ(U), MM, RB, MCh(K), SM; Data collection: MM, PŠ(U), RB; Formal analysis and writing-original draft preparation: PŠ(U), RB, MM, MCh(K), SM; Writing-review and editing: PŠ(U), MM, RB, MCh(K), SM; Supervision: PŠ(U), RB; All authors have read and approved the final version of the paper.
Declaration of conflicting interests
The authors declared no potential conflicts of interest with respect to the research, authorship, and/or publication of this article.
Ethical declarations
The study is assessed under the number ECH19026 and was approved by Ethics Committee for Human Research on the Faculty of Natural Sciences Comenius University in Bratislava, Slovakia.
Funding
This study was supported by the Cultural and Educational Grant Agency (KEGA 046UK-4/2023) of the Ministry of Education, Science, Research and Sport of the Slovak Republic.
Supplemental material
Supplemental material for this article is available online.
References
Supplementary Material
Please find the following supplemental material available below.
For Open Access articles published under a Creative Commons License, all supplemental material carries the same license as the article it is associated with.
For non-Open Access articles published, all supplemental material carries a non-exclusive license, and permission requests for re-use of supplemental material or any part of supplemental material shall be sent directly to the copyright owner as specified in the copyright notice associated with the article.