
Abstract
American singing accents are prevalent in popular music throughout the English-speaking world. Singing with an American-influenced phonological style is a supralocal norm, referred to here as Pop Song English (PSE). This article presents two perception experiments that explore New Zealand (NZ) listeners’ speech processing in musical and non-musical contexts. An analysis of the Phonetics of Popular Song corpus provides the foundation for the first experiment, revealing that sung dress and spoken trap have similar values for F1 in NZ. Experiment 1 then examines the categorization of these phonemes for words that fall on a continuum between bed and bad. In Experiment 2, a lexical decision task, NZ listeners hear words and nonwords produced by a New Zealand and an American speaker. In both experiments, results show that listeners are influenced by the presence of music, undergoing a perceptual style-shift. In Experiment 1, their perceptual phoneme boundary shifts to a more open position in the Music condition, and in Experiment 2, they exhibit a facilitation in reaction time to the US voice in the musical compared with the non-musical conditions. PSE is thus not only the norm for singing in NZ, it is also a norm for listening to song, represented in the minds of the general music-listening public. This finding extends our understanding of how speech perception depends on context. Speech and song are two highly distinct and perceptually contrastive contexts of language use, and listeners employ knowledge of how linguistic variation maps onto these contexts to resolve ambiguities in the speech signal.
Keywords
1 Introduction: The dominance of Pop Song English
A range of studies have demonstrated the international dominance of American Englishes (AmE) in popular music in the English-speaking world. Trudgill (1983) first documented this tendency in British music of the 1960s and 1970s. Simpson (1999) and Andres Morrissey (2008) showed that certain “Americanisms” continued to dominate British music in subsequent decades. The majority of sociolinguistic studies of the influence of AmE in pop music have focused on the USA-5 features (Simpson, 1999). These are a set of salient variables distinguishing British and American Englishes, such as the use of non-prevocalic /r/ and the presence of the trap–bath split. 1
Beal’s (2009) analysis of Sheffield indie band Arctic Monkeys suggested that the singer’s use of local accent variants in song is a marked stylistic choice, taken intentionally to project a non-mainstream stance. In the New Zealand (NZ) context, Gibson and Bell (2012) showed that the shift towards an American English phonetic style for three singer-songwriters involved a complete restructuring of the vowel space rather than just the adoption of salient “Americanisms.” In a corpus of popular music performances, Gibson (2024) found homogeneity between NZ and US pop singers, while regional variability was somewhat more apparent in hip hop performances. Rather than referring to the accent used in pop songs with reference to American Englishes, the term Pop Song English (PSE, Gibson, 2024) captures the international use of this supralocal norm.
Different genres of music are associated with different accents and dialects. Standard Southern British English features are adopted by choral singers in Trinidad as part of a Classical Choral Singing Style (Wilson, 2017) while reggae artists in Europe adopt features of Jamaican Creole (Gerfer, 2018). Blues artists outside of the United States adopt features of African American English as part of a Standard Blues Singing Style (De Timmerman & Slembrouck, 2024) as do hip hop artists around the world, as part of Hip Hop Nation Language (Alim, 2015), while country singers from non-US locations adopt (White) Southern American English (Duncan, 2017; Werner & Ledermann, 2024). Despite these distinctions according to genre, the core of the commercial music industry is mainstream pop music. The Standard Popular Music Singing Style (Gibson, 2020, p. 4) is PSE, the most widely sung variety in the dialectology of singing styles.
Beal (2009) and Gibson and Bell (2012) argue that PSE is adopted by singers without conscious effort, while the production of one’s own spoken dialect in song requires intention and awareness. Gibson and Bell (2012) frame the use of PSE in song as a responsive style-shift (Bell, 1984), that is, PSE is normative in the context of popular music and its use is the unmarked stylistic choice. A responsive style-shift is one which is “appropriate and predictable given the interlocutors and the context” in contrast with an initiative style-shift which “changes the communicative context in some way or reframes the interlocutors’ identities or roles” (Gibson, 2024, p. 474). From this perspective, NZ singers are not “putting on” an American accent, but simply singing in a way that reflects the majority of the input they have received in similar contexts.
The balance between automaticity (responsive stylistic moves) and intentionality (initiative stylistic moves) can be explored by looking for signs of stylization, such as the selection of only a subset of features from a target dialect, or overshoot in the adoption of such features (Bell & Gibson, 2011). The studies of NZ singers did not report any such evidence of intentional stylization. The adoption of PSE by New Zealand artists was both detailed (not selective) and accurate (with no evidence of overshoot). These findings suggest that these performers may be bidialectal, having acquired New Zealand English (NZE) in speech and PSE in song. However, examples of overshoot (specifically with respect to the hyper-correct use of non-prevocalic /r/) have been reported for some British singers (Campos-Astorkiza, 2024; Trudgill, 1983). For example, the word fast is realized as [fɑːɹst] in a song by Mumford and Sons, whose spoken accent is Southern British English (Campos-Astorkiza, 2024). This hypercorrect rhoticity provides evidence of intentional stylization of PSE by the singer, rather than a responsive shift. This example is complicated by the fact that the environment for hypercorrect rhoticity only emerges because the singer avoids adoption of the PSE variant of the bath vowel, [æ]. Non-US singers continue to face conflicting motivations (Trudgill, 1983), on the one hand being drawn to the normative accent for their musical style, and on the other wanting to avoid overtly marked usages of “Americanisms” that go against some sense of personal authenticity.
The extent to which the use of PSE by non-US singers is an automatic or intentional style-shift thus remains an unresolved issue. As an alternate means of inquiry, in this article we explore the following question: is PSE acquired only by singers, or does it exist at a population level? That is, do listeners acquire PSE as well, even if more passively? Is there also a responsive style-shift that can be observed in perception? Most New Zealanders grow up with ample access to these two distinct dialects, with each dialect heard in clearly defined contexts of use. Pop music is a ubiquitous feature of modern life in New Zealand and is generally performed with PSE, irrespective of a singer’s place of origin. Children grow up hearing mainly NZE in speech and mainly PSE in singing. (For a discussion of how this situation may have came about, see Gibson, 2020, pp. 15–17.)
Singers clearly learn to style-shift between these contexts, exhibiting what appears to be a kind of bidialectalism, and for the singers studied by Gibson and Bell (2012), this style-shift appears to be a responsive one. The next section discusses research that shows that listeners adapt their speech perception according to sociocontextual information. We consider this adaptation of a listener’s frame of reference for a given language encounter as a kind of “perceptual style-shift” (Gibson, 2010, p. 147). Just as the speaker attunes their speech to the context, so too does the listener. This article reports on two experiments that explore whether New Zealanders undergo a perceptual style-shift when they encounter singing. In doing so, it aims to expand our understanding of the cognitive underpinnings of Pop Song English as a context-dependent norm.
2 Perceiving speech, perceiving song
Research on singing accents has largely focused on the output of sung voices (though see Squires, 2019; Jansen, 2022), without considering the role of speech processing. This study explores how our experiences perceiving sung voices might drive the formation and maintenance of Pop Song English as a context-dependent norm. In this section, we explore literature that shows how sociocontextual information can affect speech perception. We then consider how the contexts associated with sung voices cohere in ways that are highly distinct from contexts associated with spoken voices. Our overarching predictions are then presented, followed by a discussion of the possible mechanisms involved in the predicted perceptual style-shifts.
2.1 Effects of sociocontextual information on speech perception
Language users track the indexical relationships between linguistic and non-linguistic variables (Hay, 2018) and this probabilistic knowledge influences their speech perception (Drager, 2010). Following variationist sociolinguistics, most studies in this area have focused on social variables related to categorical macro-social aspects of a speaker’s identity such as their gender (Johnson et al., 1999), class (Hay et al., 2006), ethnicity (Staum-Casasanto, 2008), or age (Drager, 2011). For example, Johnson et al. (1999) show a shift in the position of the perceptual boundary between /s/ and /ʃ/ according to whether a listener believes (or even imagines) they are listening to a male or a female speaker.
Recent work has shown that these principles go beyond static demographic categories. Perception can shift according to associations between personae and sociolinguistic variables. For example, a word ambiguous between trap and lot is more likely to be heard as trap if the listener is expecting a speaker of Californian origin, and also if they expect to hear a “valley girl” persona (D’Onofrio, 2018). Beyond speaker characteristics, there is some evidence that learned associations between phonetic variation and physical spaces can also affect vowel perception (Hay et al., 2017). The premise for the study by Hay et al. was the fact that most of our experiences inside a car involve background noise and concomitant Lombard speech. Speech produced in noisy environments (Lombard speech) is characterized by increases in intensity and F0, and can also involve increases in the first formant of vowels. The study found that even when seated in a quiet car, participants produced Lombard speech, presumably through their learned context-based associations. Participants listening in a quiet car also appeared to adjust their vowel perception, interpreting speech as if it were Lombard speech.
These effects can be interpreted as speech perception being affected by listeners’ expectations. Such expectations can be formed on the basis of knowledge of the social situation or speaker, or from a preceding stretch of speech (Ladefoged & Broadbent, 1957; Rakerd & Plichta, 2010). Listeners also form higher level expectations. For example, bilinguals may form an expectation that they will hear one or another of their languages, and this in turn can shift the position of a phoneme boundary (Gonzales et al., 2019). Borsky et al. (1998) showed how semantic contextual congruence affects phoneme categorization, with a bias toward hearing the semantically sensible option when presented with an ambiguous phoneme, for example, a bias to hear “milk a goat” rather than “milk a coat,” even with a relatively /k/-like initial phoneme on the target word.
Speech perception has also been shown to be facilitated if the stimulus more closely matches previous experience. For example, talker-specific information has been shown to be retained in memory (Goldinger, 1996b), as has talker-extrinsic information (e.g., seemingly irrelevant background noises) that co-occurred with a word at the time of encoding (Cooper & Bradlow, 2017; Pufahl & Samuel, 2014). A stimulus is thus more easily retrieved if the previously experienced, seemingly irrelevant, information is present. While congruence between past experience and a stimulus facilitates perception, this does not need to be an exact match. For example, Walker and Hay (2011) found faster and more accurate responses to words where the age of the voice was consistent with voices that the listener is likely to have encountered that word in (e.g., older voices for words used more by older speakers). Although listeners are unlikely to have experienced the word in the specific stimulus voice, the voice is nonetheless more similar to previously experienced voices than a younger voice would be.
2.2 Singing and speech as distinct domains of experience
While the key building blocks of language (phonology, syntax, lexicon, etc.) remain constant across singing and speech, the distinction between the domains of conversation and song is stark at the phonetic level, as well as in general experience. Singing involves extended steady state pitches while speech has more dynamic fluctuations in fundamental frequency. The range of pitches used in singing can also be much greater than those used in speech (though this is strongly determined by genre). Different singing styles have different approaches to phonation, to the position and stability of the larynx, and to the degree of jaw opening, but these are often quite distinct from those used in speech. The rhythm of a sung phrase is structured differently to the rhythm of speech. These rhythmic differences can also result in vowel differences, such as the elongation of unstressed syllables, or the extension of the nucleus of diphthongs.
Beyond articulatory factors, there are a range of acoustic differences between song and conversation, notably the presence of musical instrumentation in the former. The non-possibility of interaction with the singer is one of many functional differences between language in general usage and language in song. There are also differences between speech and song in terms of lexical frequency. While some words have a similar lexical frequency in singing and speech, others are high frequency in song but low frequency in speech, or vice versa (Gibson, 2020, pp. 169–172). Finally, recorded vocals are heard in the exact same form multiple times—for favorite songs, hundreds of times—whereas our experience with spoken words is dominated by a lack of invariance (Appelbaum, 1996; Johnson, 1997; Kleinschmidt & Jaeger, 2015) between occurrences. Along with all of the above, there are dialectal differences between spoken and sung voices, as discussed in the introduction.
2.3 Overarching predictions and possible mechanisms
Based on the above literature, and the strong distinction between speech and song, we hypothesized that listeners may behave differently when they (believe that they) are encountering singing, as opposed to speech. We present stimuli in silence, noise, and in music, and we test the effect of this difference in two experiments. Experiment 1 is a simple phoneme categorization task, in which we predict participants will associate the same stimulus to different phonemic categories, depending on whether the stimulus is presented as spoken or sung. Experiment 2 is a lexical decision task in which participants respond to US and NZ voices, where the words are presented as spoken or sung. We predict that NZ listeners will be faster to react to the NZ voice in the spoken condition, but faster to react to the US voice in the sung condition. We use the term perceptual style-shifting to describe the overarching hypothesized phenomenon.
The literature reviewed above provides for multiple possible mechanisms which would lead to the predicted results. We focus on two main possibilities here, the first of which is based on expectations. If NZers expect different accents in singing to speech, then this alone could lead them to process sung tokens as more PSE-like, and to recognize sung PSE-like words more quickly than words in a NZE accent. This is because even before they hear the voice, they can form expectations about the realizations they might encounter in each register. It may be helpful to think of NZers as bidialectal: they have a full command of both NZE and PSE, acquired from an early age. Chevrot and Ghimenton (2018) emphasize that the distinction between bidialectalism and bilingualism should be treated as gradient rather than discrete. While there is little research on the role of expectation in the speech perception of bidialectals, bilingualism research offers relevant studies. Bilinguals, for example, may have one or the other of their languages at a higher resting activation given which language (or how many languages) they expect to hear (Dibbern & D’Onofrio, 2023; Gonzales et al., 2019; Grosjean, 1998).
A second possible mechanism could rely on the degree of acoustic match of stimuli to stored memories of previously experienced singing versus speech. If stored memories of sung words are comprised of more PSE-like experiences, then stimuli presented in music will likely match these memories better than those presented in silence, which would match memories of NZE more accurately. That is, just as an extraneous noise, such as a dog barking (Pufahl & Samuel, 2014), can be stored with lexical memories and facilitate subsequent access, so, too, could musical accompaniment. It is not our intention to distinguish between these mechanisms. Indeed, it seems likely that both work together. A Pop Song English frame of reference for processing sung language could come about both because this is what listeners expect, and also because this is what matches the input best.
Our goal in this article is to demonstrate that New Zealanders undergo a perceptual style-shift when encountering singing. It is not to distinguish between the various mechanisms that could underpin this style-shifting, nor to argue for any particular theoretical interpretation of this effect. Pop music singers shift to a PSE style when singing. In this article, our core research question is this: Do pop music listeners also shift to a PSE style when listening?
3 Corpus analysis: dress and trap in speech and song
Before turning to Experiment 1 (in section 4) which focuses on the perception of the NZ short front vowels, an empirical foundation is laid in this section by presenting an analysis of these vowels in singing and speech. The dress and trap vowels are involved in a chain shift in NZE, and are raised and fronted compared with other dialects of English (Hay et al., 2008). Even though the change has been going on for over a century, there is still considerable variability in present-day NZE (Villarreal & Clark, 2022). There is structured variability in the community according to age, for example. Younger speakers generally have more raised variants of dress and trap than older speakers, though Ross et al. (2023) present recent evidence of lowering for these vowels among young speakers from Auckland. No matter where an individual is positioned within the range of variation in NZE, however, the premise of Experiment 1 should hold true: native speakers of NZE will have been exposed to systematically different vowel realizations for the phonemes dress and trap in pop songs as compared with non-musical contexts, with raised vowels in speech and open vowels in song.
The raising of trap in spoken NZE means that it may have a similar vowel height to sung dress. This section provides a brief empirical exploration of this possibility, using data from several sources: indicative values for F1 in sung dress and trap are obtained from the Phonetics of Popular Song (PoPS) corpus (see, Gibson, 2024; Gibson, 2025); values for spoken NZE are obtained from the Canterbury Corpus (Gordon et al., 2004); and values for spoken American English are taken from Clopper et al. (2005).
3.1 Corpus analysis: Methods
The PoPS corpus includes 190 pop and hip hop songs by artists from NZ and the United States, with transcriptions force-aligned at the phoneme level and stored and managed in LaBB-CAT (Fromont & Hay, 2012). Based on the 125 songs by male singers/rappers, a search was conducted for dress and trap vowels before coronals. For the first viable token in each song, F1 was estimated using Praat (Boersma & Weenink, 2019), with number of formants set to 6 and maximum formant set to 5500 Hz. The analysis here is restricted to F1, as vowel height is the key acoustic variable of interest in the phoneme categorization task. F2 was not measured for these vowels.
To maximize comparability, the scope of tokens considered for analysis was constrained in the following ways. Falsetto tokens were identified impressionistically (sung in a particularly high range and having a distinct voice quality) and excluded. Due to dialectal differences in the pre-nasal tensing of trap, tokens followed by nasals were excluded. Tokens followed by /l/ were also excluded because prelateral dress and trap are merged in NZE (Thomas & Hay, 2005). All tokens came from stressed syllables where the recording of the sung vocal performance was isolated enough from the background music to allow Praat to accurately track the formants. F1 was measured from as close as possible to the midpoint of the vowel while avoiding deviations in formant tracking caused by instrumental sounds.
To make a comparison to typical formant values in spoken NZE, F1 was measured at the vowel midpoint for male speakers from the Canterbury Corpus reading the words bed (n = 404) and bad (n = 405). Indicative values for spoken AmE come from the un-normalized F1 measures for male speakers presented in Clopper et al. (2005), from read instances of the words head and had. Only speakers from the Mid-Atlantic, Midland, Southern, and Western dialect areas were considered, excluding measurements for Northern and New England speakers. These latter areas include varieties of AmE that have raised trap, for example, as part of the Northern cities vowel shift or as part of a system of short-/a/ tensing. The extent to which such varieties are performed in popular music is an interesting question for future research.
3.2 Corpus analysis: Results
Figure 1 provides the mean F1 values of dress and trap for the speech and singing of speakers/performers from NZ and the US. Several observations can be made from these values:
New Zealanders have raised dress and trap in speech, but open dress and trap in song, supporting the findings of Gibson and Bell (2012)
The NZ and US performers have similar realizations of dress and trap to one another, supporting the idea of PSE as a supralocal norm (Gibson, 2024).
Unlike the NZ scenario, for speakers/performers from the United States, the F1 measures in popular song are similar to (or slightly higher than) those for speech, echoing studies that found similarities between singing and speech for US country artists (Duncan, 2017; Stone et al., 1999).
Finally, and most importantly for the purposes of Experiment 1, spoken NZE trap has a similar F1 value to PSE (and AmE) dress. If we imagine a hypothetical listener categorizing a vowel on the basis of just this one dimension of linguistic information (cf. Todd et al., 2019), then upon encountering a token with an F1 of 550–600 Hz, the best way to determine the vowel category is through context: if it is song, it is likely to be dress, and if it is speech, it is likely to be trap.
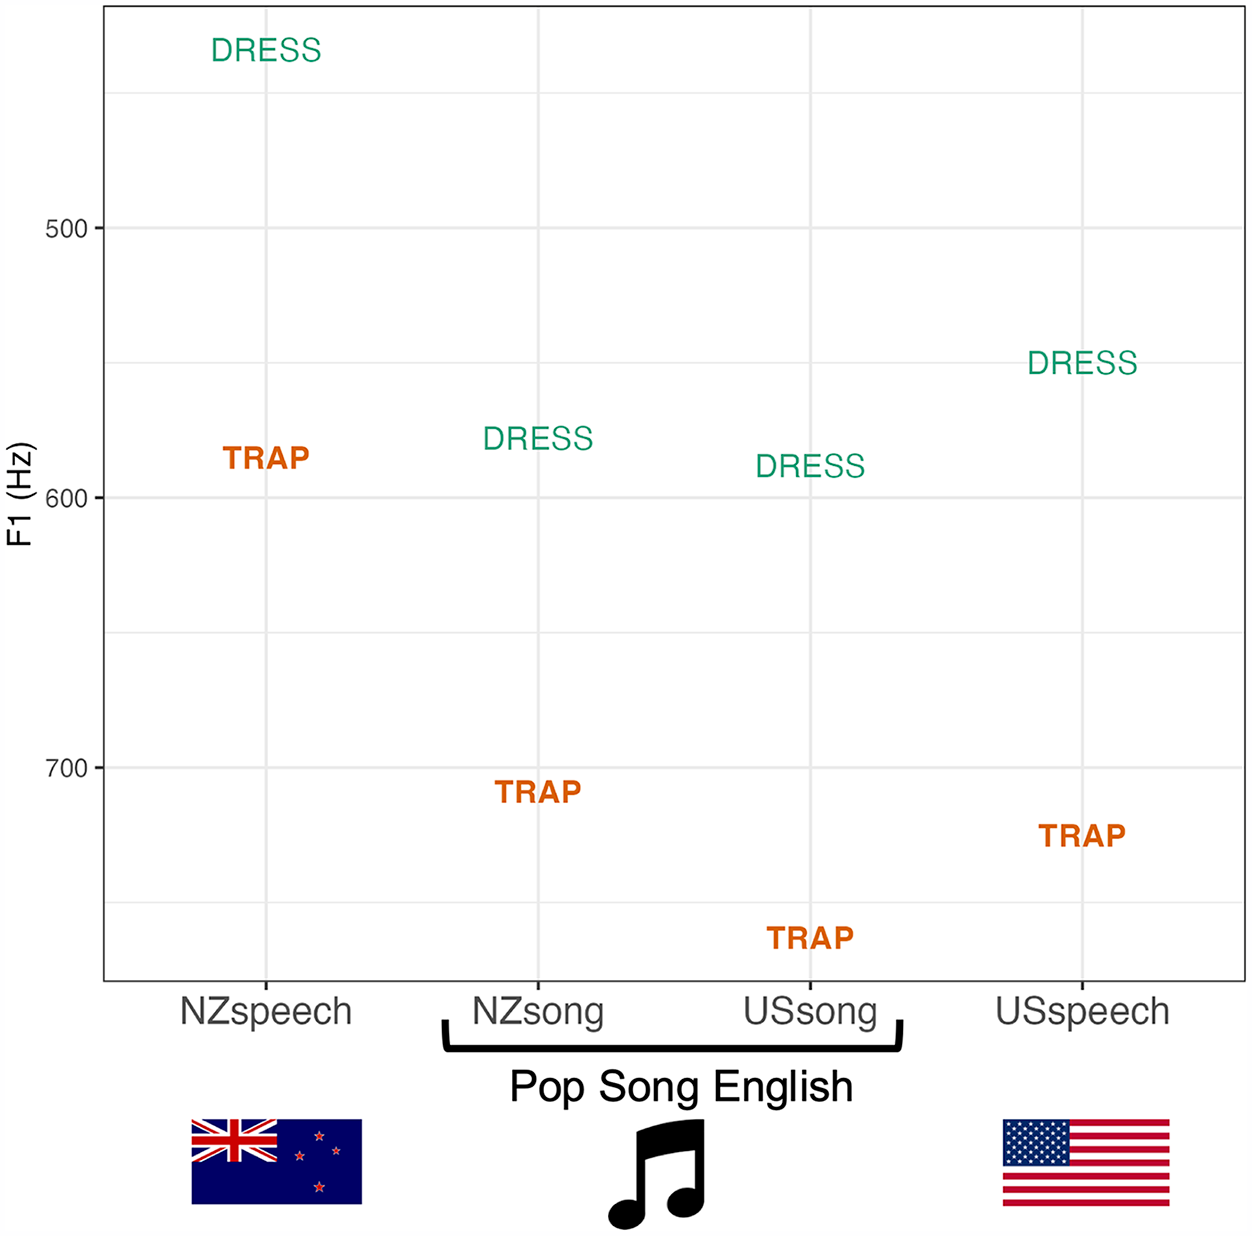
F1 for NZ and US males’ dress and trap vowels in singing and speech.
3.3 Corpus analysis: Discussion
The data presented in Figure 1 comes from three disparate sources involving different methods, language activities, and groups of people, so the comparison can only be taken as a rough illustration. That said, the distinction between spoken NZE and the other varieties is stark enough that even a very large margin of error is unlikely to change the core point: an average spoken NZE trap is at a vowel height comparable to an average sung dress (irrespective of whether the singer is from NZ or the US).
4 Experiment 1: Phoneme categorization task
In Experiment 1, we conduct a simple phoneme categorization task, in which participants listen to ambiguous tokens of short front vowels. We predict that categorization will differ depending on whether they are led to believe that the tokens are being spoken or sung.
Probing listeners’ knowledge of variation in the NZ short front vowels according to speaker age, Drager (2006, 2011) conducted two phoneme categorization tasks which provide the foundation for the present experiment. The stimuli were a set of words which ranged on a continuum from sounding like the word bed to sounding like the word bad, and participants decided which word they heard. As younger speakers in Canterbury, where this research was carried out, have more raised vowels than older speakers, Drager hypothesized that participants would be more likely to categorize an ambiguous token as bad if heard in a younger sounding voice, than a word with the same vowel formants spoken by an older sounding voice. Indeed, participants responded that they heard bad more often to a younger sounding speaker, with perception thus reflecting patterns in production. In addition, the study by Hay et al. (2017) explored perception of this vowel continuum, finding some indication that listeners shifted their perceptual phoneme boundary as if listening to Lombard speech when they were in the quiet car (with its associations of background noise) as compared with the lab.
Experiment 1 follows a similar principle. As described in the corpus analysis in section 3 above, the boundary between New Zealanders’ dress and trap vowels is different in singing versus speech. Our experiment tests whether this difference is also observable in perception.
4.1 Experiment 1: Overview and predictions
This experiment aims to investigate whether phoneme categorization can be influenced by listeners’ knowledge about the phonetic differences between singing and speech. 2 Listeners make a two-alternative forced choice between the words bed and bad. Each listener hears the stimuli in three distinct conditions, each presented in a different block of the experiment. In the Music condition, they are told they will hear a New Zealander singing. The stimuli they respond to occur in a musical context, in time and in tune with an instrumental accompaniment. In two control conditions, participants hear the exact same stimuli in the context of background noise (Noise), or in the clear with no background audio (Silence). The words used in this experiment, bed and bad, are well matched in terms of lexical frequency (244 and 209 occurrences per million words, respectively, in the CELEX lexical database), and we do not expect lexical frequency to affect the results.
We predicted that New Zealanders would expect Pop Song English in the Music condition, and would therefore shift the boundary between dress and trap according to the context. Listeners would expect raised dress and trap, typical of NZE, in the non-music conditions. An ambiguous stimulus in the middle of the continuum would be categorized as bad in these non-music conditions. In the Music condition, however, the same ambiguous stimulus might be categorized as bed, consistent with PSE. The hypothesis of the experiment is thus that there will be a greater proportion of bad responses in the Noise and Silence conditions than in the Music condition. If participants show this perceptual style-shifting, this would suggest population-level associations between pop music contexts and the phonological patterns of PSE.
Following Ganong (1980), the first trial of the experiment, while participants are still relatively naive, is employed in the design and analysis of the experiment presented in this article. While the experiment as a whole uses a within-subjects design—each participant encounters all three conditions: Music, Noise, and Silence—a distinct between-participants design is also employed. Each participant hears the same stimulus in the very first trial of the experiment, with a third of the participants assigned to each condition. Analysis of this first trial tests listeners’ reaction to being told they will hear singing, and being primed by a musical accompaniment.
Given the findings from Hay et al. (2017), it seems plausible that any type of non-silent condition could invoke expectations of Lombard speech. It is thus important to include a Noise condition, in which the stimuli are heard in the context of a non-musical background noise, to distinguish the effect of music from any potential effects related to noise masking more generally. If there is a shift in the perceived phoneme boundary caused by singing as opposed to speech, then the Music condition should have fewer bad responses than either the Noise or Silence conditions. If there is also an effect of perceived Lombard speech (and thus more open vowels) in noise—then responses in the Noise condition may be between those in Silence and in Music. That is, any perceptual Lombard effect might apply to both the Noise and Music conditions, because the background music is itself a kind of masking noise. However, the central prediction of this experiment relates to an expected perceptual style-shift cued by changing the context from non-musical to musical. This dialect-based effect is in the same direction as the Lombard effect (more open vowels in PSE than NZE, and more open vowels in a noisy environment), and so it is important to establish that the effect applies to the comparison of Music and Noise, not just Music and Silence.
4.2 Experiment 1: Methods
4.2.1 Creation of stimuli
The phoneme categorization task includes 12 single-word stimuli that fall along a continuum from bed to bad, a musical backing track for the Music condition, and background noise for the Noise condition. Participants hear exactly the same stimuli in each of the three conditions. These do not sound as if they were sung when heard in isolation, but once set to the background music they fit rhythmically and harmonically with the backing instrumentation, to give an impression of singing.
The original sound recording used for resynthesis was recorded by the first author with the intention of falling roughly in the middle of the desired continuum, by producing a “normal” NZE bad. At the midpoint, the vowel had an F1 of 505 Hz and an F2 of 1910 Hz. These values fall within the inter-quartile range for raw values for trap from a large sample of NZ males, based on the supplementary materials from Brand et al. (2021), where mean F1 = 550 Hz and mean F2 = 1831 Hz. All stimuli used in the experiment had F1 and F2 resynthesized, but this intermediate recording meant that neither end of the continuum sounded more or less manipulated than the other. The intended pitch of the recording was the musical note E3, which equates to a fundamental frequency of 164.8 Hz, the recorded token was near to this, with an F0 of 165.7 Hz. This fits with the key of the musical accompaniment which is in A major. The stimulus plays on the first beat of every second bar. While not particularly melodic, the “sung” word thus fits coherently into the tonality and rhythm of the music.
Even though dress and trap are both phonemically short, many varieties of English have a vowel length distinction between the two vowels, with trap being longer. To test this in modern NZE, a basic analysis of wordlist data in the Canterbury Corpus (Gordon et al., 2004) was undertaken, comparing all instances of the words bed and bad. To determine the length ratio between the two vowels, the average duration of the vowel segment for each of these words was extracted, using the force-aligned boundaries already existing in the corpus stored and managed in LaBB-CAT (Fromont & Hay, 2012). For bad the average vowel length was 294 ms, and for bed it was 235 ms. The length of bed is thus 80% the length of bad. This ratio of averages provides a useful (albeit simplistic) empirical basis from which to create a shorter and a longer version of each stimulus in the present experiment. Length (shorter vs. longer) is included in this experiment as a control, with the expectation that listeners will respond bad more often on longer tokens.
The length of the original recording was 525 ms, from onset of the pre-voicing of [b] to the tail of the burst from the [d], with the vocalic portion lasting 380 ms. The word was performed with the tempo of the music in mind (80 beats per minute), such that it would sound like it was “in time” with the music, by being an eighth-note length (an eighth note at this tempo is 375 ms, roughly matching the vocalic portion of the recorded word). A short version of the soundfile was made prior to vowel resynthesis. The vowel in this shorter stimulus was made to be 80% of the length of the vowel in the long stimuli, based on the analysis of Canterbury Corpus wordlist data discussed above. To do this, 75 ms was removed from the middle of the vocalic portion of soundfile, taking care to make cuts at zero point crossings, beginning and ending at an analogous part of the complex waveform. The resulting shorter soundfile was 450 ms long with a vocalic portion of 305 ms. The six step vowel continuum was created from the short and long soundfiles, using LPC in Praat to manipulate formants for resynthesis. The amplitude of the twelve resulting stimuli was normalized to 0.105 Pascal/74.4 dB SPL.
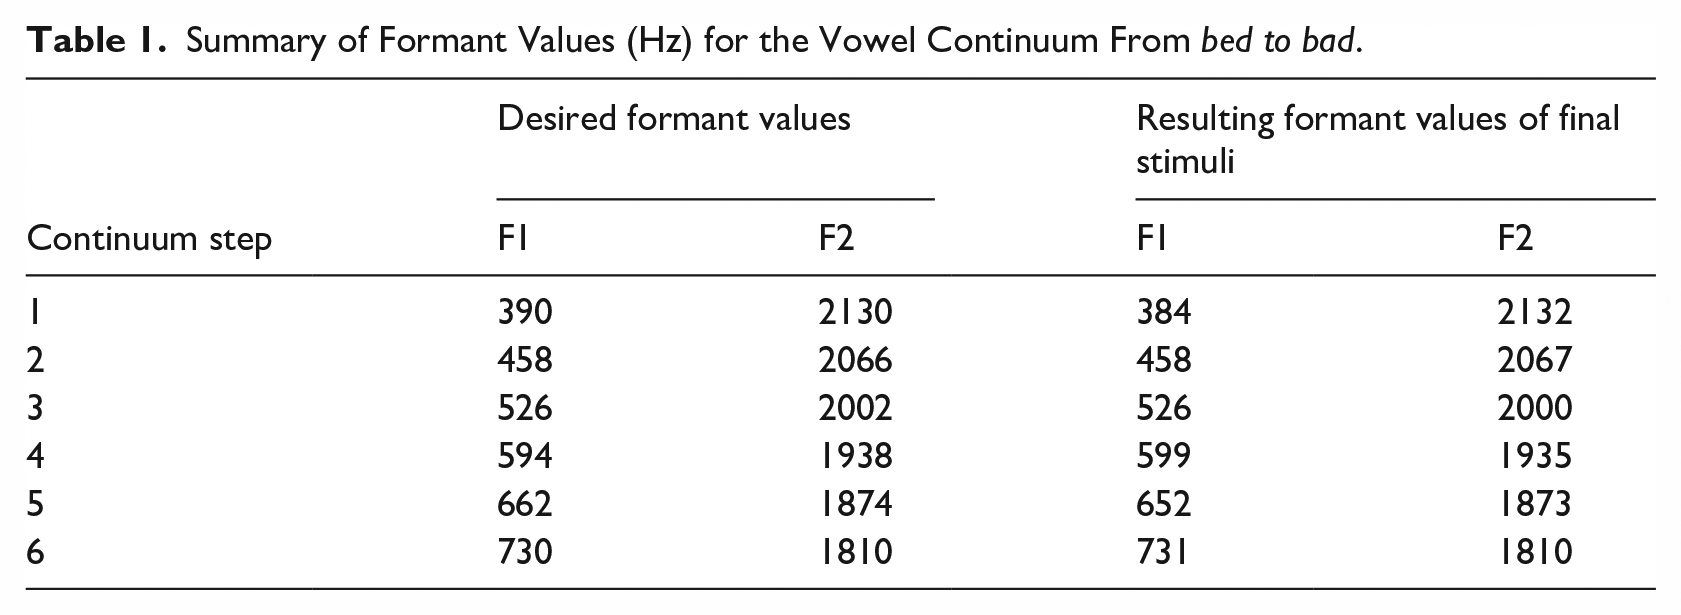
Decisions about the end points of the continuum used the results of a prior acoustic analysis of three NZ male singer-songwriters as a reference (Gibson, 2010, pp. 106–110). Along with these reference values, we considered the values of the continua used in the perception experiments discussed above (Drager, 2011; Hay et al., 2017), and a continuum was created between the following two end points: 390–730 Hz for F1 and 2030–1810 Hz for F2. Table 1 shows these desired formant values, along with measurements made on the final stimuli. The F1 values used in the present experiment necessarily have a wider range than those used in previous studies. This is because the present study has to encompass plausible realizations across two distinct registers, ranging from a plausible (spoken) NZE dress to a plausible (sung) PSE trap. The most bad-like token in the continuum, step 6, is similar to an average sung trap (which for NZ singers was 709 Hz) and the first step of the continuum is representative of the raised NZE dress.
Summary of Formant Values (Hz) for the Vowel Continuum From bed to bad.
4.2.2 Music and noise
The background music is in a soft pop style consisting of guitar, keyboard, bass, and drums cycling around the chord progression |A |F#m |D |E7 | in a 4/4 time signature with a tempo of 80 beats per minute. This is a continuous stretch of music that runs throughout the Music block. The speech stimuli are overlaid on this background music in a way that makes them sound plausibly as if they are part of the song. The soundfile was edited to fit the length of the experiment. The Music condition had a four bar long introduction to enhance expectations of singing, and the ending of the music was edited to occur a few seconds after the last stimulus (the length of the music file was 2m41s).
For the Noise condition, pink noise with a wide-band cut at 3 kHz was used. Pink noise (or 1/f noise) has equal energy across each octave, that is, the intensity decreases as frequency increases. Due to the upward spread of masking (see, for example, Oxenham & Plack, 1998), pink noise is appropriate for use with speech. The 3 kHz cut was made because there is additional sensitivity to frequencies in the range of 2–5 kHz associated with the resonance of the auditory canal, the mean of which is about 2.8 kHz in adults (Pierson et al., 1994). As with the background music, the noise file plays continuously throughout the block with no silences between trials. The noise file was cut to the appropriate length for the experiment (2m31s), and given a fade-in at the start and a fade-out at the end, ensuring this fade-out began after the final response would be given.
The Noise condition only acts as a successful control if the noise is at least as psycho-acoustically loud as the music. Because the noise is spectrally and temporally dense, it interferes more with speech perception than does the music. It thus needs to be at a lower average amplitude to cause a similar degree of masking. The signal to noise ratios were calibrated by conducting pilot runs of a lexical decision task (see Experiment 2) and looking at the error rates in each condition. The aim was for the error rates in the Music condition to be no higher than the error rates in the Noise condition. It was decided through this process that the music should be 4 dB SPL louder than the noise. The resulting amplitudes were 74.4 dB SPL for the test stimuli, 70.2 dB SPL for the music, and 66.2 dB SPL for the noise. The signal-to-noise ratio in the music condition was thus 4.2 dB SPL and 8.2 dB SPL in the noise condition. 3
4.2.3 Participants
Thirty-six native speakers of NZE participated in the experiment once piloting was completed. They had all spent less than six years outside of NZ in their lives, and had no diagnosed hearing impairments. Eight of the participants self-identified as musicians. None of the recruitment materials mentioned that the experiment would involve music. All participants (including pilot participants) received a NZ$10 voucher. All experiment procedures were approved by the University of Canterbury Human Ethics Committee (application number HEC 2016/20/LR-PS).
4.2.4 Procedure
The two experiments were conducted in the same session as one another, with the same participants. The phoneme categorization task (this experiment) was always conducted first, followed by the lexical decision task (Experiment 2). After completing the experiments, participants filled out a survey which collected demographic information and asked questions about the participants’ music preferences and music-listening patterns.
Participants listened to the stimuli through headphones, while seated in a sound-treated booth at the University of Canterbury. A laptop running E-Prime version 3.0.3.60 (Psychology Software Tools, 2017) was situated in an adjacent room, and a monitor presenting instructions was placed in this room, facing the participant, through a window. On-screen instructions read: “you will hear a New Zealander singing/saying either the word bed or bad” (“saying” was used in the Silence and Noise conditions and “singing” in the Music condition). Participants signaled which word they had heard by pressing a button on an SRBox response box with the labels “bed” and “bad” attached next to the buttons. Although not used for the analysis itself, reaction times were recorded to allow for the removal of problematically fast or slow responses.
All participants classified 24 words in each of the three Conditions, in three blocks. The full experiment thus contains 72 trials per participant. Condition order was counterbalanced across participants by setting E-Prime’s Order parameter to “permutation.” This means that each of the six possible condition orders (Music, Silence, Noise; Silence, Noise, Music, etc.) were encountered by an equivalent number of participants. The position of the words on the response box was also counterbalanced (bed was on the left for half of participants and on the right for the other half).
Participants pressed a button to begin each subsequent block, which began with an on-screen instruction stating “in this next block, you will hear singing/speaking.” Note that there was no mention of “music” or “singing” in the information sheet, nor in the recruitment phase, so those who had the Silence or Noise condition first did not know that the experiment involved music until encountering the specific instructions for the Music condition.
At the beginning of each block, the background audio file was triggered (in Silence a placeholder silent file was used) after which a wait time elapsed. This wait time was longer for Music (12,120 ms), to allow for the four bar instrumental introduction, and shorter for Silence and Noise, where the interval between pressing the button (which triggered the start of the noise file) and the first stimulus was 3,000 ms. The inter-stimulus interval was fixed, at 6,000 ms, or two musical bars (eight beats), rather than being determined by the response, so that the stimuli in the Music condition would always fall on the first beat of the bar. The first stimulus in every block is the short version of continuum step 4 (4S). This allows for a between-participants analysis of responses to this first stimulus. This is then followed by the other 11 stimuli, in random order. Then, all 12 stimuli are played again, in random order. This way, identical stimuli are separated from each other to an acceptable degree.
4.3 Experiment 1: Analysis procedure
Experiment 1 was preregistered on aspredicted.org, allowing us to create a date-stamped specification of the hypothesis and data processing methods prior to the commencement of data collection (Simmons et al., 2011). 4 The preregistration provided a plan for data processing and statistical analysis. While some details were missing from the preregistered methods for statistical analysis (e.g., what kind of contrast coding to use for categorical variables), it provided a basic outline for the model-fitting procedure described below.
Experiments probing the boundaries between phonemic categories can be strongly affected by details of the experimental design. Contrast effects, for example, are well established: “a given vowel sound will appear more open when preceded by a sound closer than itself” (Fry et al., 1962, p. 180).
This type of experiment is likely to elicit such a contrast effect (see, for example, Zheng & Samuel, 2017). Hearing a very dress-like token may make a respondent more likely to report hearing trap on the next trial of the experiment, and vice versa. This potential local contrast effect is controlled for in the analysis.
Initial model fitting followed a preregistered procedure, described in Gibson (2020, p. 129); however, the resulting model was deemed to be overfit, including many interactions upon listener demographics with some very sparse cells. It was decided that the main prediction should be tested without recourse to social factors relating to listeners because no such factors were controlled for when recruiting. Modeling thus proceeded by testing only the following factors, for which there was a clear a priori prediction:
Condition—Condition is a three-level factor (Music, Noise, Silence). Manual contrast coding was defined to test two key contrasts: the first tests the difference between the Music condition and the mean of the non-music conditions. The second tests the contrast between Silence and Noise. The core hypothesis is that participants will be more likely to respond bad in the non-music conditions as compared with the Music condition. The comparison of the Noise condition to the Silence condition is of lesser importance, but determines whether responses to these non-music conditions are significantly different from one another.
Trial is a numeric variable running from 1 to 24, representing the trial number within a given block. While Trial is not expected to be significant on its own, it is tested in interaction with Condition. The difference between the Music and non-music conditions is expected to be greater at the start of each block, and to diminish on later trials.
Continuum step of the stimulus (StimStep)—A numeric variable from 1 to 6, where 1 represents the most bed-like tokens and 6 represents the most bad-like tokens.
Continuum step of the preceding stimulus (PrevStimStep)—A numeric variable similar to StimStep. For the first item in each block, this variable is set to 4. A contrast effect is predicted, such that a preceding bed-like token will increase the likelihood of responding bad on the present token, and a preceding bad-like token will do the opposite.
Length of the stimulus (StimLength)—A binary categorical variable, dummy coded to have short stimuli as the reference level. Long stimuli are predicted to be heard as bad more often than short stimuli.
Mixed effects models were fit by hand using the lme4 (Bates et al., 2014) library in R. The model-fitting procedure is as follows. We start by including all of the above predictors as fixed effects, together with the interaction between Condition and Trial number. A random intercept is included for Participant. Non-significant predictors are removed by hand, using ANOVA comparison between minimally different models. Once all remaining predictors are significant, maximal random slopes for these predictors are tested, and retained if they do not cause convergence issues. For models failing to converge, the random slope explaining the least amount of variance is removed, and the model refitted, until a converging model is achieved. Any fixed effect which becomes non-significant on the addition of a random slope is removed at this point. Finally, we test the variance inflation factor on the final model, to confirm that there is no problematic collinearity.
Note that a manual contrast coding scheme was used for the Condition variable, to test the key hypothesis. First, the Music condition was contrasted with the mean of the Silence and Noise conditions, and a second contrast compared Noise and Silence to one another. Post hoc testing fit the same model with a treatment coded version of Condition that had Music as the reference level, to test the differences between Music and Noise, and Music and Silence in their own right.
4.4 Experiment 1: Results
The full dataset included a total of 2,592 responses (72 trials for each of 36 participants). Across all data, there were 1,207 bad responses (46.6%) and 1,385 bed responses (53.4%).
4.4.1 Analysis of first trial of experiment
Part of the preregistered analysis of results was a simple between-participants comparison of the very first token of the whole experiment, which was always stimulus 4S (continuum step 4, short). This is a highly ambiguous token with an F1 value that corresponds to trap for NZE but dress for PSE.
The preregistration called for a Fisher’s exact test of this first trial. Across the 36 participants, 12 had the Music condition first, 13 had Noise, and 11 had Silence. 5 Note that two of these 36 trials are removed from the analysis of the full dataset below, due to having a long reaction time. For this simple analysis of a single trial for each participant, these tokens were included.
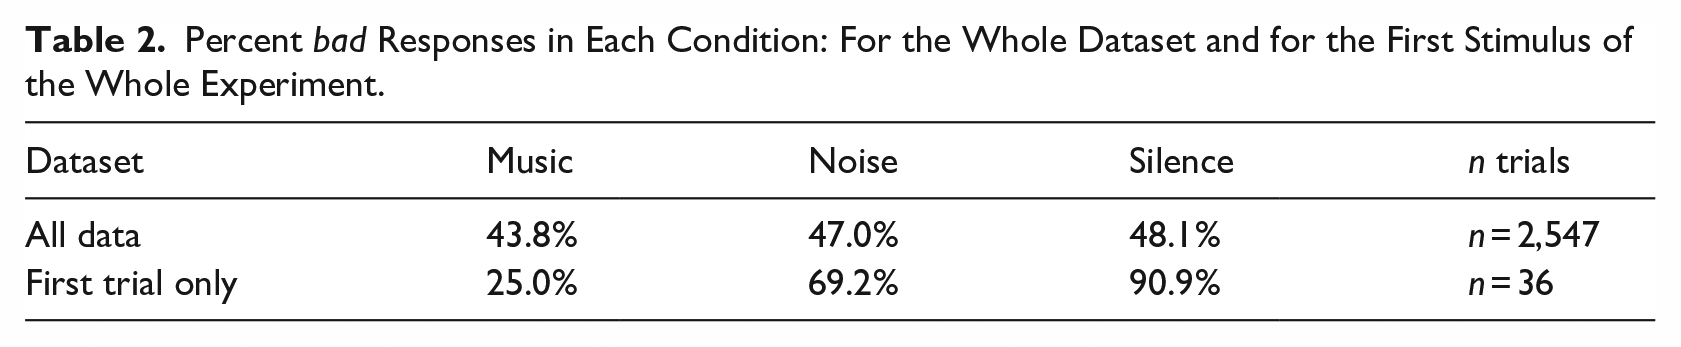
Of the 12 who had Music first, three responded that they heard bad (25%). Nine out of the 13 who had Noise first heard bad (69%), and 10 of 11 who had Silence first heard bad (91%). Fisher’s exact tests were performed on each 2×2 table of Condition by Response. The differences between the Music condition and each of the non-music conditions were significant (p = .003 for Music vs. Silence; p = .047 for Music vs. Noise), while the difference between Noise and Silence was not (p = .33).
4.4.2 Outlier removal
For the analysis of the full dataset, the preregistered outlier removal procedure was conducted (see the link in Note 4). No participants were excluded for having unusually high or low rates of perceiving bad, or for having unusually fast or slow mean reaction times. Individual trials where the reaction time was less than 3 standard deviations below or greater than 3 standard deviations above the given participant mean were excluded. This resulted in the removal of 44 tokens which had long RTs and one token with a short RT (outlier removal rate of 1.7%). The number of trials included in all data analyses which follow is thus 2,547.
4.4.3 Summary of raw results
Once outliers were removed, 46.3% of remaining responses were bad. This rate varied by condition, in the predicted direction, with 43.8% bad in Music, 47.0% in Noise, and 48.1% in Silence. Figure 2 shows the raw percentage of bad responses in each condition, for each of the six vowel qualities. The crossover point, where each line passes through 50%, provides a quick gauge of the relative positions of the perceptual boundary between the phonemes for each condition. As predicted, this crossover point is further to the right in the Music condition than the non-music conditions, reflecting a boundary between dress and trap that corresponds to a more phonetically open position in the context of music.
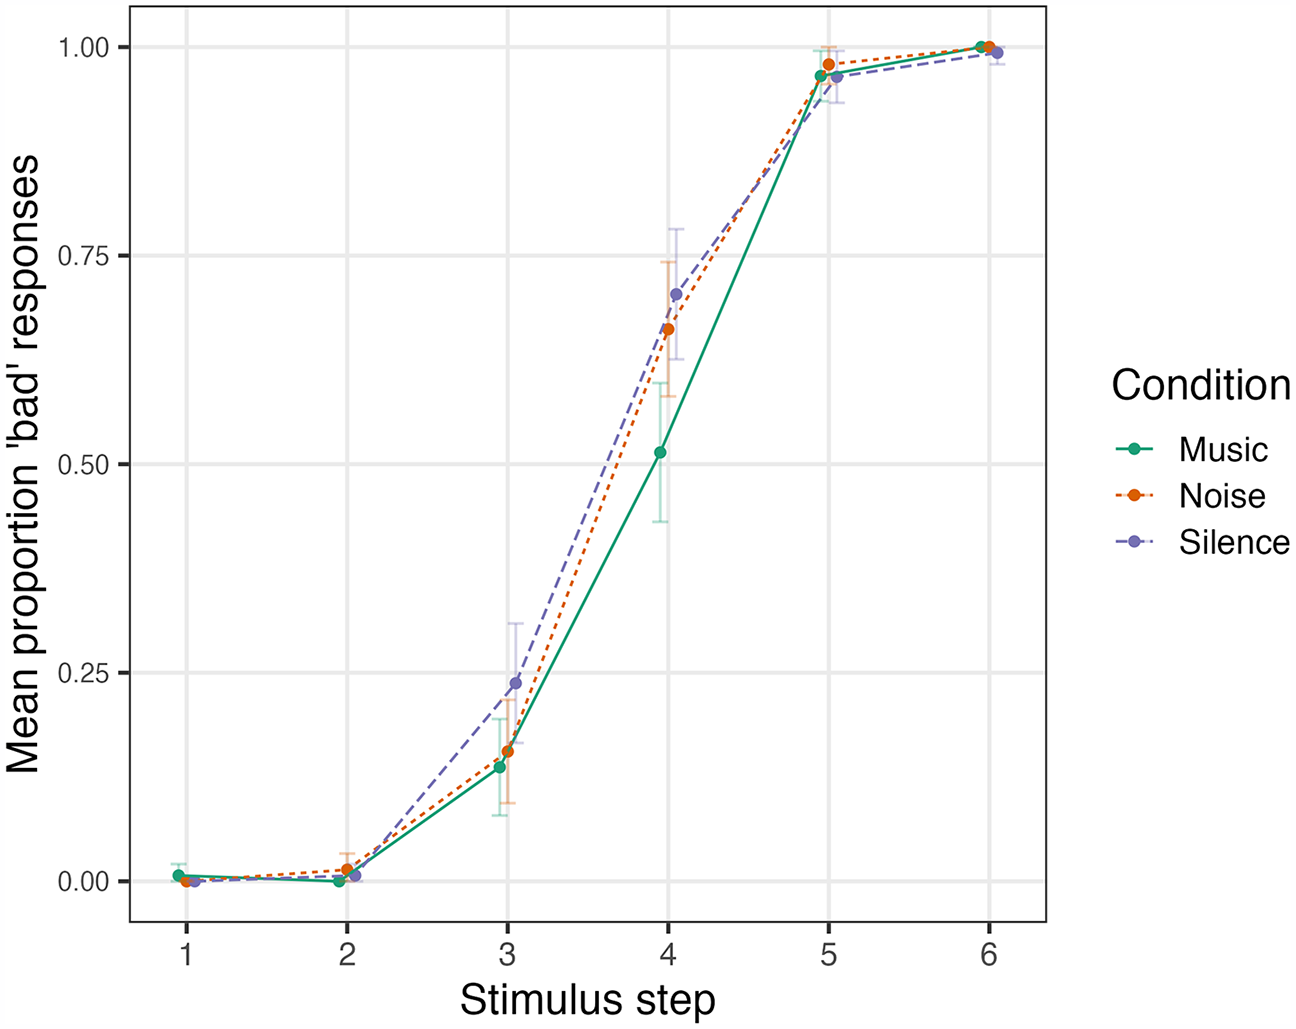
Experiment 1: proportion of bad responses to each of the six vowel qualities in the continuum (with bed-like tokens to the left), across the three conditions.
Steps 1, 2, 5, and 6 were unambiguous, with over 97% agreement between responses to stimuli with these more extreme vowel qualities. Step 3 was somewhat ambiguous, being heard as bad 17.7% of the time, while Step 4 was the most ambiguous (62.5% bad). It is on these ambiguous stimuli, Steps 3 and 4, where the difference between conditions thus plays out. The Music condition (solid green line in Figure 2) attracted the lowest percentage of bad responses (and the right-most crossover point), the Noise condition (dotted red line) somewhat more, while the Silence condition (dashed blue line) had the most bad responses.
Table 2 summarizes the raw results across the full dataset, as well as for the first trial of the experiment.
Percent bad Responses in Each Condition: For the Whole Dataset and for the First Stimulus of the Whole Experiment.
4.4.4 Discussion of raw data analyses
The results presented thus far are in line with the hypothesis that participants’ reference frame for vowel categorization will shift to accommodate a musical context. Specifically, the phoneme boundary between the dress and trap vowels is at a more open position (i.e., at a higher value of F1) when they are expecting to hear singing rather than speech.
This can be seen in the raw data and is particularly evident in the between-participants comparison of the very first token of the experiment. While this first-trial analysis is extremely simple, it is also very well controlled. The 4S stimulus token is ambiguous—it could be a good example of either a spoken NZE trap vowel, or a sung dress vowel—and context is used by participants to resolve that ambiguity. In the absence of any knowledge about, or experience with, the speaker, at the beginning of the experiment, the contextual information recruited is at a more global level than once the participant becomes familiar with the speaker, and the range of variability involved in the stimuli becomes apparent.
The strong effect on the first stimulus of the experiment, as compared with the mean responses over the experiment as a whole, suggests that participants quickly update their frame of reference based on the incoming stimuli. As they progress through the experiment, their expectations may change as they become more familiar with the range of variation in the stimuli. The broader context of Condition would then have less of an effect. As is revealed in the statistical model below, there is indeed a significant interaction of Condition with Trial, such that the effect of Condition lessens as each block of the experiment progresses.
4.4.5 Statistical model
A binomial generalized linear mixed effects model was fit using lme4, predicting the log-odds of participants responding bad to a given stimulus. The key experimental manipulation (Condition) was whether the stimulus appeared with background Music, background Noise, or in Silence. Condition was tested in interaction with Trial to see whether participants are less affected by Condition as the experiment goes on, as participants become familiar with the range of variation in the stimuli. The model included a random slope for Condition on Participant. Attempts were made to fit the model with other random slopes, beginning with a maximal structure and then removing slopes explaining the least variance, until a converging model was found. A variance inflation factor test was carried out on the model to check for any problematic multi-collinearity between predictors. The maximum VIF in the final model was 3.1, which suggests that the predictors are contributing independently to the model fit to an acceptable degree. The model output is shown in Table 3.
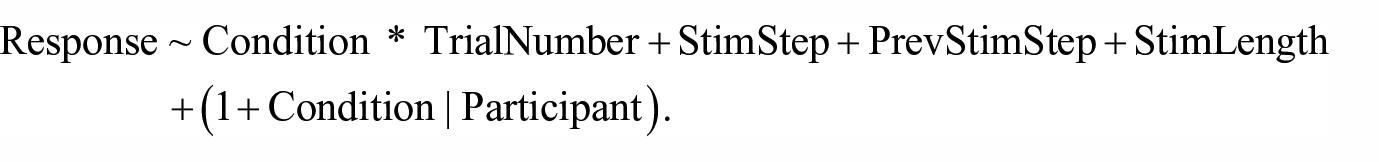
Experiment 1: Output of Binomial Linear Mixed Effects Model Predicting the Log-Odds of Responding bad.
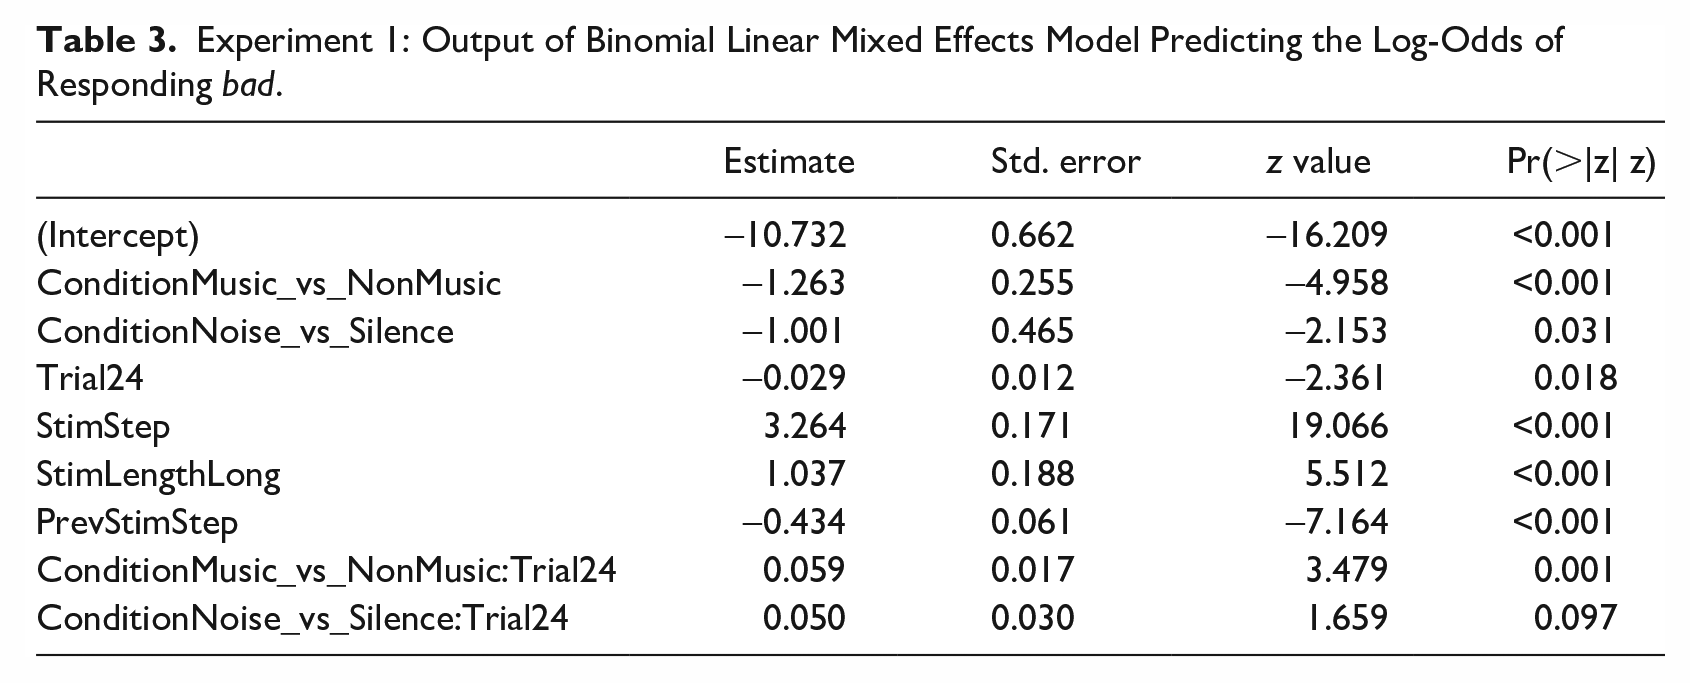
The results for each of the terms in the model are described below:
Condition * Trial—The central hypothesis of the experiment was supported: participants respond bad more often in the non-music conditions than in the Music condition. The effect of Condition interacts with the trial number within a given block. This interaction reveals that the hypothesis (more bad responses in Silence/Noise than Music) is strongly supported early on in each block (Trial 1), but the difference decreases by the end of each block (Trial 24). 6
Continuum step of the stimulus (StimStep)—More bad-like stimuli are more likely to be heard as bad.
Continuum step of the preceding stimulus (PrevStimStep)—The quality of the preceding token significantly predicts responses for a given trial, with participants biased to contrast the present stimulus with its predecessor. If the preceding token was bed-like, for example, they are more likely to respond bad.
Length of the stimulus (StimLength)—Long stimuli are more likely to be heard as bad than short stimuli.
Figure 3 shows the interaction of Condition by Trial described above. The model predictions for responding bad are plotted according to trial number for each of the three conditions. The hypothesis was supported early on in each block, with the non-music conditions more likely to elicit bad responses. By the end of each block, however, the effect of Condition becomes negligible.
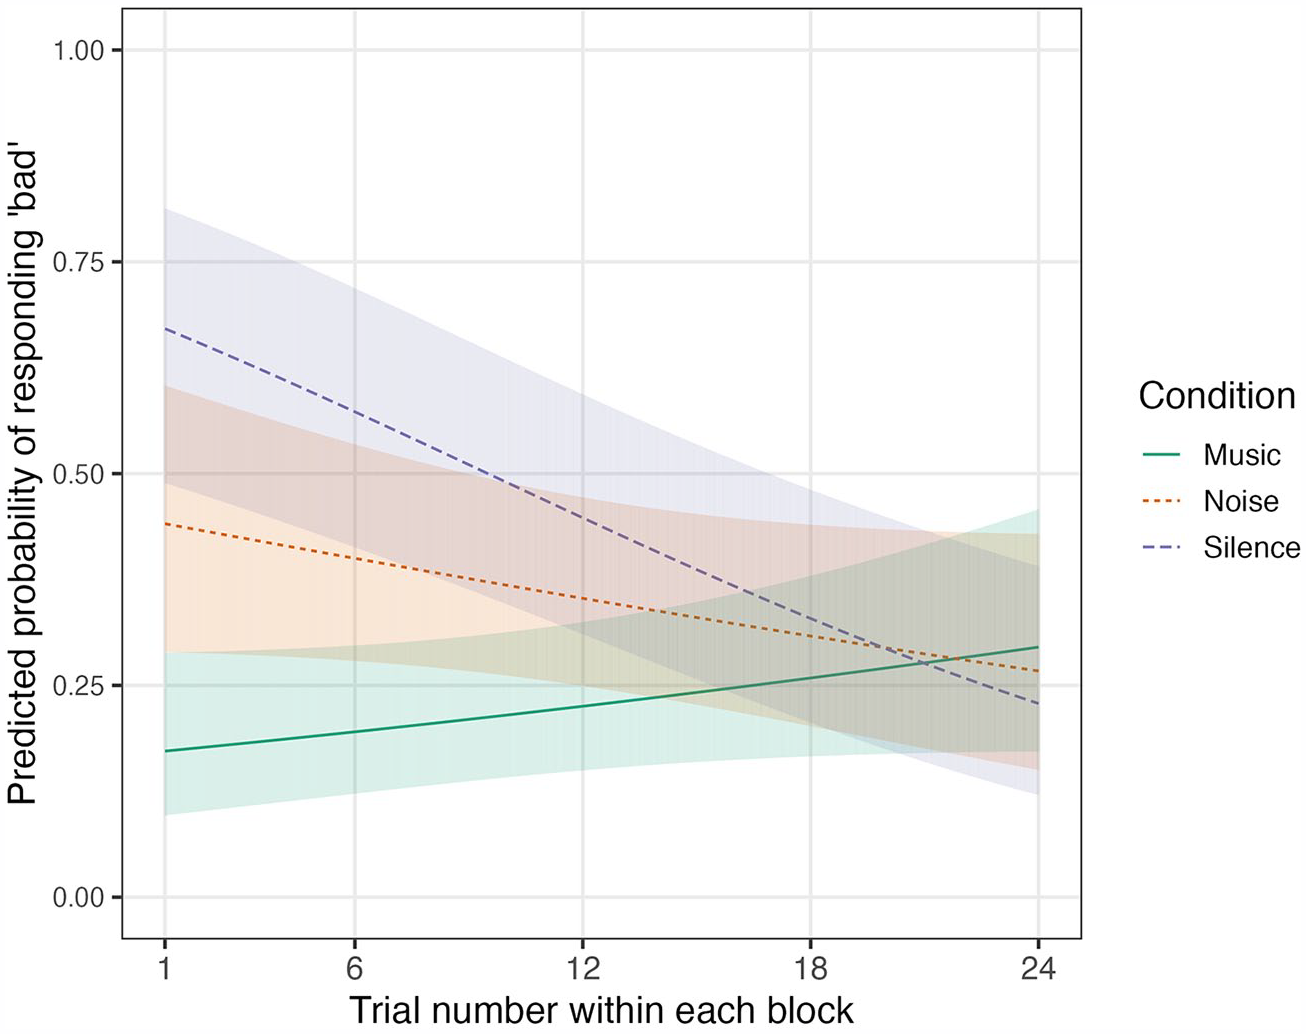
Experiment 1: predicted probability of responding bad in each of the conditions by trial number, showing the standard error around the model fit.
4.5 Interim summary
Our analysis shows that participants can hear the same auditory stimulus as bed in singing, and bad in speech, depending on context. This suggests that, just as New Zealand singers shift from NZE to PSE when they sing, so NZ listeners also undergo a perceptual style-shift to PSE when they expect to hear singing.
The effect is strong at the start of each block, but diminishes as the participant becomes more familiar with each new combination of voice and context. This kind of habituation effect has been attested in other studies that involve surprisal (Nieuwland & Van Berkum, 2006; van den Brink et al., 2012). The Music condition may seem quite surprising to the participants at first, given the lack of prior warning that the experiment had anything to do with music.
The results were mixed with respect to the effect of background noise on phoneme categorization. Values in the Noise condition were in between those for Music and Silence. This result is consistent with Hay et al.’s (2017) finding that listeners expect more open vowels in a typically noisy environment, in expectation of Lombard speech. While this is an interesting finding in its own right, it does not detract from the main finding that expectations based on learned associations between music and accent affect vowel categorization, and their impact goes beyond any effect of noise. When encountering singing, NZ listeners expect more open dress and trap vowels.
A range of other factors were significant in the statistical model. Foremost among these is the obvious role of the vowel quality of the stimulus itself (more bad responses to more bad-like stimuli), but also the quality of the preceding stimulus. This contrast effect found listeners compare and contrast an incoming signal to the previous stimulus they heard. If the previous stimulus was more bed-like, the present response will be biased toward bad, even if the present token is only slightly more phonetically open. This effect has not always been tested in the statistical models of previous studies of this kind, and should be considered when this method is employed in future. The length of a stimulus also significantly affected phoneme categorization. Despite identical formant frequencies, participants are more likely to categorize longer stimuli as having trap vowels, reflecting the fact that trap is longer than dress in NZE.
This is a very focused experiment, with limited ecological validity. It overtly orients participants to a particular vowel contrast, using synthesized stimuli. In Experiment 2, we turn to a task that uses natural speech, and a range of variables that differ between NZE and PSE/AmE.
5 Experiment 2: Lexical decision task
We now turn to the second experiment completed by the participants: an auditory lexical decision task that explores listeners’ expectations about accent in singing versus speech. The focus in this experiment is on word recognition rather than phoneme categorization.
The lexical decision task is one of the most widely used methods in psycholinguistics, the term having been initially coined by Meyer and Schvaneveldt (1971). It presents participants with words and nonwords and requires them to judge which is which. Early examples of the lexical decision task were generally conducted with visual stimuli. Goldinger (1996a) reviews the later development of the auditory lexical decision task, and presents various methodological insights that guide both the methods and analysis of the present experiment. Of particular relevance to this study among early auditory lexical decision tasks are those which deal with lexical representation issues (Luce & Lyons, 1998; Luce & Pisoni, 1998) and those which address the integration of music and language (Hoch et al., 2011; Poulin-Charronnat et al., 2005). The lexical decision task is often paired with a priming methodology, which usually consists of one prime preceding each target trial. There have been several studies of cross-dialect and cross-language effects using this method (for a review, see Clopper & Walker, 2017). In the present experiment, we refer to priming in a broader sense, where an ongoing ambient prime is predicted to shift listener expectations. This ambient prime approach has been used, for example, in Hurring et al. (2022).
The lexical decision task has proven a useful tool in recent examinations of the role of congruence in speech processing. As discussed above, there is an accumulating body of evidence that lexical access is facilitated by various types of congruity. Walker and Hay (2011) found evidence that listeners have access to knowledge about how words have been distributed across social groups. In a lexical decision task, they found faster and more accurate responses to words where the word-age and the voice-age were congruent, for example, the word shilling was responded to more quickly and accurately when heard in an older voice while sexist was accessed more easily in a young voice. Related results have been reported by Kim (2016), Kim and Drager (2017), and Hay et al. (2019).
The present experiment manipulates speaker dialect (using a NZ and a US voice), and background audio context (Music, Noise and Silence). We expect the relative congruence of a US voice with a pop music context to speed lexical access, as opposed to the relative incongruence of NZE features in a pop music context. Rather than a continuum of stimuli differing on just the F1/F2 dimensions, the stimuli used in this task employ a wide range of sociophonetic variants occurring in the US or NZ voice that produces the target word.
It is expected that when listening to NZ and US voices in noise or silence, the NZ voice will be easier to process than the US voice overall, as the participants are New Zealanders and familiar dialects are processed more quickly than unfamiliar ones (Clopper et al., 2010). The central hypothesis of this experiment is that in the Music condition, responses to the US voice will be facilitated, and responses to the NZ voice inhibited. Clopper et al. (2010) found processing is not only faster and more accurate to familiar dialects, but also to standard dialects. This study thus explores the effect of relative standardness according to context. In NZ, PSE represents something like a standard dialect in the context of song, while NZE is the standard in non-musical contexts. Similarly, degree of familiarity may be modulated by context. New Zealanders are not familiar with NZE in the context of a song, even though it is their native dialect in non-musical contexts.
5.1 Experiment 2: Methods
Participants completed a lexical decision task, responding to 300 stimuli across six conditions that cross two voices (NZ and US) with three contexts (Music, Noise, and Silence). Half of the stimuli were real words, chosen for having a sizable phonetic distinction between the two dialects, specifically, words containing a non-prevocalic /r/ in AmE, and words in the bath, goat, and lot lexical sets. The other half are nonwords that differ from the real words by one or two phonemes. Details about the stimuli, voices, and contexts are given below.
5.1.1 Stimuli
We selected 150 two syllable words, all of which included at least one variable that has been reported to differ between typical singing accents and NZE (Gibson, 2020, 2024). Three of the four variables (bath, lot and rhoticity) belong to the “USA-5,” the set of variables often studied as examples of salient “Americanisms” adopted by non-US singers (Simpson, 1999; Trudgill, 1983). The fourth variable goat has been noted in studies of New Zealand popular music as an important difference between AmE and NZE (Gibson & Bell, 2012). The 150 matched nonwords were derived from those words by changing/adding one or two phonemes. The pairs comprised 31 word/nonword pairs for each of three non-rhotic variables, where there are vowel quality differences between dialects: bath/dance, goat, and lot; and a further 57 word/nonword pairs where there are differences in both vowel quality and rhoticity, specifically comprising start (21 pairs), north (19 pairs) and nurse (17 pairs). A longer list of words was initially recorded, from which we selected the best recordings with consistent pronunciation across speakers. Words were removed in cases where the pronunciation was unclear or ambiguous, or the recorded pitch was deemed overly unstable. The reason for a larger number of stimuli involving rhoticity is that this variable is distributed across multiple lexical sets.
To produce the stimulus recordings, two male speakers in their forties were recorded reading the lists of stimuli. One was born and raised in New Zealand and the other was originally from Illinois, USA, and had lived in New Zealand for almost three years at the time of recording. Recordings were made in a quiet room at the NZ Institute of Language, Brain and Behaviour using a headmounted Beyer condenser microphone. Audio was recorded in 16 bit, with a sample rate of 44.1 kHz, into Logic Pro X on a Mac Book Pro, through a USBPre 2 interface.
After being given a general description of the experiment design, the speakers listened to a sample of the music track. This was to give them a sense of the tempo and tonality of the piece so that the two syllables of each word would occur on two consecutive eighth notes when occurring in the Music condition. The first speaker to be recorded (the American) chose a stable pitch on which to say the words. This pitch was C#3 (which should equate to about 138.6 Hz), which felt comfortable for the speaker, and was musically coherent, being the root of the C#m chord, which occurred regularly throughout the music. The speakers were recorded in separate sessions and asked to read through the words in a monotone on the target pitch, with no intonation contour in either direction between syllables. They were encouraged to listen to the music at multiple points during the recording to reinforce the target rhythm and target pitch. Both speakers were encouraged to use their “normal” spoken accent.
The resulting waveforms were scaled in Praat to normalize the root mean square amplitude to 0.105 Pascal (74.4 dB SPL). The mean pitch of all stimuli was also adjusted to match the musical target. This was a slightly more involved process. The mean F0 was calculated for each of the 600 individual soundfiles for words and nonwords. There was a difference by speaker, with the average pitch being 137.6 Hz for the American voice and 134.5 Hz for the NZ voice. This was deemed problematic because it meant that the US voice would be more “in tune” with the music than the NZ voice. If this were the case, and the hypothesized effect were found, that effect could be due to either dialect itself or due to a more contextually congruent pitch. In musical terms, the average pitch of the NZ and US voices were, respectively, 68 and 20 cents (hundredths of a semitone) below the intended pitch of C#3. To minimize manipulating the pitch of the stimuli, it was decided that the music track itself should be tuned down by 41 cents so that it would be midway between the US and NZ average pitches. The pitch of all stimuli was adjusted to match the target (41 cents below C#3). For each file, the boundary between the syllables was manually located and then a Praat script was used to create a pitch contour for each syllable and to extract the mean pitch in semitones. The difference between that mean and the target (84.965 semitones re 1 Hz) was taken. The “change semitones” plugin from the Praat Vocal Toolkit was then used (https://www.praatvocaltoolkit.com/change-semitones.html) to apply the difference to each syllable. In this way, the two voices were matched in terms of the F0 of the stimuli, the two syllables in each word were matched for pitch, and both voices received the same degree of manipulation. The resulting stimuli sounded natural, and were feasible within both the musical and non-musical contexts.
5.1.2 Music and noise conditions
The test stimuli are presented in three conditions which vary according to background audio: Silence (no background audio), Music, and Noise. In the conditions with Music and Noise, a single audio file is played continuously, with the test stimuli overlaid, at an inter-stimulus interval of 3,780 ms, which corresponds to two musical bars at the tempo of the music track. The background noise is the same as that used in Experiment 1. The music is a modified version of “Science Music.” 7 The piece is in an electronic pop style with a 4/4 time signature. It was originally in the key of E major with a tempo of 130 bpm in its original form. For this experiment, it was pitch-shifted down by 41 cents (nearly half a semitone) in Logic Pro X, with its native “Pitch Shifter” plugin. To retain audio quality, pitch and tempo need to be coupled in manipulation, so this led to a new tempo of 127 bpm. As described in the previous section, the music target pitch was chosen to be exactly midway between the mean pitch of the recorded stimulus voices, and then the voices were manipulated to match the music pitch.
As described in section 4.2.2, we piloted different versions of the noise and music in an early version of the lexical decision task, to find amplitude settings that would result in an error rate at least as high in the Noise condition as in the Music condition. The idea behind this is that the Noise condition is only a successful control if the noise is at least as psycho-acoustically loud as the music. As the noise has stronger masking properties than the music, it can have a lower amplitude than the music and still achieve this. The task in Experiment 2 is more difficult than the task in Experiment 1, so both background audio files were quieter than they were in Experiment 1, but the ratio between the noise and music stayed the same. The average amplitude of the noise file was .0285 Pa (63 db SPL), while the music file had a root mean square amplitude of 0.045 Pa (67 dB SPL, 4 dB louder than the noise). The word and nonword stimuli had the same amplitude as the bed and bad stimuli had in Experiment 1 (0.105 Pa, 74.4 dB SPL). 8
5.1.3 Participants and procedure
The 36 participants began the lexical decision task after having completed Experiment 1. Participants were told they would hear an American or a New Zealander speaking/singing, and after they pressed a button to begin the experiment, rather than going directly to the start of the experiment, one further screen was displayed, which included either the word “SINGING” or “SPEAKING,” above one of the images shown in Figure 4. Multiple cues were thus given to prime the idea that the voices would be singing in the Music condition: first, the instruction that “you will hear singing”; then an image of a stick figure wearing headphones and holding a microphone; then the music itself; and finally, the fact that the voices are in tune and in time with the music and have a stable pitch.
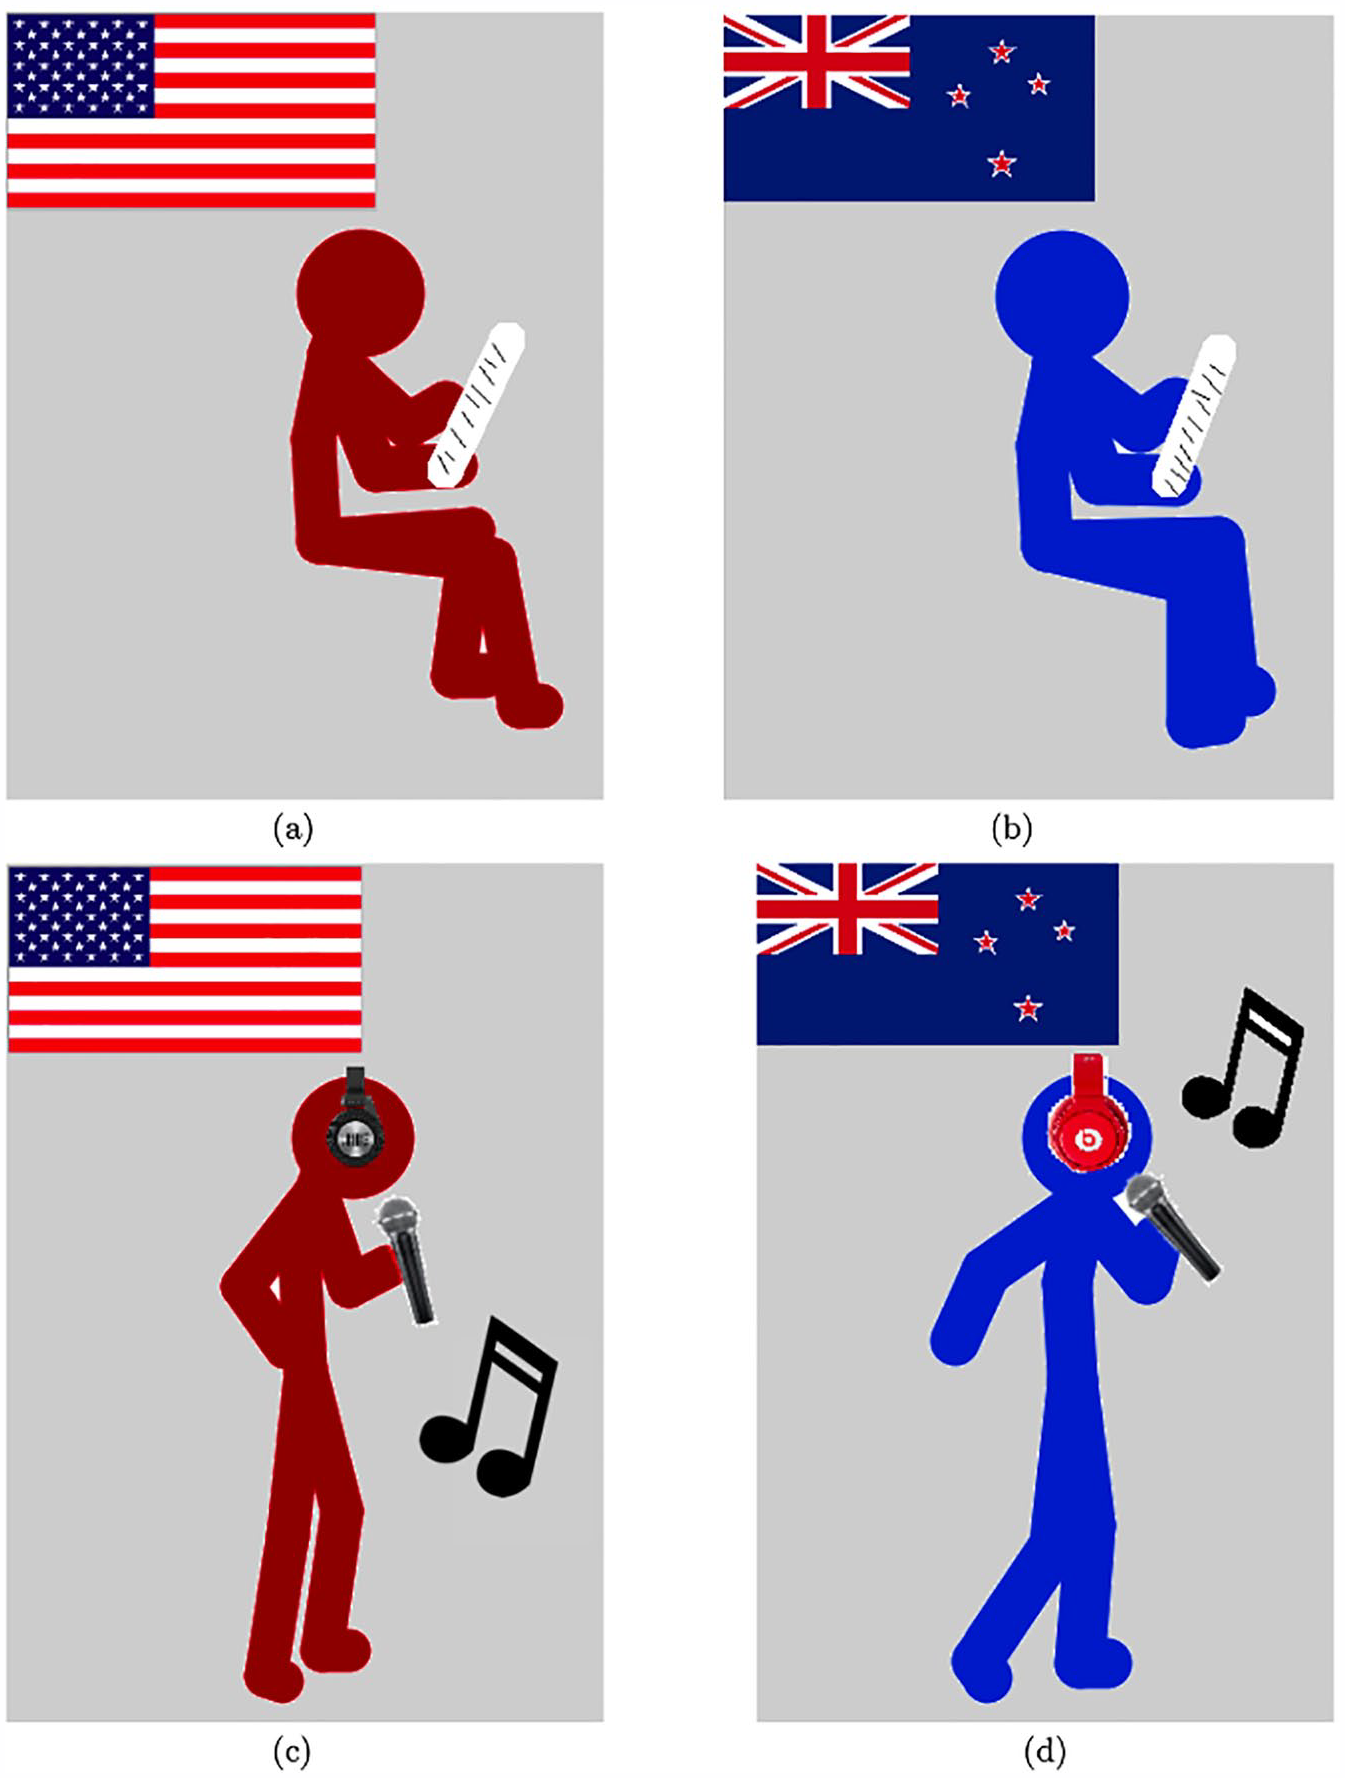
Images shown at the start of each block of the lexical decision task, with either the word “SPEECH” (images a and b) or “SINGING” (images c and d) shown above them in large font: (a) “An American speaking,” (b) “A New Zealander speaking,” (c) “An American singing,” and (d) “A New Zealander singing.”
All participants completed six blocks, encompassing the three conditions in each of the two voices. Order of conditions was counterbalanced so that half of the participants heard all three blocks of the NZ voice then all three blocks of the US voice, while that order was reversed for the remaining participants. The order of the three conditions was the same within each voice for a given participant, but the six possible permutations of that order were counterbalanced across participants. Responses and their reaction times were collected using the SRBox. The right-most button was always used for “word” responses and the left-most button for “nonword” responses.
The E-Prime (version 3.0.3.60) experiment used nested tables to fully counterbalance the presentation of stimuli across conditions, randomly assigning the NZ and US voice to half of the stimuli every time the experiment is run. In this way, each participant hears half of the stimuli in each voice, and the assignment of voices to stimuli is different for everyone. In each block, half of the stimuli are words and half are nonwords.
5.2 Experiment 2: Analysis procedure
As with the first experiment, Experiment 2 was preregistered on http://aspredicted.org prior to the commencement of data collection (Simmons et al., 2011). 9 The analysis presented here differs from the preregistration in some ways—most notably in not modeling a variety of social predictors. The preregistered model is reported in Gibson (2020). It is more complex than the model reported here and was not fully supported by the data distribution, however that model also shows the hypothesized effect.
We analyze responses to the real word trials. Dependent variables in our models are a binary coding for Accuracy (in a model of accuracy), and a logged, centered and scaled reaction time (RT) measure (in models of reaction time, referred to as RT.lcs). The reaction time analysis focuses on correct responses only.
The tested factors were as follows:
Condition—As with Experiment 1, Condition is a three-level factor (Music, Noise, Silence). Manual contrast coding is defined to test two key contrasts: the first tests the difference between the Music condition and the mean of the non-music conditions. The second tests the contrast between Silence and Noise.
Voice—A binary variable indicating the speaker (US or NZ).
Trial—A numeric variable running from 1–50, representing the trial number within a given block, centered and scaled.
Previous RT (PrevRT)—For the RT analysis, the RT of the previous stimulus (logged, scaled, and centered) is included as a numeric predictor. For the first trial in each block (where there is no relevant previous RT), the mean RT across the entire experiment (994 ms) was used.
We follow the same model-fitting procedure as described in section 4.3, fitting models by hand using the lme4 library. For the model of accuracy, we fit a binomial mixed effects regression model, starting from a model containing the three way interaction of Condition, Voice, and Trial, and random intercepts for Participant and Word. The model of reaction time is a linear mixed effects regression model with the same structure, hand fit following the same procedure, and also including the control of previous RT as a fixed effect.
5.3 Experiment 2: Results
The full dataset of responses included a total of 10,800 responses, comprised of 300 trials for each of 36 participants. Outliers were removed following a preregistered method, prior to the removal of nonword trials. No participants were removed from the analysis on the grounds of having an accuracy rate greater than three standard deviations above or below the mean of by-participant mean accuracy rates. Fifty-five trials were removed for having a reaction time (RT) of less than 400 ms and 174 trials were removed for having an RT greater than three standard deviations above the by-participant mean (outlier removal rate of 2.1%). Nonword trials were subsequently removed from the dataset, leaving a total of 5308 trials for analysis.
5.3.1 Analysis of accuracy rates
The overall accuracy rate was 89.6%. It was lowest on average in the Noise condition (86.8%), and higher in the Music condition (90.7%) and in Silence (91.3%). Accuracy was slightly higher on average for the New Zealand voice (90.2%) than the US voice (89.0%).
To test the hypothesis that participants would have a facilitation in accuracy when hearing a US voice in Music as compared with non-musical conditions, a binomial generalized linear mixed effects model was fit, as outlined in section 5.2. The addition of slopes led to non-convergence of the model and were thus not included. The maximum variance inflation factor was 2.1, confirming that there are no issues of multi-collinearity in the model. Table 4 shows the output of this model, which had the following structure:

Experiment 2: Output of Binomial Generalized Linear Mixed Effects Model Predicting the Accuracy of Responses to Real Words.
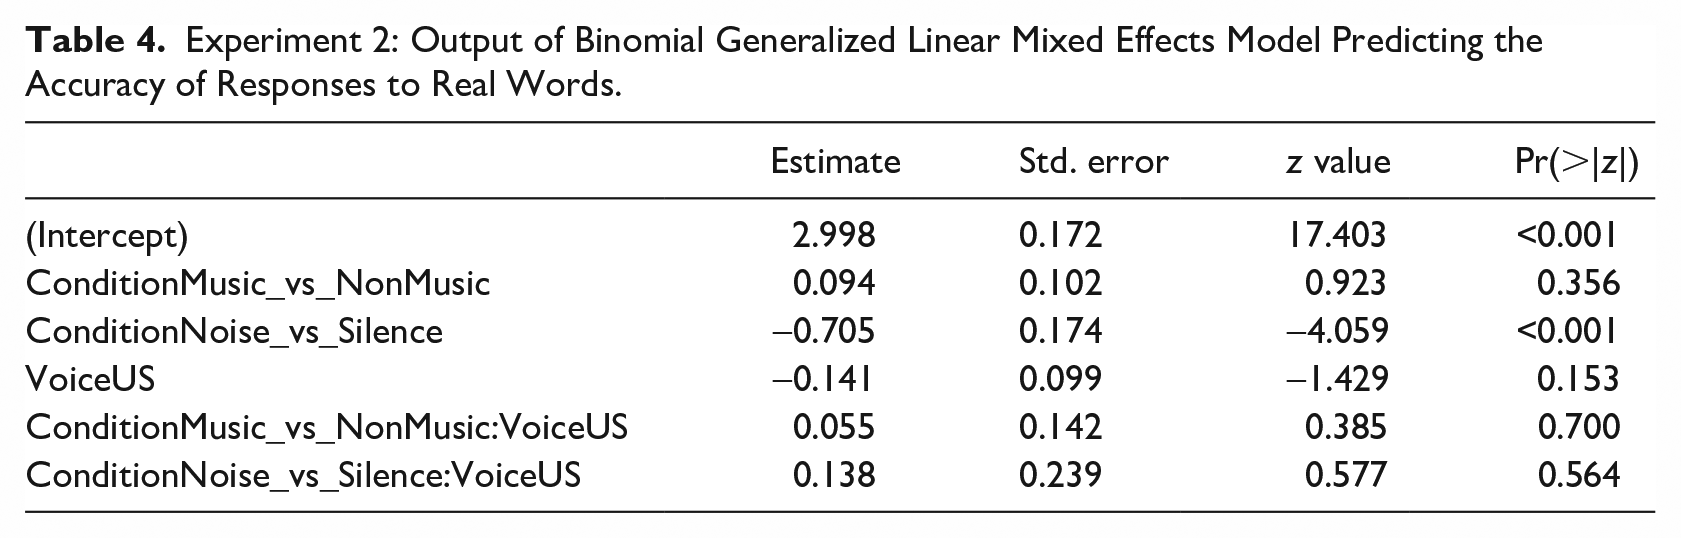
There is no interaction of Voice with Condition and thus no support for the hypothesis that listeners’ accuracy to the US voice would be facilitated in the Music condition. The only significant effect is a worsening of accuracy in Noise as compared with Silence, as would be expected due to masking.
The absence of a significant perceptual style-shifting effect in accuracy may be due to the high overall accuracy rate (90%). This echoes related work, such as Hay et al. (2019), which examined lexical access to socially skewed words under different priming conditions. Across four experiments, Hay et al. found that lexical access to words over-represented in male or female speech was facilitated by congruent social cues, be they gendered faces, the labels “male” and “female,” or unlabelled pictures of gendered pairs of objects such as a briefcase and a purse. There were significant reaction time effects in all tasks, while the hypotheses were not consistently supported by the accuracy data, perhaps due to ceiling effects. This would also explain our difficulties with obtaining convergent models with participant slopes. In the next section, then, we turn to the analysis of the reaction time data.
5.3.2 Analysis of reaction times
The mean reaction time across all 10,571 stimuli (after removal of the 229 outliers) was 1,042 ms. This was longer for nonwords (1,089 ms, n = 5,263) than words (996 ms, n = 5,308), and longer for incorrect responses (1,154 ms, n = 1,058) than correct responses (1,030 ms, n = 9,513). The analysis of RT looks only at correct responses to words, thus 1,058 trials with incorrect responses were removed, and 4,757 nonword trials were removed. The analysis below is based on the remaining 4756 responses.
Looking only at these correct responses to words, the mean reaction time was 981 ms. This was longest in the Noise condition (1,010 ms), and similar in Music (967 ms) and Silence (968 ms). Responses were faster on average to the NZ voice (973 ms) than the US voice (989 ms).
To test the hypothesis that participants would show relative facilitation to processing of the US voice in the Music as compared with the non-music conditions, we fit a linear mixed effects regression model, as described in section 5.2. Significant fixed effects were determined through backward model selection, using log-likelihood comparison of minimally different models. All fixed effects tested were significant, with the exception of Trial, which was removed. A maximal random slope structure was then added. When faced with non-convergence, the random slope explaining the least variance was removed and the model refit, until a converging model was found.
The final model retains a slope for previous reaction time (logged, centered, and scaled) on the Participant intercept, and a slope for Voice on the Word intercept. Table 5 reports the fixed effects for this final model, which had the following structure:

Experiment 2: Output of Linear Mixed Effects Model Predicting the Reaction Time (Logged, Centered, and Scaled) of Correct Responses to Real Words.
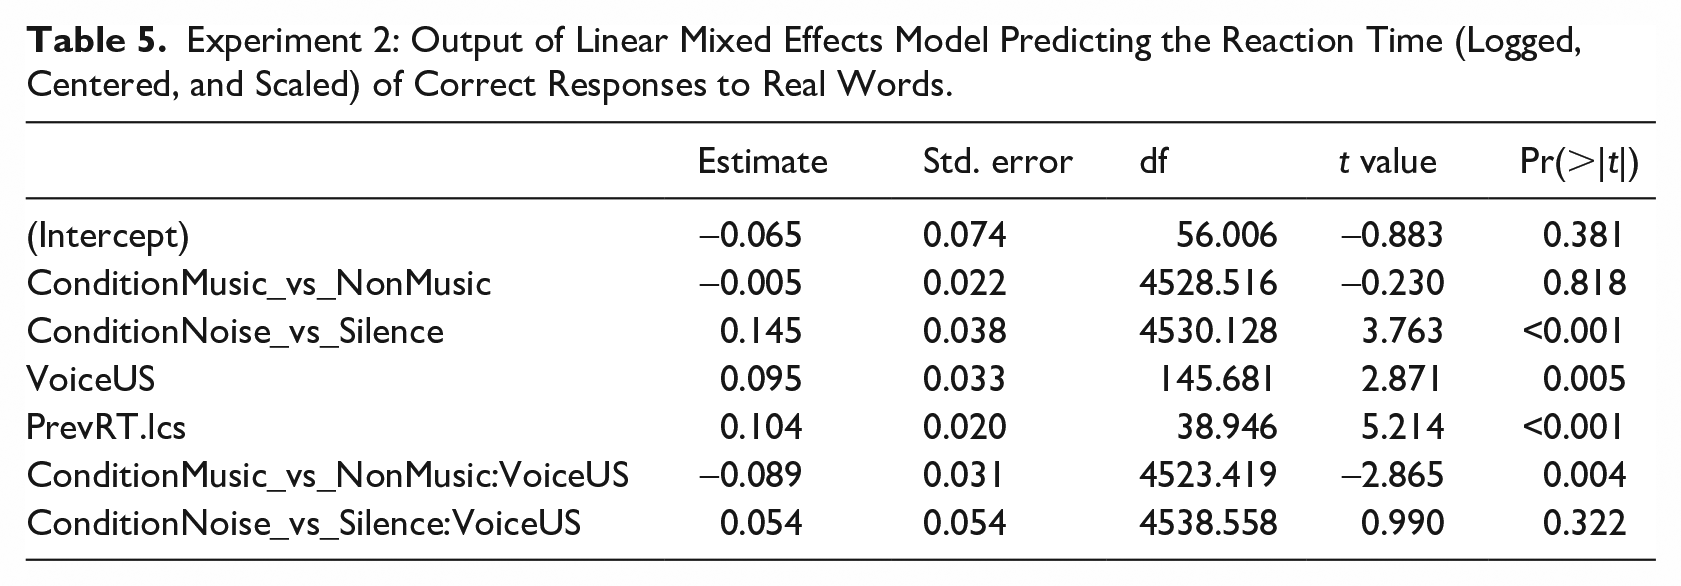
All variance inflation factors for the model were less than 2, confirming that there are no issues of multi-collinearity in the model. The same custom contrast coding was used as in Experiment 1, explicitly testing the difference between the Music condition and the mean of the two non-music conditions. There is a significant interaction of Condition with Voice, as shown by the model predictions plotted in Figure 5.
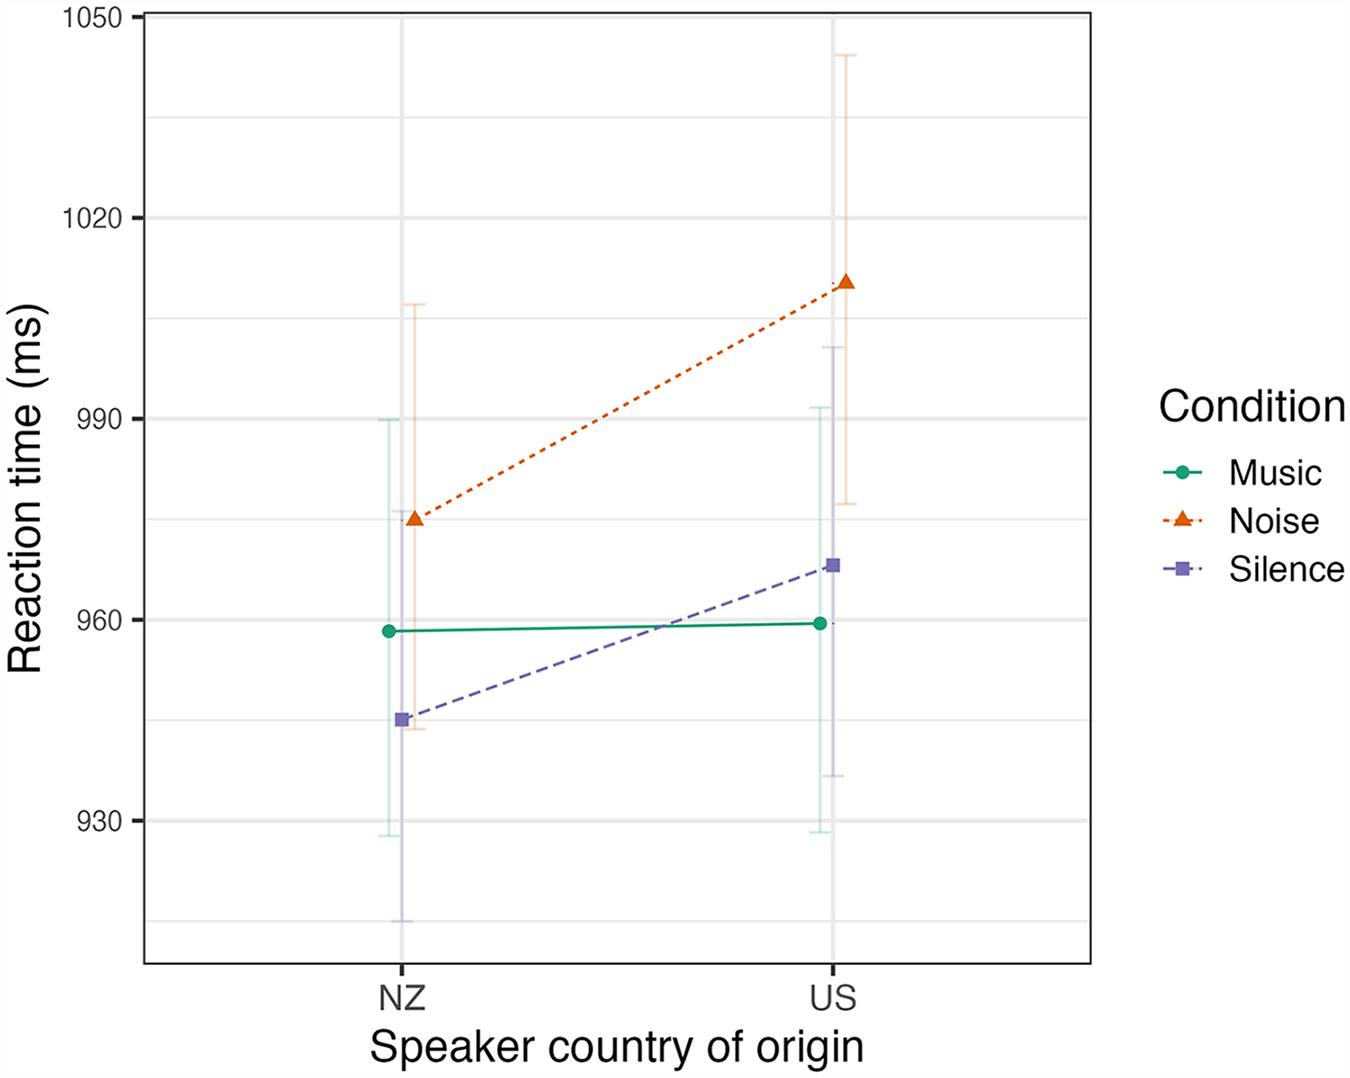
Experiment 2: predicted reaction times (back-transformed to the milliseconds scale) of correct responses to real words according to the voice (NZ or US) and the condition (Music, Noise, or Silence) showing the standard error around the model fit.
The model shows that in Silence and in Noise, participants are faster to respond to words produced by the NZ Speaker. This is to be expected, as these are NZ participants who presumably have had much more exposure to spoken NZ voices than US voices. In the Music condition, however, we see evidence of a perceptual style-shift. Compared with Silence, the Music condition speeds responses to the US voice and slows responses to the NZ voice. This pattern is consistent with their likely past experience of singing. The US voice contains the accent characteristics associated with PSE, and so is the accent that NZ listeners will expect in singing. The NZ voice is not congruent with the singing condition, and thus takes longer to process in this context.
There was a significant effect of previous reaction time, where a slower response on one trial predicts a slower response on the following trial. For example, after making a mistake or being very uncertain about a response, participants may remain somewhat distracted on the subsequent trial. This is not interesting in and of itself, but acts an important control in modeling the variation in the dataset. As for the Trial variable, unlike the results for Experiment 1, there is no effect of how far through the block the participant is, either in isolation or in interaction. The effect of perceptual style-shifting seen in Experiment 2, then, is consistent throughout the course of the experiment.
6 Discussion
It is well established that pop singers in NZ shift toward an American-influenced accent (Pop Song English) when they sing. Our aim in this study has been to determine whether listeners undergo a similar shift when listening to singing as opposed to speech. In Experiment 1 we tested NZ listeners’ response to stimuli on a bed to bad continuum. The results supported the hypothesis that, when encountering singing, participants shift the phoneme boundary between bed and bad to a position with higher F1. This reflects their experience of hearing more open short front vowels in song than in speech. Just as New Zealand singers shift from NZE to PSE when they sing, so NZ listeners undergo a perceptual style-shift to PSE when they hear singing. The effect is present at the start of each block, and diminishes as the block proceeds, and the participant becomes more familiar with each new combination of voice and context.
In Experiment 2, we looked at reaction times to a US voice and a NZ voice, producing words across three different contexts: Music, Noise, and Silence. The results show that access to words produced by a US speaker is significantly facilitated when there is background music, and access to words produced by a NZ speaker in this context is slowed.
Thus, across two different types of tasks, we have shown that New Zealanders respond differently to stimuli when they are presented in music, and in a way that is consistent with their prevalent experience of PSE in song. New Zealanders show a perceptual style-shift toward Pop Song English when they encounter language in song.
This study was not designed to speak directly to questions regarding the mechanisms driving the observed perceptual style-shifts. As described in the introduction, effects might be expected based on degree of acoustic match between the musical stimuli and previous instances of episodes of singing. They might also be predicted by assuming listeners adopt a different “mode” of listening when expecting singing. The pattern of results, however, does provide some pointers regarding the most likely source of the effects.
Experiment 1 clearly and overtly oriented participants to attend to a particular vowel contrast. It also overtly manipulated expectations with the instructions—telling people “you will hear a New Zealander singing/saying either the word bed or bad.” It certainly was the case, assuming that they read the instructions, that they expected singing in the singing condition. However, the condition was also paired with music, meaning the stimuli may have better matched stored memories of singing which also contained musical accompaniment.
In this case, what we see is a strong initial effect, which seems likely to be the result of the manipulated expectation. This effect then disappears over time, as participants are exposed to the whole continuum. As the experiment proceeds, it may also become clear to the participants that what they are hearing is not exactly prototypical “song.” This initial effect, which then disappears, appears more indicative of an expectation-based effect than a pure memory-matching one. After all, the final stimuli presented in the singing condition are not acoustically different from the initial stimuli. The participants’ strong initial expectation, however, has shifted.
Past work shows that listeners are sensitive to the anchor points at the outer ends of continua (Eimas & Corbit, 1973; Norris et al., 2003; Zheng & Samuel, 2017). In the present experiment, where there is a clear phonological contrast within the range of stimuli, the unambiguous tokens at the endpoints of the continuum may help listeners to form a frame of reference for vowel perception. Once participants establish the range of variation occurring, they may then calibrate the phoneme boundary based on the extent of the variation.
In the context of Experiment 1, it is important to note the distinction between perception and decision. When a participant reports hearing bed, it is the result of a decision-making process, subject to experiment-specific strategies, rather than a direct measure of how the participant actually perceived the stimulus. Zheng and Samuel (2017) show how different experiment designs, ostensibly exploring the same research question, can have different results. The present experiment has a blocked design and also allows participants to hear stimuli at the unambiguous endpoints of the continuum. This may bias the results toward decision-type responses rather than perception-type responses. That is, the experiment may be about participants’ interpretation of the stimuli at a late stage of processing. Future attempts at replication could consider a mixed rather than blocked design, and a continuum without unambiguous stimuli.
One of the strengths of this task was that one trial was sufficient to test the fundamental hypothesis. As seen above, the more trials there are, the less of an effect the manipulation had on vowel perception. The between-participants difference in responses to the first token of the experiment provides a simple but striking illustration of how differing context-driven expectations can result in differing perception of the same auditory stimulus. The decreasing effect of condition as the experiment progresses shows listeners shifting from global cues in the wider context to more local cues once such information becomes available.
In Experiment 2, we turned to words. We also used a wide range of different variables, and so it is unlikely that participants attended specifically to particular features that underpinned the dialectal differences. This task, much more than the first, relies on a process of lexical access. We again explicitly told participants when to expect singing, and when to expect speaking, across blocks. Moreover, we also told them where the speaker comes from. All of this was reinforced with an image, to make sure that all participants had clear expectations for each block.
We found that, in general, they were faster to respond to the NZ voice than the US voice, as would be expected (processing is faster for more familiar dialects, Clopper et al., 2010). However, they were somewhat slowed when they were led to expect a New Zealander singing. It is in this condition that the dialect features do not actually match the expectation that we have set up. A New Zealander does not sing in NZE, they sing in PSE. Our stimuli were recordings of a New Zealander who was speaking, not singing, and thus producing NZE. In this experiment, it is not the case that participants were expecting to hear a US voice in the “New Zealander singing” condition, because we told them they would hear a New Zealander. Rather, what they were expecting to hear was a New Zealander producing PSE.
In Experiment 1, the participants’ differing expectation across the conditions seems to have affected their phoneme boundary, while in Experiment 2, the mismatch between the participant’s expectations and the acoustics they encountered may have caused them to react more slowly. Unlike in Experiment 1, however, there is no interaction with trial number in Experiment 2. Participants remain slowed in the NZ-singing condition for the whole experiment. This suggests that what we are seeing is not simply an initial expectation effect, which is over-ridden when the participants adjust to the actual audio they are presented with. It seems likely that it is also a lexical access effect, with participants having a harder time accessing lexical representations that do not match their prior experiences with song. This is similar to the results reported by Walker and Hay (2011) showing that words that are usually experienced in young voices are slower to process when produced by an older speaker, and vice versa. Just as the incongruence between “word age” and voice age slows listeners in that experiment, so too does incongruence between the sung context and the NZ accent slow listeners in the present lexical decision task.
In Experiment 2, in particular, we used a range of strategies to invoke a “singing” listening mode. Multiple cues were given to prime the idea that participants would be encountering singing in the Music condition. In addition, the fact that the voices were labeled with nationalities (“New Zealander” and “American”) and blocked together, rather than randomized within blocks, allows listeners to form a coherent and persistent frame of reference for that voice. In future work, the effect could potentially be further elucidated by presenting the voices in randomized rather than blocked order, so that it is harder for participants to maintain persistent ideas about who is speaking.
Taking results of both experiments together, there is some evidence that multiple mechanisms may be at play. However because the experiments were not designed to interrogate the precise underlying mechanisms driving these effects, we are not in a position to provide any definitive answer to this question. What we can confidently say, however, is that New Zealanders do not process singing in the same way that they process speech. Across two quite different experiments, we see clear evidence for an effect of perceptual style-shifting.
7 Conclusion
This study has shown that New Zealanders expect to hear an American-influenced phonetic style, Pop Song English, when they encounter language in song, and they adjust their perceptual vowel space accordingly. They also find it easier to process a US voice in a music context (where it is contextually congruent), and harder to process a NZE accent in this context. Taken together, these findings show a clear effect of perceptual style-shifting. They also suggest that these NZ participants may actually be regarded as bidialectal in NZE and PSE, despite perhaps only rarely engaging in song production themselves. NZ listeners have learned that in the context of a pop song, dress and trap will be much more open than they would be in conversational speech. They also find it easier to identify sung words when they are produced with dialect features associated with American-influenced Pop Song English, rather than with features of spoken New Zealand English. It is not just NZ singers, then, who style-shift to Pop Song English in the appropriate context. Listeners undergo a context-appropriate perceptual style-shift, and these shifts may happen without any effort or awareness. Gibson and Bell (2012) and Gibson (2024) argued that PSE is a “default style” for NZ singers rather than a mannered adoption of a foreign accent. The significant results of the two experiments presented here provide further evidence for this perspective, by showing that PSE is a context-appropriate convention learned by performers and non-performers alike.
The results presented in this article invite replication in other contexts. There are several paths this could take. With respect to genre, a range of extensions are possible. For example, listeners may have facilitated processing of a Jamaican voice in the context of a reggae music background (see Gerfer, 2018), while a Standard Southern British English accent might be easier to process in the context of choral music (see Wilson, 2017).
There are also interesting questions that could be explored about the degree to which the observed perceptual style-shifting is gradient. Even within the realm of singing, vocal styles range from quite speech-like, to very “singy” (to use Coddington’s [2004] term). This can vary even within a song, with choruses sometimes being more singy than verses (Gibson, 2010, pp. 111–112). In the domain of perception, shifts away from the frame of reference used for processing conversational speech may be greater for more singy voices. An operatic aria, for example, is more singy than rap, and may involve larger shifts away from speech norms in both production and perception.
Participants in the experiments presented here were not selected to explore variables such as their prior exposure to music. Future work could potentially compare groups that listen to more commercial pop music with those who listen, for example, to predominantly choral music. We would expect the effects seen in Experiment 2 to be stronger for those with more exposure to PSE in song, while classical background music might aid the perception of a Standard Southern British English voice for a certain subset of listeners with sufficient exposure to that genre.
Previous research established that New Zealand singers use Pop Song English as a default style in the context of song. In this article, we have shown, across two experiments, that New Zealand listeners display a comparable form of style-shifting in perception. PSE is thus not only the norm for singing in NZ, it is also a norm for listening to song, represented in the minds of the general music-listening public.
Footnotes
Acknowledgements
This research was conducted as part of a PhD project completed by Andy Gibson at the University of Canterbury supported by a Canterbury Scholarship and supervised by Jen Hay, together with Lynn Clark and Catherine Theys. We would like to thank the speakers who provided their voices for the stimuli, and all of our experimental participants. We are also grateful to Jonathan Wiltshire, for help with E-Prime, Ryan Podlubny, and Rob Batke for access to their “Science Music,” Paul Warren for his vowel resynthesis Praat script, and to our colleagues at the University of Canterbury for ongoing discussion and feedback.
Funding
The author(s) received no financial support for the research, authorship, and/or publication of this article.