
Abstract
Swine are a common neurobehavioral model. Visual event related potentials (VERPs) are an electroencephalogram (EEG) technique that assesses visual processing and can inform brain function and sensory changes after trauma or disease. We hypothesized that piglet visual EEG processing for 2D conspecific (CS) images would produce more cortical activity than a simple white square stimulus. We measured VERPs in healthy piglets presented with a 2D CS piglet image (N = 5) and compared these results with animals presented with a simple white square (WS, N = 5). EEG waveforms were input into a source localization model of the brain to estimate cortical activity. N1 and P2 amplitudes and latencies and current density were extracted for each animal. Visual processing of CS produced longer N1 and P2 latencies than WS in the visual processing regions, suggesting that pigs may require longer processing times for more detailed images. Contrary to our hypothesis, CS had lower P2 amplitudes (frontal and left temporal) and current density (right temporal and occipital), which suggests that CS requires less processing power. Magnitudes may be related to the brightness of the stimuli presented (a feature that was not controlled for) with WS having on average a higher lux (112) than CS (98). Regardless, latency differences between CS and WS demonstrate that visual processing is sensitive to subtle stimulus features which can inform future studies on pig behavior and attention. Finally, these data serve as a healthy reference to compare VERPs in experimental cohorts subject to brain injury or other neurological diseases affecting visual processing.
Introduction
Pigs have become an attractive large animal model in biomedical research in recent years. Owing to their similarity to humans in their anatomical structure (skin, brain, heart) and function (gastrointestinal, cardiovascular systems), various pig models of diseases have been established (traumatic brain injury, schizophrenia, Huntington’s), which has progressed the development and testing of drug therapies and therapeutic devices/prostheses.1–3 The rapid neurodevelopment of the piglet from birth permits the studying of neurodevelopment and complications in the infant and adolescent ages. 4 Owing to the advanced nervous system, pigs have been used in cognitive behavioral studies involving memory and learning. Additionally, the well-defined gyrencephalic pig brain has permitted the use of neuroimaging methods and tools that have been similarly used in humans thereby increasing the potential for translation between clinical and pre-clinical research.5,6
Of particular interest in this report, the pig visual system has been shown to have high fidelity to the human visual system as verified using functional magnetic resonance imaging techniques and through the characterization of minipig-specific optical measurements and electrophysiology (visual evoked potentials). 8 High fidelity between species has facilitated the research and design of visual implants and prostheses. 2 Furthermore, flash visual evoked potentials have been characterized in the Vietnamese miniature pot-bellied pigs, 9 and more recently in our laboratory, visual event related potentials (VERPs) were characterized in healthy Yorkshire piglets 10 and piglets subject to single or multiple repeated brain injuries. 11 VERP is an encephalographic (EEG) technique that measures the brain’s response to a visual stimulus on the millisecond scale. The same stimulus is repeated over many trials and averaged for one subject to obtain a VERP waveform with a strong signal to noise ratio representative for that subject and condition. 12 The VERP produces a characteristic waveform with a series of local maxima and minima with the first positive peak (P1) at roughly 80 ms, first negative peak (N1) at 100 ms, second positive (P2) at 200 ms and are associated with visual stimulus information processing, including object orientation and location. 13 Comparing healthy VERPs with those captured from a diseased population can provide information regarding deficits in visual information processing that may be related to severity and disease burden. 14 In our previous work, animals with multiple brain injuries had reduced N1 amplitudes, while single injury groups had increased N1 amplitudes, indicating different effects of injury on the piglet visual system with less severe groups able to compensate after injury. 11 Our previous studies examined the pig VERP to simple white square stimuli. In this study, we employed more advanced or familiar images, such as two-dimensional (2D) conspecifics that require more complex visual information processing and, therefore, cognitive demand. The objective of this study was to first characterize piglet visual processing of 2D conspecific piglet photos in healthy piglets and compare these VERPs with those from a simple white square stimulus. We hypothesized that the increased complexity and familiarity of the 2D conspecific image would require increased visual processing (cortical activations and longer durations) when compared with a simple white square stimulus.
Animals
Five healthy female Yorkshire (Sus scrofa domesticus) piglets (four weeks old) were used in this study and were obtained from Premier BioSource (Rensselaer, IN, USA). Animals were cage housed in groups of two or four, put on a 07:00 h to 19:00 h light–dark cycle. Upon arrival at the Emory’s animal facility, piglets underwent quarantine in their cage room for three days to monitor for illnesses. During this time, they were fed by the research team and after which they were permitted to eat piglet pellets (LabDiet 5080, MO) and drink water freely. Prior to the first data collection session, animals experienced a stepwise acclimatization process over three days with the research team. The first day, animals were taken into the laboratory environment to expose them to the sights and smells of the research equipment (sling, headgear) and personnel. On the second day, animals were acclimatized to the sling for short increments of time before being taken out, provided a food reward, and allowed to roam freely in the research space. On the third day, animals were placed in the sling and a nylon stocking (with eye and ear hole cut-outs) or an inactive EEG net (not collecting data) was placed on their head to acclimatize them to the sensation of headgear for short increments of time before being taken off. Throughout the acclimatization process, animals were monitored for stress and discomfort. Day 2 and day 3 processes were repeated up to three times in a session with the goal of the animal having a quiet demeanor for approximately three consecutive minutes in the sling with headgear on. Animals were given frequent breaks and food rewards.
Data collected from these animals were compared with five randomly selected healthy animals (out of 11) that were previously studied 10 by the same research team and presented with a simple white square stimulus. G*Power (version 3.1.9.7, Universitat Kiel, Germany) confirmed that our sample sizes of five per group were adequately powered as informed from one of our previous publications comparing auditory and visual processing in piglets. 11 After study, animals were anesthetized, serum was collected, and brains perfusion-fixed for future study. Anesthesia was induced using an initial intramuscular injection of ketamine (4 mg/kg), xylazine (2 mg/kg), and midazolam (0.2 mg/kg) and maintained with isoflurane via a snout mask (1–4%) to ensure absence of pain response as confirmed via a toe pinch. Once a surgical plane of anesthesia was achieved, the animal was intubated and placed on the ventilator (10–15 ml/kg) during blood withdrawal and heparinized saline infusion. Animals were then given an overdose of pentobarbital (Euthasol 150 mg/kg of body weight) via intravenous catheter or intracardiac injection and formalin perfusion initiated. The Institutional Animal Care and Use Committee at Emory University approved all animal procedures and techniques employed in this study.
Materials
Visual event related potentials were acquired using a 32-electrode EEG net, custom made for use with piglets (Electric Geodesics Inc., EGI, Eugene, OR, USA). The electrodes are contained within a stretchable bonnet that fastens under the chin to maintain contact with the scalp. The net is connected to an amplifier (Net Amps 400) and MacBook Pro laptop with Netstation 5.0 (Electric Geodesics Inc., EGI, Eugene, OR, USA) to collect EEG data at 1000 Hz. The laptop was connected to a PC computer equipped with E-Prime 2.0 (Psychology Software Tools, Inc, Pittsburgh, PA, USA) to present time-synchronized visual stimuli using a 7’ portable monitor within 20 cm to the left eye of each piglet. To facilitate the conduction of the electrodes, the net was submersed into a bucket containing 1 l water, 5 ml baby shampoo, and 10 ml potassium chloride for at least 5 min as per manufacturer’s instruction. Before each data collection session, impedances were checked to ensure all electrodes were below 1 kΩ. After data collection for one animal, the net was returned to the salt solution to rehydrate the electrode cells. All animals studied on the same day used the same electrode net. After EEG measurements were completed for all animals on a single day, the net was disinfected and rinsed with water for storage.
Methods
The left eye of each animal (N = 5) was presented with a 2D conspecific image of a photograph of a piglet sitting on its hind limbs, against an all-white background (0.200 s). This was followed by an all-black screen (1.00 s). The sequence was repeated 30 times for a single block of trials. Each animal was presented with three blocks of trials per day (Figure 1). This testing protocol was repeated on each animal for three non-consecutive days. No animals were excluded from data analysis. For comparison, five animals were randomly selected from a previously studied cohort of 11 animals in which the left eye was presented with a simple white square on a black background followed by an all-black screen with the same timing sequence as the 2D image. 10 Both types of image were maximized on the 7 inch monitor without distortion. Data from the white square were similarly taken for three blocks of trials and for three separate days.
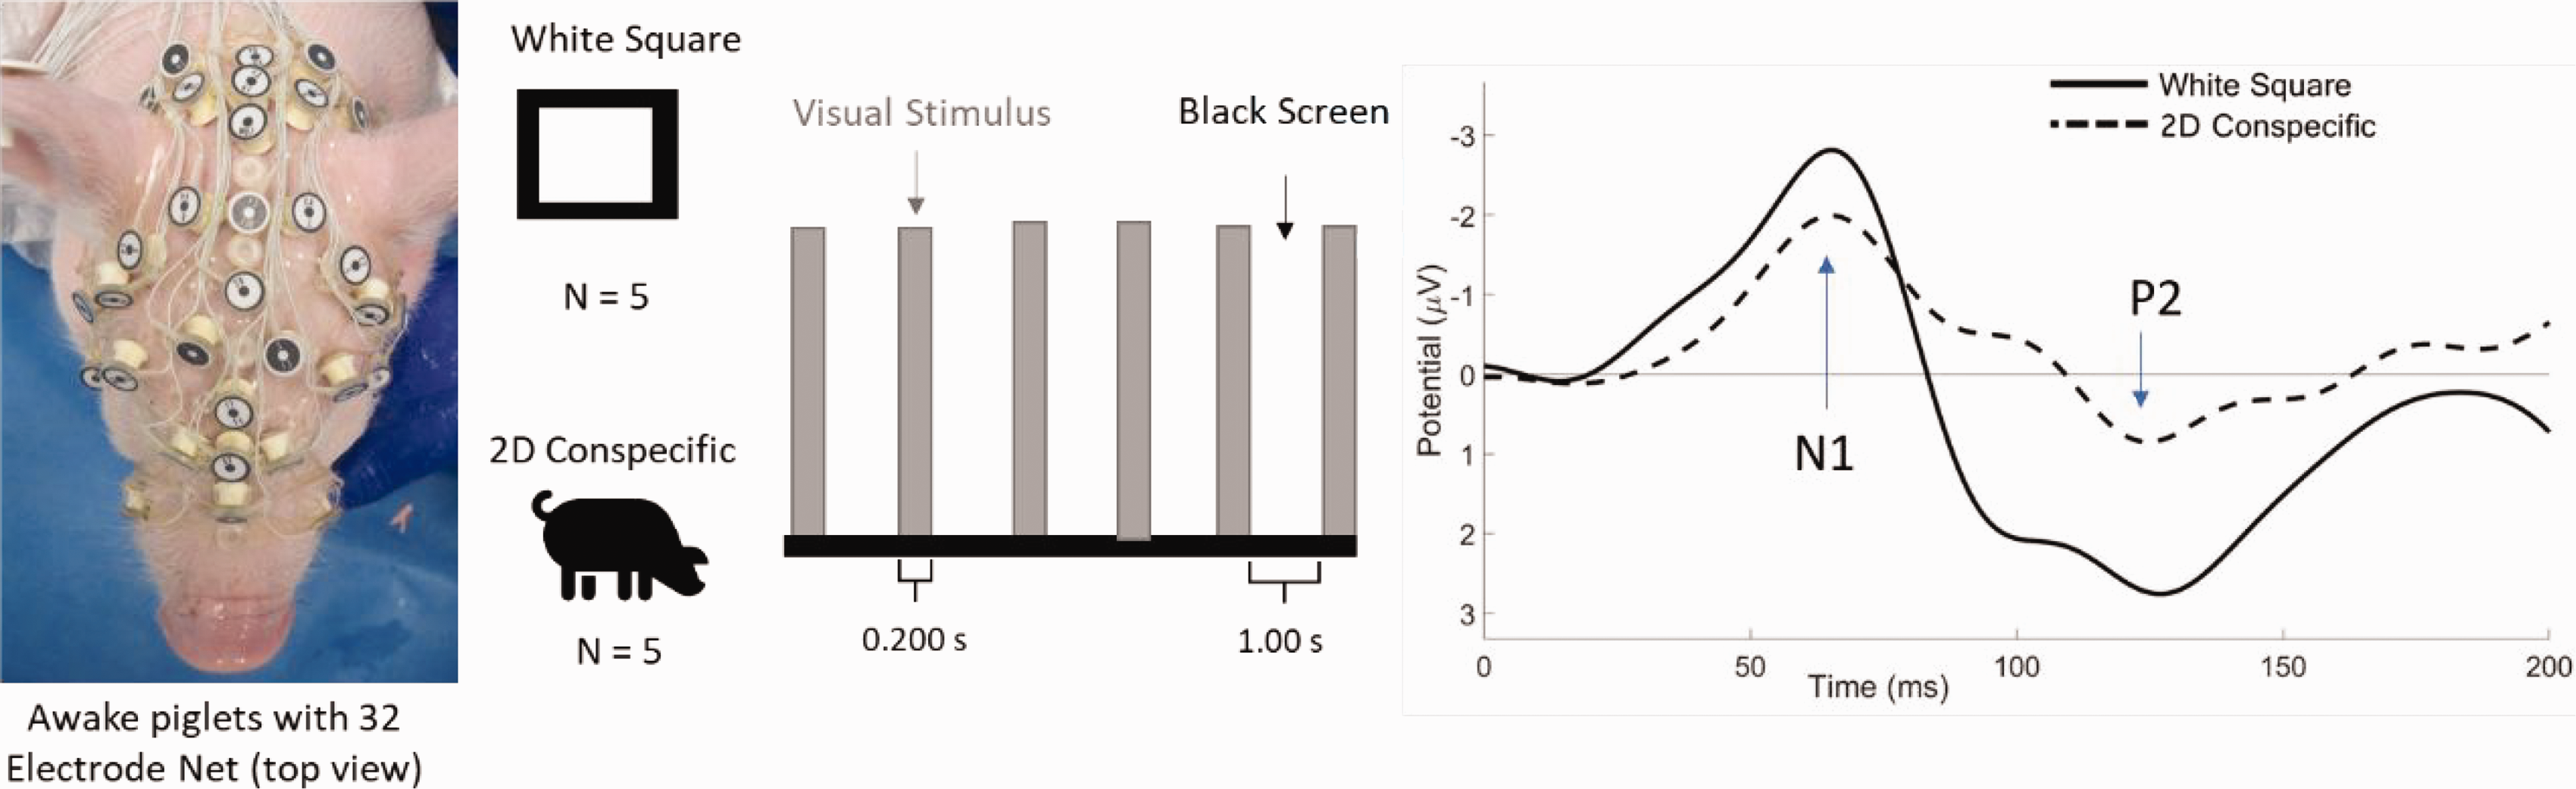
Visual stimuli paradigm employing a simple white square or a two-dimensional (2D) conspecific photo presented intermittently for 0.200 s to awake piglets outfitted with a 32-electrode encephalographic net (left). An example of a visual event related potential for each type of stimulus is presented with N1 and P2 components indicated (right).
Data processing and modelling
EEG data were pre-processed using Netstation Tools (Electric Geodesics Inc., EGI, Eugene, OR, USA) which included a band-pass filter from 0.1 to 30 Hz, then segmentation into epochs of 300 ms length that encompassed a 50 ms pre-stimulus period and a 250 ms post stimulus response. If a channel contained signal that was greater than 200 µV, the channel was replaced using nearby channels in Netstation Tools. The data were then imported into EEGlab (Version 14.12) 15 and Matlab (Version 2020b; The Mathworks, Inc., Natick, MA, USA) for further data processing which included baseline correction, independent components analysis for removing noise and artefacts. For each day, trials were averaged for each of the 32 electrodes, producing 32 VERP waveforms for each subject for that study day.
The VERP waveform is a series of peaks and troughs (Figure 1, left) as a result of the stimulus presentation. In our previous study, 10 we found that the first negative (N1) and second positive (P2) peaks were the most consistently produced in piglets after visual and auditory stimulation. N1 peaks typically occur around 60–70 ms after the stimulus, followed by a positive peak (P2) at roughly 120–140 ms and are related to stimulus discrimination and late-stage object processing, respectively.16,17
For VERP analysis, N1 and P2 amplitudes and latencies were extracted from each VERP waveform and treated separately for further analysis. To study regional responses, N1 amplitude data were averaged from the following electrodes to represent the front: 1, 2, 3, 4, 17, and 27, the left temporal region: 5, 11, 13, 15, and 23, the right temporal region: 6, 12, 14, 16, and 24, and the occipital region: 9, 10, 19, and 20. Regional averaging for each electrode group was also completed for N1 latency, P2 amplitude, and P2 latency. Therefore, each animal had a single N1 amplitude, N1 latency, P2 amplitude, and P2 latency at each region per study day and stimulus type.
Additional source localization analysis was accomplished using a finite element brain model representation of the four-week old piglet as had been conducted in a previous report. 10 Briefly, a three-dimensional computational model was created using magnetic resonance imaging (scans of an infant piglet and segmented into parts comprising the scalp, skull, and brain. The original intention of the piglet model was to study intracranial hemorrhage using electrical impedance tomography in the newborn piglet 18 and was scaled to the size of the four-week old piglet and encompassing 32-electrode array where possible. Eight electrodes lay outside of the piglet model (behind the ears) and therefore data from these electrodes9,10,19–24 were not used in the source localization analysis. The remaining 24 regional EEG electrodes were incorporated into the brain model and processed EEG waveforms were input into the model to estimate sources of cortical activity associated with VERP processing. The brain was partitioned according to five regions of interest (frontal, left and right temporal, and left and right occipital) and mean current densities were extracted at 50, 85, and 110 ms post stimuli to capture activity around the N1 amplitude. Mean current density values for each region were obtained per animal, per day, and timepoint and used as input for statistical analysis.
Statistical analysis
Two-way analysis of variance (ANOVA) tested the effect of stimulus type (2D conspecific image and white square) and region of interest on N1 and P2 amplitudes and latencies. Mean current density data were first stratified by time point (50, 85, and 110 ms) then two-way ANOVAs (2D conspecific image and square) were run. Post hoc analyses involved one-way ANOVAs for region and t-tests with Bonferroni corrections for stimulus type to identify significant comparisons. Statistics were accepted at p < 0.05 and conducted using IBM SPSS Statistics Version 29 for Windows (IBM Corp., Armonk, NY, USA).
Results
N1 and P2 amplitudes and latencies (mean ± standard error) and mean current densities for piglets presented with a simple square or 2D conspecific image are presented in Figures 2 and 3, respectively. There were main effects of region (F(3,112) = 4.644, p = 0.004) and stimulus type (F(1,112) = 8.514, p = 0.004) for N1 amplitude with post hoc tests showing that 2D conspecific images produce lower amplitudes than square stimuli (Figure 2(a)). A significant interaction between region and stimulus was observed for N1 latencies (F(3,112) = 7.140, p < 0.001), where 2D conspecifics had longer latencies in the occipital area than in all other regions and was significantly longer than square stimuli at this site (Figure 2(b)). Like N1, there were main effects of region (F(3,112) = 3.371, p = 0.021) and stimulus type (F(1,112) = 25.584, p < 0.001) for P2 amplitudes with post hoc analyses showing reduced values for 2D conspecifics compared with square in the front and left region (p ≤ 0.007). Additionally, the square stimuli produced significantly greater amplitudes in the left than in the occipital region for this condition (Figure 2(c)). Again, like N1, there was a significant region by stimulus interaction for P2 latencies (F(3,112) = 3.410, p = 0.20), with post hoc tests illustrating longer latencies from 2D conspecifics in the occipital region than in the left side, as well as longer latencies than square stimuli at this site (p ≤ 0.03; Figure 2(d)).
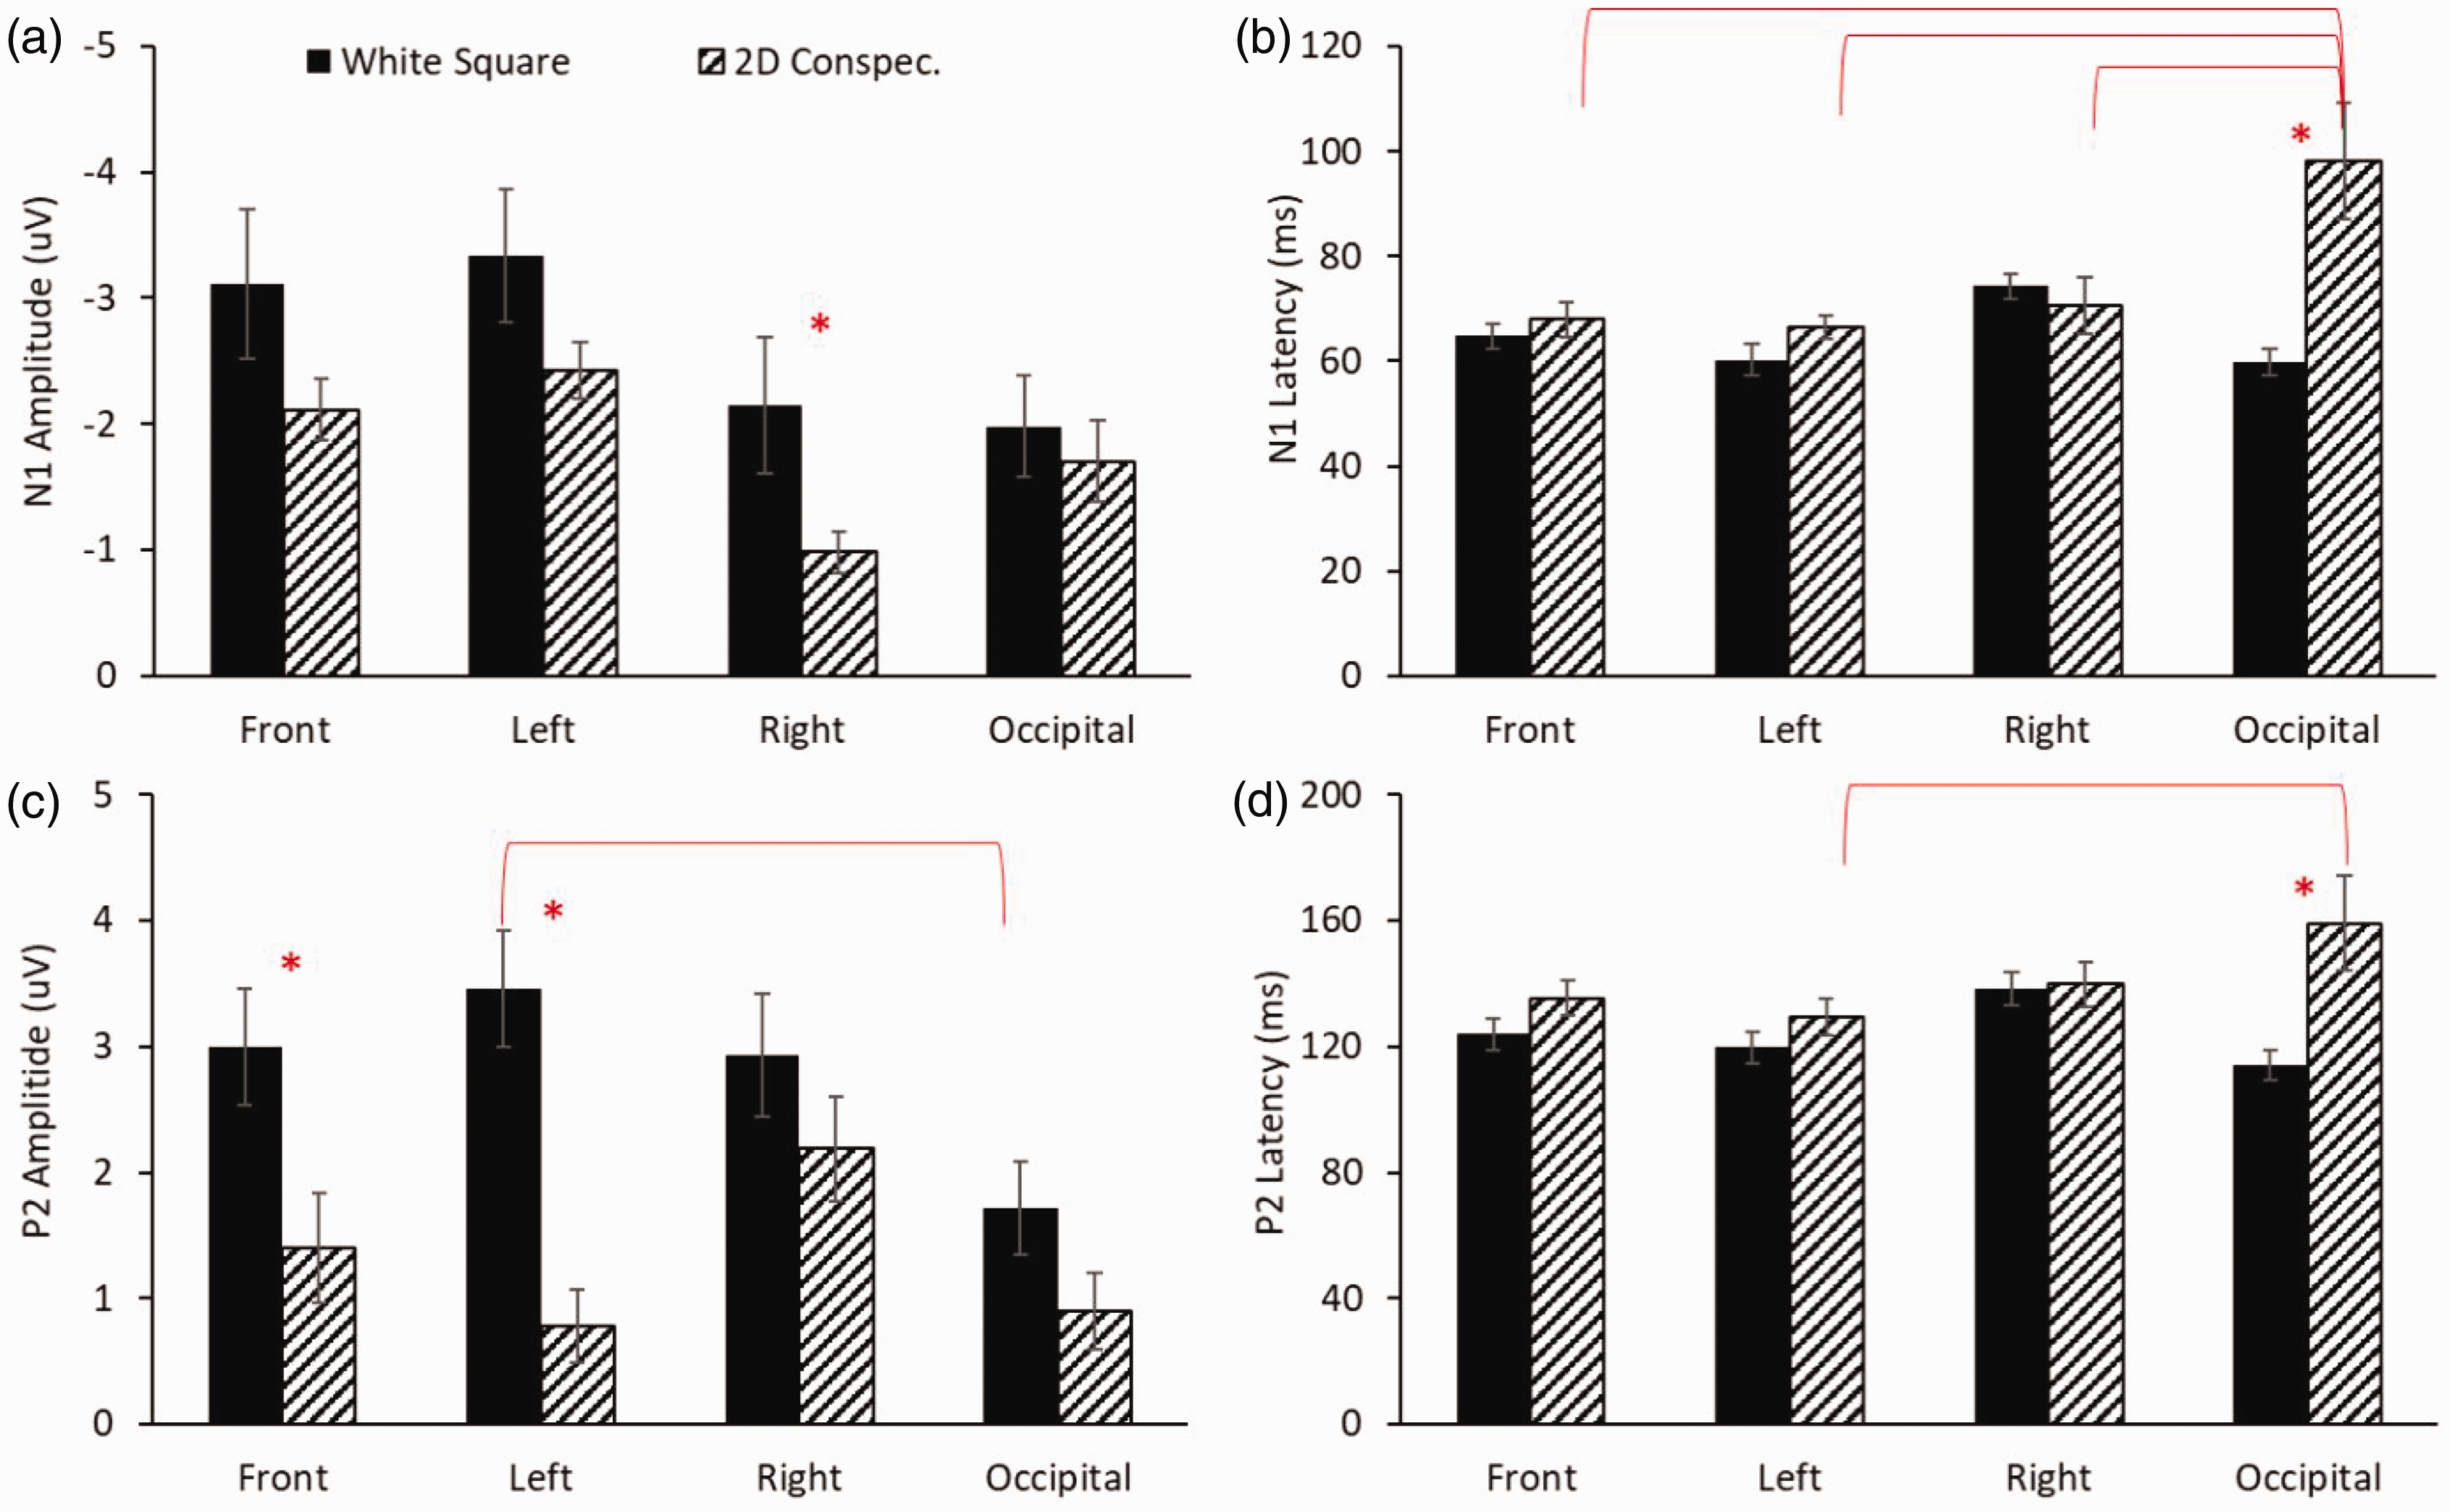
Mean ± standard error of N1 amplitude (a), latencies (b), and P2 amplitudes (c), and latencies (d) at each region for groups of piglets presented with the flash (solid black) or 2D conspecific photo (striped). Significant comparisons are illustrated with an asterisk or an overlaying bar with p < 0.05. N1: first negative peak; P2: second positive peak.
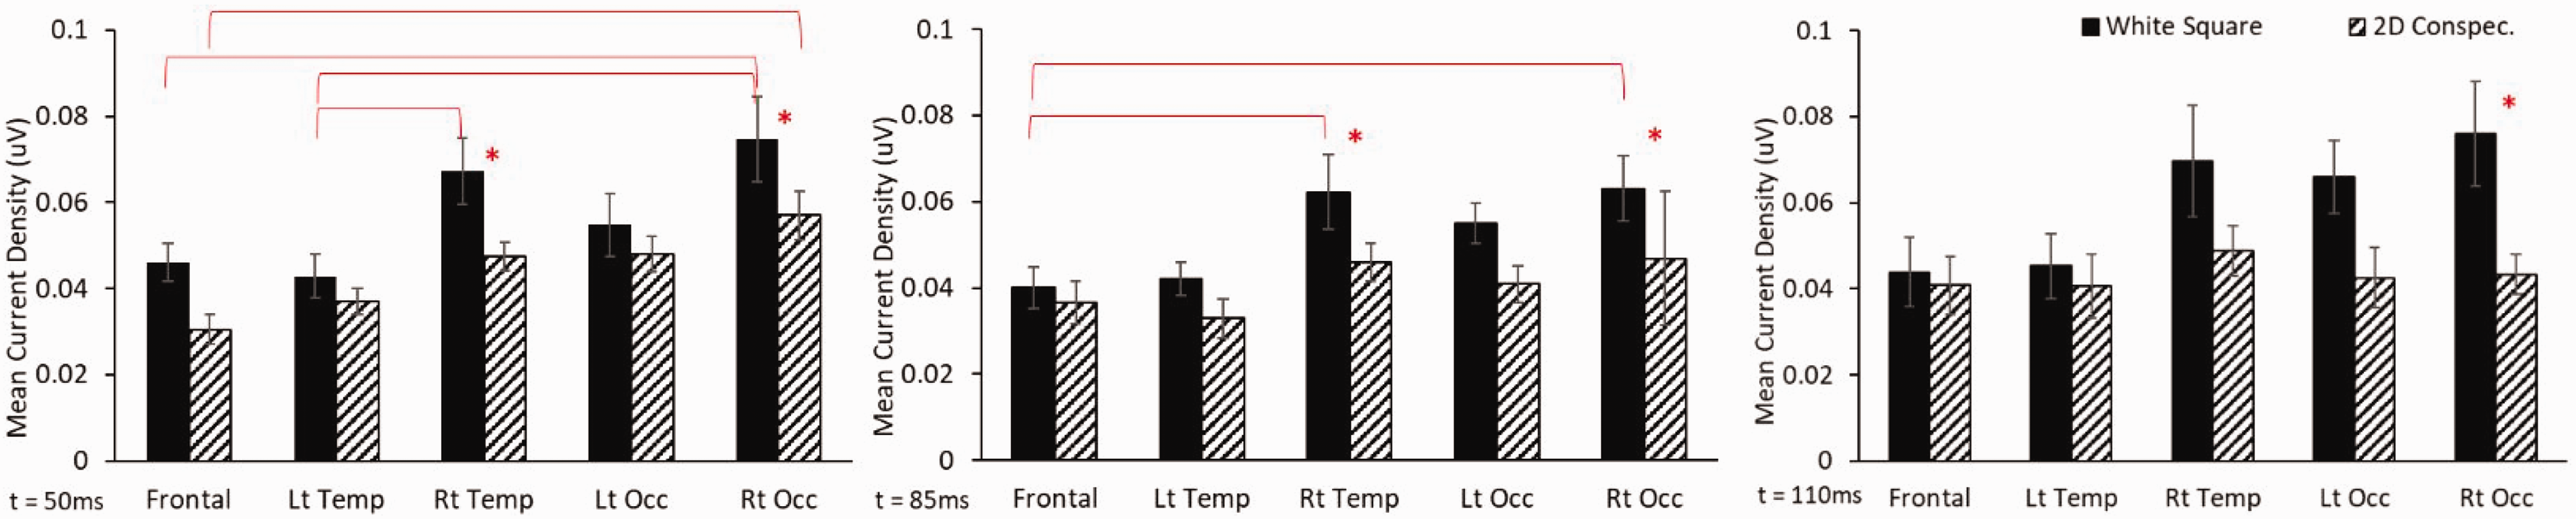
Mean current density results for square and 2D conspecific visual stimuli for each brain region at 50 ms (left), 85 ms (middle), and 110 ms (right) post visual stimuli. Significant comparisons are illustrated with an asterisk or an overlaying bar with p < 0.05. Lt temp: left temporal; Rt temp: right temporal; Lt occ; left occipital; Rt occ: right occipital
For mean current density, there were significant main effects on mean current density for region and stimulus type at 50, 85, and 110 ms (Figure 3). Post hoc analyses show 2D conspecifics producing lower activity than square stimuli at the right temporal regions at 50 ms and 85 ms and right occipital regions at all time points (Figure 3, asterisk in all panels). Lateralization of brain activity was observed for the early time point (50 ms) where square stimuli produced significantly greater activity in the right temporal and occipital regions over the front and left temporal areas (Figure 3, left panel), and in the right occipital region over the frontal area for the 2D conspecific image. Lateralization of current density could be further observed at 85 ms for the square stimuli only with greater magnitudes at the right temporal and occipital regions over the frontal area (Figure 3, middle panel).
A qualitative depiction of current density activity (warmer colors indicate more activity) in a single piglet presented with square stimuli (top panel) and the 2D conspecific image (bottom panel) is illustrated in Figure 4 at 50, 85, and 110 ms post stimulus. Greater right-side lateralization can be observed from square, particularly at the earlier time points. Opposite regional responses were observed for VERPs with larger P2 amplitudes in the left temporal than occipital regions from square (Figure 2(c)). In Figure 4 (top left panel), this is likely due to electrode placements on the scalp that captured more focal activity in the left temporal region (arrow) than the electrodes over the occipital region (dotted oval).
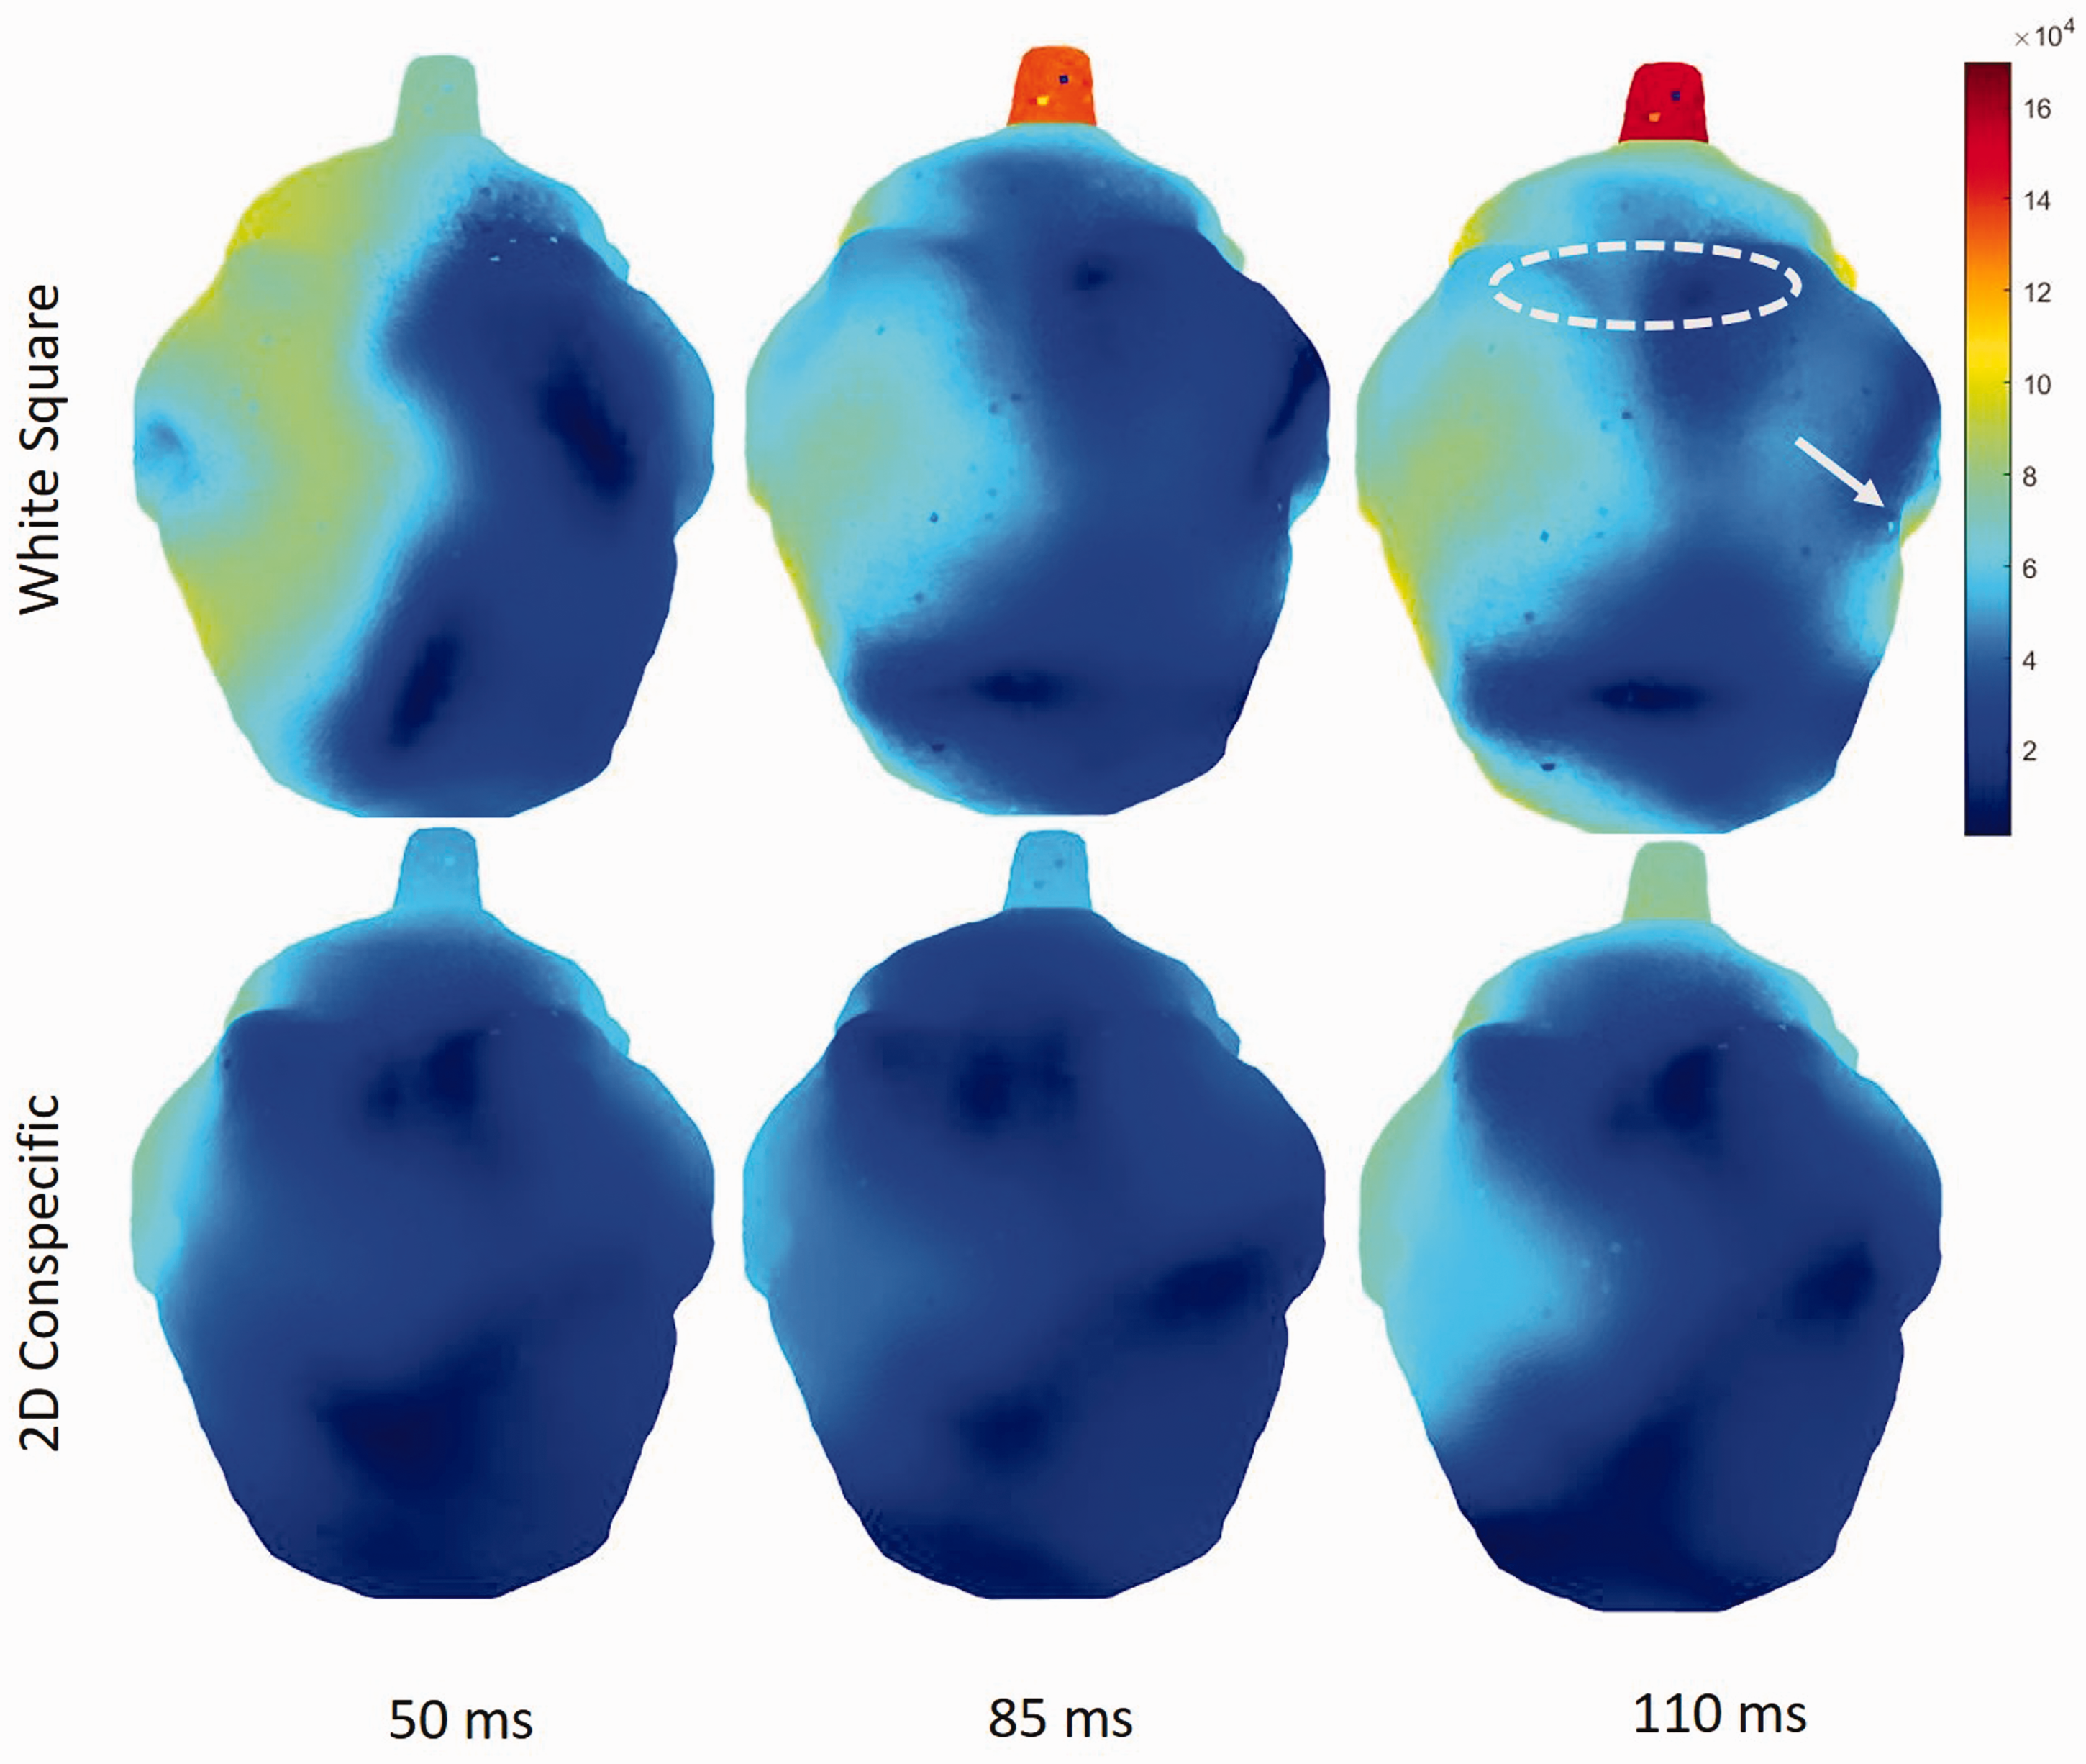
Visual depiction of greater lateralized current density distribution from a single animal presented with a square (top row) than from an animal subject with 2D conspecific image (bottom row) at 50, 85, and 110 ms post stimuli. Warmer colors indicate greater levels of activity. Square stimuli at 110 ms (top right image) coincide with P2 amplitude results where electrodes on the scalp encompassing the left temporal region capture greater and focal P2 amplitudes than the electrodes encompassing the occipital region as approximated by the dotted oval, contributing to statistical significance observed in Figure 2. P2: second positive peak.
Discussion
Longer N1 and P2 latencies to 2D conspecific images than to white square stimuli were observed in the occipital electrodes, a region close to the visual cortex, 19 and previously associated with visual processing in piglets. 10 We hypothesize that longer processing times are required to process the greater complexity of the 2D image in comparison with the square stimulus, which includes discrimination of the piglet and its physical features against a plain white background. In humans, the first stage of visual processing is automatic and reflects the detection of visual stimuli in the cortex. Further processing is often completed in a top-down manner where factors such as attention and level of arousal can influence neural activations and timing, including distinguishing between two similar types of stimuli.12,20 In one study involving human participants, subjects were required to discriminate between a circle changing into a horizonal ellipse or one changing into a vertical ellipse by pressing one of two buttons. These VERPs were compared with a detection task where subjects pressed a button when the circle started to change shape. Longer N1 latencies were found for visual discrimination tasks (circle to horizontal or vertical ellipse) and were shorter for simply detecting the circle deformation stimuli. 21 Higher levels of visual processing and processing pathways have yet to be described in swine. The visual paradigm in our porcine study was passive in nature (did not require a button-press) but differences between the two types of visual stimuli yielded alternative visual processing pathways for the 2D conspecific image as demonstrated by latency and magnitude. Contrary to our hypothesis, conspecific image had lower P2 amplitudes (frontal and left temporal) and current density magnitudes (right temporal and occipital), which suggests that conspecific image requires less processing power. We measured stimulus brightness using a digital lux meter as a check to ensure that the equipment was producing consistent brightness between study days; however, we did not adjust to ensure the same level of brightness between stimulus types in this study. Future work should control for image brightness and ensure consistency between stimuli. We cannot rule out that this finding may be related to the luminance levels of the presented visual stimuli, because the average measured lux during a single block of trials in the five animals for conspecific image was 98 and the average for the five animals with the white square was 112. The relatively lower lux for the 2D image resulted in lower N1 and P2 amplitudes. This finding is corroborated in humans, where it has been shown that brighter visual stimuli result in greater VERP amplitudes. 22
Source localization analysis revealed greater electrical current density activity for square stimuli in the right temporal and occipital regions, which may also be attributable to the higher lux, as the N1 and P2 amplitude responses indicated. Interestingly, lateralization of cortical activity can be observed from square stimuli, with greater activity encompassing the right temporal and right occipital areas than the frontal and left temporal regions. The right side dominance is attributed to the visual stimulus being presented in the left eye and the decussation of the piglet optic tract, producing right side cortical activity in comparison with the left. 25 The 2D conspecific image did not produce significantly different activations across the five brain regions, which demonstrates differential visual processing patterns in piglets despite interstimulus parameters remaining the same for both conditions (Figure 1). Hemispheric laterality is a concept common to behavioral and animal sciences related to emotional processing in animals, with positive emotions processed in the left hemisphere and negative emotions in the right. 26 It is possible that the brighter square stimuli presented in our study could have produced a negative response compared with the conspecific image owing to the relative intrusiveness of the bright square. However, more research is required to validate this hypothesis, including animal video analysis of body language and facial expressions to confirm affective states and behavior in the piglet.23,24 In addition, our study is limited to the two types of stimuli as we wanted to determine whether familiar and complex conspecific images would produce greater changes in piglet visual processing than a simpler one. We attempted to balance maintaining the young animal’s visual attention while in the sling and keeping the tasks low in effort as animals were approximately four weeks in age. Although the same research team handled animals in both studies, we did not test both types of visual stimuli in the same animal, which may have an effect on the findings. In addition, our study is limited to female piglets only to limit any potential confounding effects of sex on VERPs. Future research is warranted to elaborate on this study to include a variety of shapes, colors, and scenes in order to evaluate higher levels of cognition, including perception.
Swine models are becoming increasingly popular in the field of ophthalmology owing to their similarity in anatomy and physiology to the human visual system, including similar sized eyeballs, retinal area, and corneas.27,28 These similarities have permitted the use of pigs in developing surgical techniques and tools, the design and testing of corneal prostheses, 5 and the development of transgenic swine models to study retinal degeneration and diseases. 29 The findings in this study may be applicable to the greater animal sciences and biomedical research literature by establishing healthy baselines for VERPs in piglets which can be used for reference and can inform hypothesis testing in various disease models related to visual processing. For example, our results can inform healthy baseline levels in piglets with which animals with brain injury or disease can be compared.
Conclusion
This study demonstrated differential visual processing in healthy four-week-old piglets from a 2D conspecific photo in comparison with a simple white square stimulus. While the magnitude of cortical activity is modulated by the brightness or lux of the visual stimuli, the more complex 2D image required longer processing times in visual centers in the piglet brain. Although these findings are specific to female piglets, future studies could include male subjects to confirm whether comparative trends for square and conspecific images would differ in males. The passive nature of the VERP tests employed in this study in combination with using devices originally designed for use in humans increases the potential translatability of this research to the clinical population.
Footnotes
Acknowledgements
The authors would like to thank Mackenzie Mull and Akshara Thakore for their help and support with our animal studies.
Author contributions
Both authors made substantial contributions to the paper and contributed to the conception and design, and interpretation of data. RAO ran the experiments, collected and analyzed the data. RAO and SSM interpreted the data. Manuscript draft and revisions were completed by both RAO and SSM. Both authors read and approved the submitted version of the manuscript.
Availability of data and materials
The datasets used and/or analysis during the current study are available from the corresponding author on reasonable request.
Declaration of competing interests
The authors have no conflicts of interest to declare.
Funding
The authors disclosed receipt of the following financial support for the research, authorship, and/or publication of this article: This work was supported by National Institute of Neurological Disorders and Stroke NIH R01NS097549 and the Georgia Research Alliance.