
Abstract
Experimental murine models are an essential tool in the field of bone marrow (BM) transplantation research. Therefore, numerous mice are required to obtain a sufficient number of BM cells, which is in contrast with the Reduction principle of the 3R principles. The selection of the cell source and the isolation protocol are therefore critical in obtaining a sufficient yield of cells for experiments. Nowadays, the vertebrae are already used as an extra source of BM cells to enrich the number of isolated cells from the long bones and ilia (LBI), when needed. Yet, little is known if BM cells from LBI and vertebrae share the same characteristics and can be pooled together for further analysis. Therefore, in this study, we aimed to compare the quantity and characteristics of haematopoietic and stromal cell lines in the BM from the LBI and vertebrae. To count haematopoietic and mesenchymal stem/stromal progenitors, colony-forming unit assays were performed. To determine the expansion capacity of mesenchymal stem/stromal cells (MSCs), cultivation of MSCs and measurement of the expression of surface markers by flow cytometry was performed. The characterisation and enumeration of immune cell populations was also performed by flow cytometry. Here, we show that the vertebrae are a comparable source of BM cells to the LBI regarding the analysed parameters.
Introduction
The bone marrow (BM) is a dynamic environment where immune and blood cells differentiate from haematopoietic stem and progenitor cells (HSPCs). In mice, BM is found in both long and flat bones (e.g. tibias, femurs, humeri, ilia, ribs and sterna) and in irregular bones (e.g. vertebrae, and sacra), and is the site of haematopoiesis from birth to old age. 1 HSPCs are located in a specialised micro-environment referred to as the BM niche. The highest percentage of HSPCs is found in bone-proximal endosteal regions and closer to blood vessels, while this percentage decreases towards the central bone region.2,3 BM is also the main source of mesenchymal stromal/stem cells (MSCs) which are multipotent adult stromal cells that are able to differentiate into different cell types such as osteoblasts, chondrocytes and adipocytes. 4
Traditionally, the isolation of murine BM cells is performed by the bone flush method, which only involves the use of long bones (femurs, tibias and humeri) and does not provide a sufficient quantity of BM cells when high numbers of cells are needed for research purposes. For this reason, the cells of several animals are often pooled together.5,6 Therefore, an alternative bone crush method was developed to increase the yield of BM cells per mouse. 1 In the bone crush method, any BM-containing bone can be used. 7 In our previous BM transplantation experiments, 8 we showed that the bone crush method is suitable for the isolation of BM cells from the long bones, ilia and vertebrae, and contributes to simply and easily obtaining murine BM cells in great numbers. A comparison between the yield of progenitors in the vertebrae and the long bones and ilia (LBI) has already been made, showing that the vertebrae have a higher progenitor content on a per cell basis over the LBI, 1 but more precise qualitative characterisations comparing the presence of different types of progenitors in both sources of BM cells, as well as immune cell populations and MSCs, have not yet been performed.
To research whether there is a difference in the HSPC and stromal cell composition in these two separate anatomical locations, we checked additional parameters by performing colony-forming unit assays (CFU) to count different types of haematopoietic progenitors (CFU granulocyte/macrophage (CFU-GM), CFU granulocyte/erythroid/macrophage/megakaryocyte (CFU-GEMM) and burst-forming unit erythroid (BFU-E)) as well as mesenchymal stem/stromal progenitors, MSCs culturing in vitro up to passage 2, followed by flow cytometry analyses for the characterisation of different BM immune cell populations.
Animals
BALB/cOla mice (9–15 weeks old) were kept under specific pathogen-free conditions at the animal facility of the National Institute of Chemistry (Ljubljana, Slovenia). The mice were housed on a 12-hour/12-hour light/dark cycle in standard group cages (five per cage) with ad libitum access to food and water. In total, six animals (Three male, three female) were used. The use of their tissues was approved by the Ethical Committee for Laboratory Animals of the Republic of Slovenia (no. U34401-27/2013/13) by the Administration of the Republic of Slovenia for Food Safety, Veterinary and Plant Protection.
Methods
BM cell isolation
The mice were sacrificed using CO2 asphyxiation followed by cervical dislocation. Femurs, tibias, humeri ilia and vertebrae were dissected and thoroughly cleaned. The bones were crushed in a separate mortar with a pestle in a cold medium (RPMI-1640 medium; Gibco, Grand Island, NY), 25 mM HEPES (Gibco), 300 mg/L
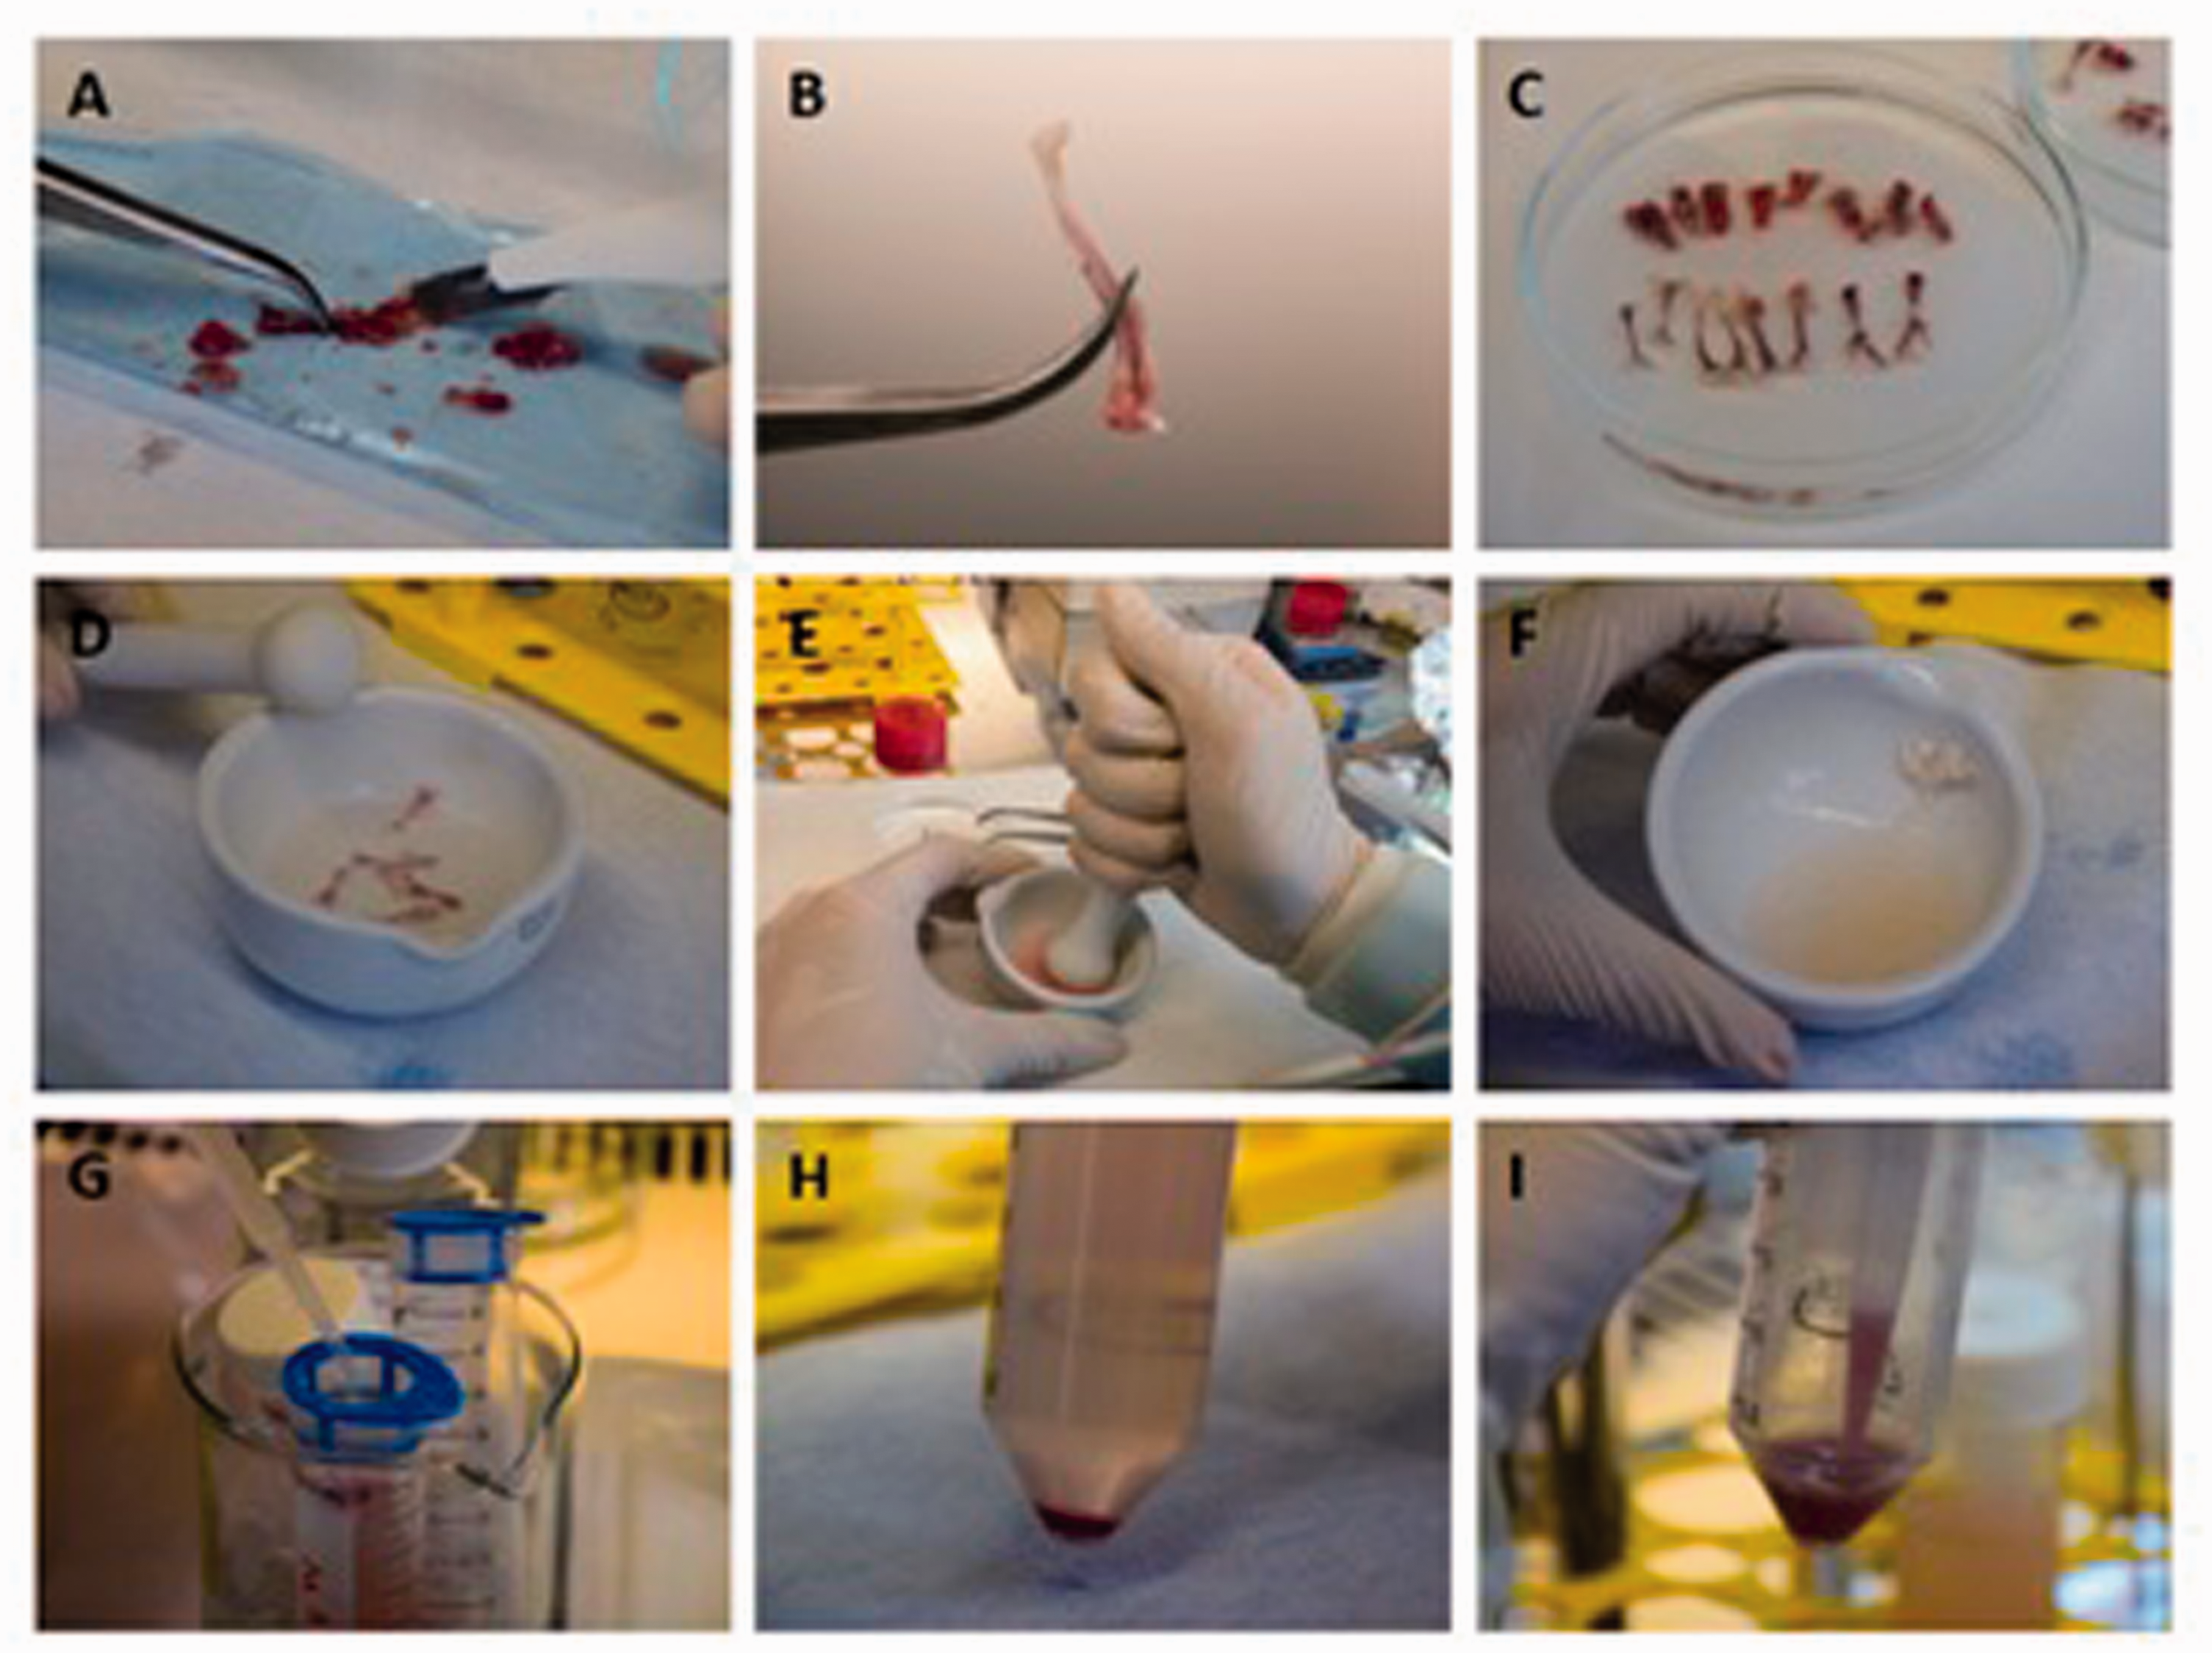
Protocol for BM cell isolation. (a) Removal of the muscles and connective tissue from the bones. (b) The appearance of the tibia after cleaning. (c) Cleaned LBI and vertebrae in RPMI+ and (d) their transfer into a sterile mortar. (e) Crushing the bones for BM cell isolation. (f) The appearance of the BM cell suspension after the bones have been crushed. (g) Filtration of the cell suspension through a 40 µm cell strainer. (h) The appearance of the cells after centrifugation. (i) Re-suspending the cell pellet before proceeding. BM: bone marrow; LBI: long bones and ilia.
CFU assays
A CFU assay is a clonal assay used for the enumeration of progenitor cells. In our study, two types of CFU assays were performed. A CFU-H assay was used to count different types of multipotent (CFU-GM and CFU-GEMM) and lineage restricted (BFU-E) haematopoietic progenitors, while a CFU-F assay was used to count mesenchymal stem/stromal progenitors.
For the CFU-H assay, BM cells from the LBI and vertebrae were separately seeded in semi-solid mouse MethoCult medium (GF 03434; Stem Cell Technologies). Cells were plated in duplicate at 18,000 cells per 35 mm Petri dish. After 12 days, the following haematopoietic colonies were counted: (a) CFU-GM, (b) CFU-GEMM and (c) BFU-E.
For the CFU-F assay, BM cells from the LBI and vertebrae were separately seeded in complete MesenCult medium supplemented with MesenPure (Stem Cell Technologies). Cells were plated in duplicate at 1.2 × 10⁶ and 3.6 × 10⁶ cells per 35 mm Petri dish and cultured at 5% O2 for 12 days. Colonies were fixed with 4% formalin for 10 minutes, washed with dH2O and stained with crystal violet. Colonies were counted semi-quantitatively.
MSC expansion
From the total number of BM cells from the vertebrae and LBI separately seeded in a T25 culture flask, MSCs were isolated based on their attachment to the bottom of the flasks. Briefly, 30 × 106 BM cells were seeded in a T25 flask. MSCs were cultured at 5% O2, 5% CO2 and 37°C in the MesenCult medium supplemented with MesenPure (Stem Cell Technologies). The medium was removed after 24 hours, cells were gently washed with Dulbecco’s phosphate buffered saline to remove the non-attached cells and fresh medium was added. The medium was then changed twice a week, and MSCs were trypsinised when 70–80% confluence was reached. After trypsinisation, the cells were seeded at 15,000 MSC/cm2 for further expansion. Cells were cultured up to passage 2.
Flow cytometry
Isolated BM cells from LBI and vertebrae were separately stained with the appropriate combination of antibodies and incubated at 4°C in the dark for 15 minutes. Then, red blood cell (RBC) lysis was performed with PharmLyse buffer (BD Biosciences, Franklin Lakes, NJ) for three minutes at room temperature, followed by the washing procedure. MSCs were stained without RBC lysis. The appropriate flow cytometry controls were applied throughout the analysis, which included the use of unstained controls, fluorescence minus one controls and the addition of Fc block (Miltenyi Biotech, Bergisch Gladbach, Germany) to prevent non-specific antibody binding. Cells were analysed immediately after staining with FACSAria IIu (BD Biosciences).
The expression of MSC surface markers was analysed through passages 0 to 2 using the following antibodies: anti-CD45, anti-CD73, anti-CD105, anti-CD29 and anti-CD44 (Supplemental Table S1). The percentages of CD73, CD105, CD29 and CD44 were calculated according to live CD45– cell populations. Gating strategies are shown in Supplemental Figure S1.
In freshly isolated BM cells from the LBI and vertebrae, the following immune cell populations were analysed: B cells, prepro B cells, pre B cells, pro B cells, immature B cells, mature B cells, T cells, effector CD4 T cells, central memory CD4 T cells, effector CD8 T cells, central memory CD8 T cells, monocytes (inflammatory and non-inflammatory monocytes) and neutrophils (Table 1). The percentages of T cells and B cells were calculated per live single cells, the developmental stages of B cells were calculated per B220+ cells, effector and central memory CD4 T cells were calculated per CD3+CD4+ cells, effector and central memory CD8 T cells were calculated per CD3+CD8+ cells, the percentage of monocytes was calculated per live single cells, the inflammatory and non-inflammatory monocytes were calculated per monocytes and neutrophils per live single cells. The antibodies used are shown in Supplemental Table S2, and gating strategies are shown in Supplemental Figure S2.
Cellular surface markers for identification of different immune cell subpopulations in BM from vertebrae and LBI.
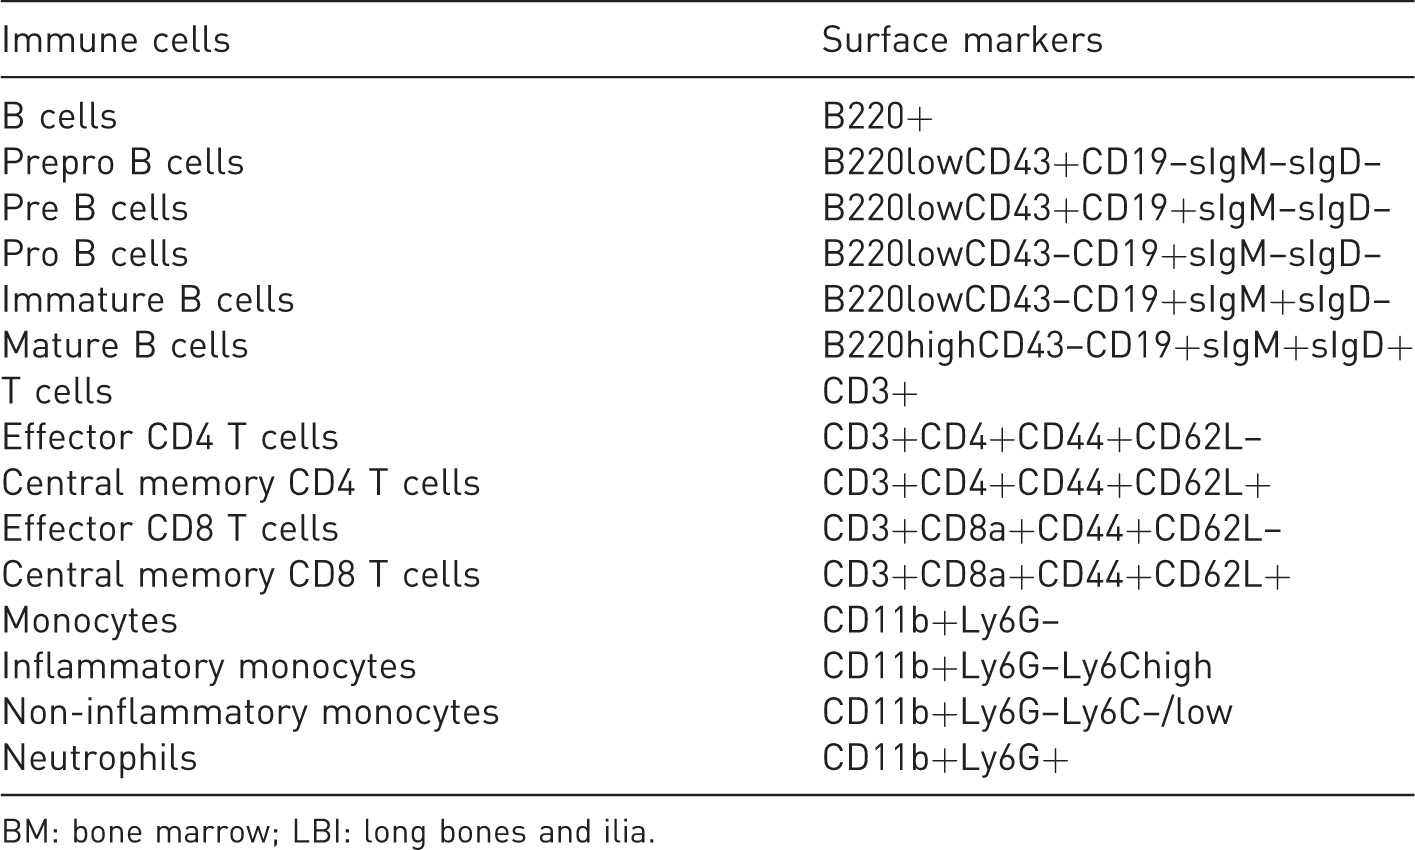
BM: bone marrow; LBI: long bones and ilia.
Statistical analysis
Colonies of progenitor cells are presented as average count or percentage ± standard deviation. Differences between progenitors isolated from the vertebrae and from the LBI were analysed using a paired t-test. p-Values of <0.05 were considered statistically significant. For our analysis of the expression of MSC markers through passages depending on the source of BM cells, two-way repeated measures analysis of variance was used. p-Values of <0.05 were considered statistically significant. Differences in immune cell populations of BM cells isolated from the vertebrae and from the LBI were analysed using a paired t-test. p-Values of <0.05 were considered statistically significant. IBM SPSS Statistics for Windows v19 (IBM Corp., Armonk, NY) was used for the analysis.
Results
Isolation of BM cells
With the bone crush isolation protocol, 102 ± 36 million BM nucleated cells from LBI and 73.6 ± 11 million BM nucleated cells from vertebrae were collected (Figure 2). The isolated suspension of BM cells contained approximately 40% of RBCs as measured with flow cytometry using Ter-119 marker (data not shown). In our study, we excluded the RBCs from the analysis.
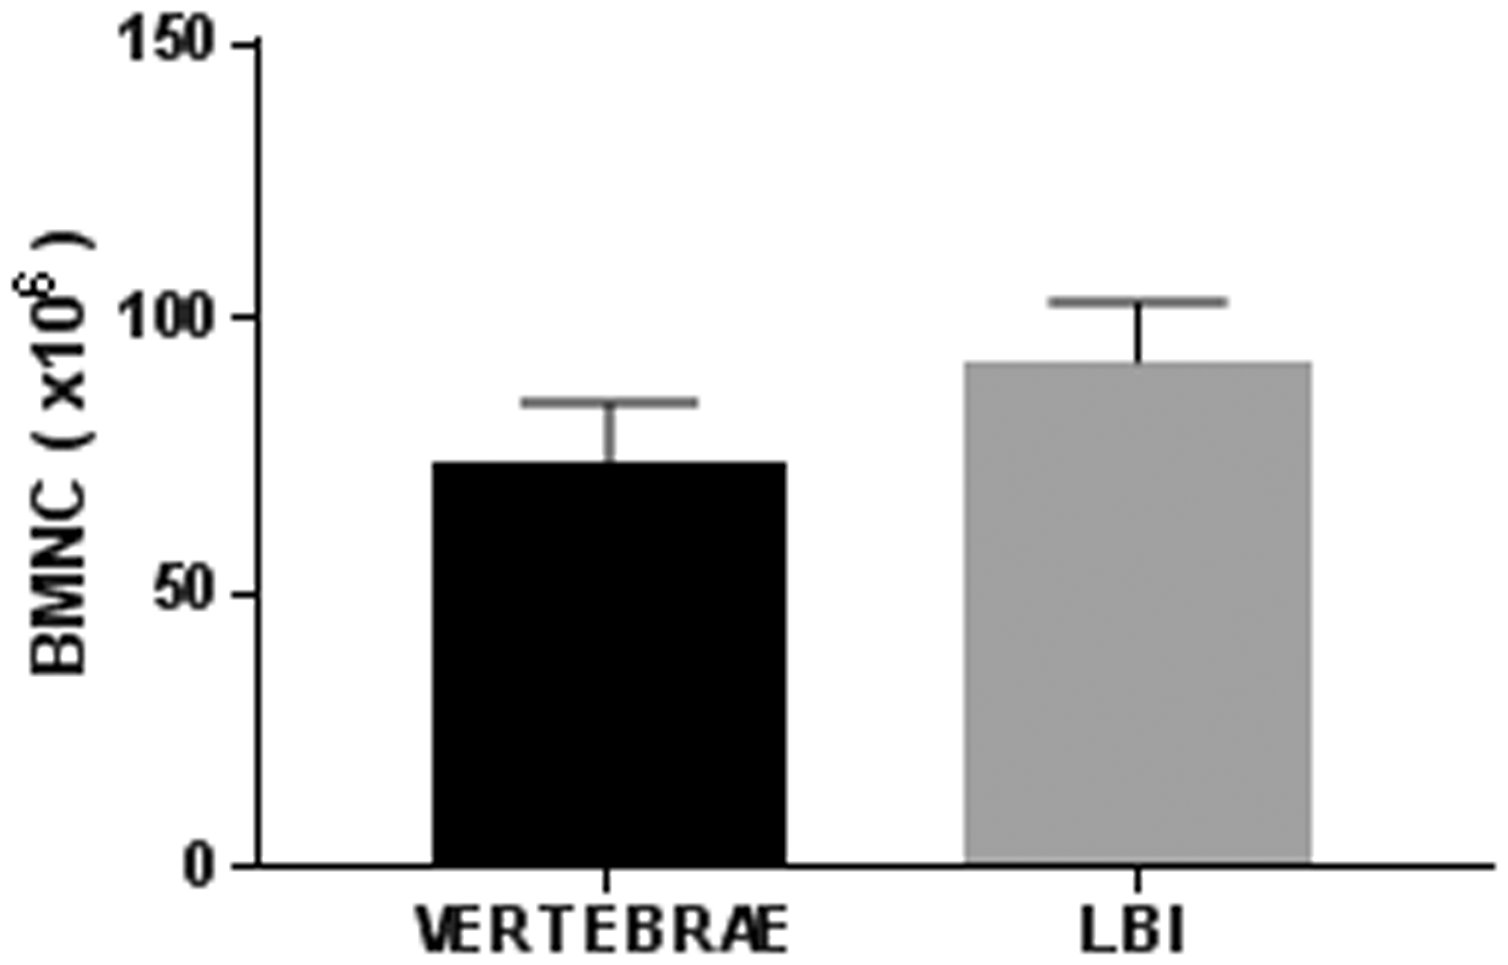
The number of BMNCs isolated from the vertebrae and LBI. The results shown are the average and SD of six mice. BMNCs: BM nucleated cells; SD: standard deviation.
After 12 days of culturing the fibroblast colonies (CFU-F), they were stained with crystal violet and counted (Figure 3(a)). In the BM cell suspension isolated from the LBI and from the vertebrae, 0.0020 ± 0.0004% and 0.0028 ± 0.0008% CFU-F were present, respectively. The LBI-derived crush suspension contained 2031 ± 591 CFU-F, while the vertebrae crush suspension contained 1973 ± 296 CFU-F. There was no statistical difference in the numbers of mesenchymal stem/stromal progenitors isolated from the LBI and from the vertebrae (Figure 3(b)). The number of progenitors calculated per whole mouse (the LBI and vertebrae together) represented 4004 ± 656 of CFU-F (Figure 3(b)). The number of CFU-F per 106 BM nucleated cells (BMNCs) was higher in the cells isolated from vertebrae, but the difference was not statistically significant (Figure 3(c)).
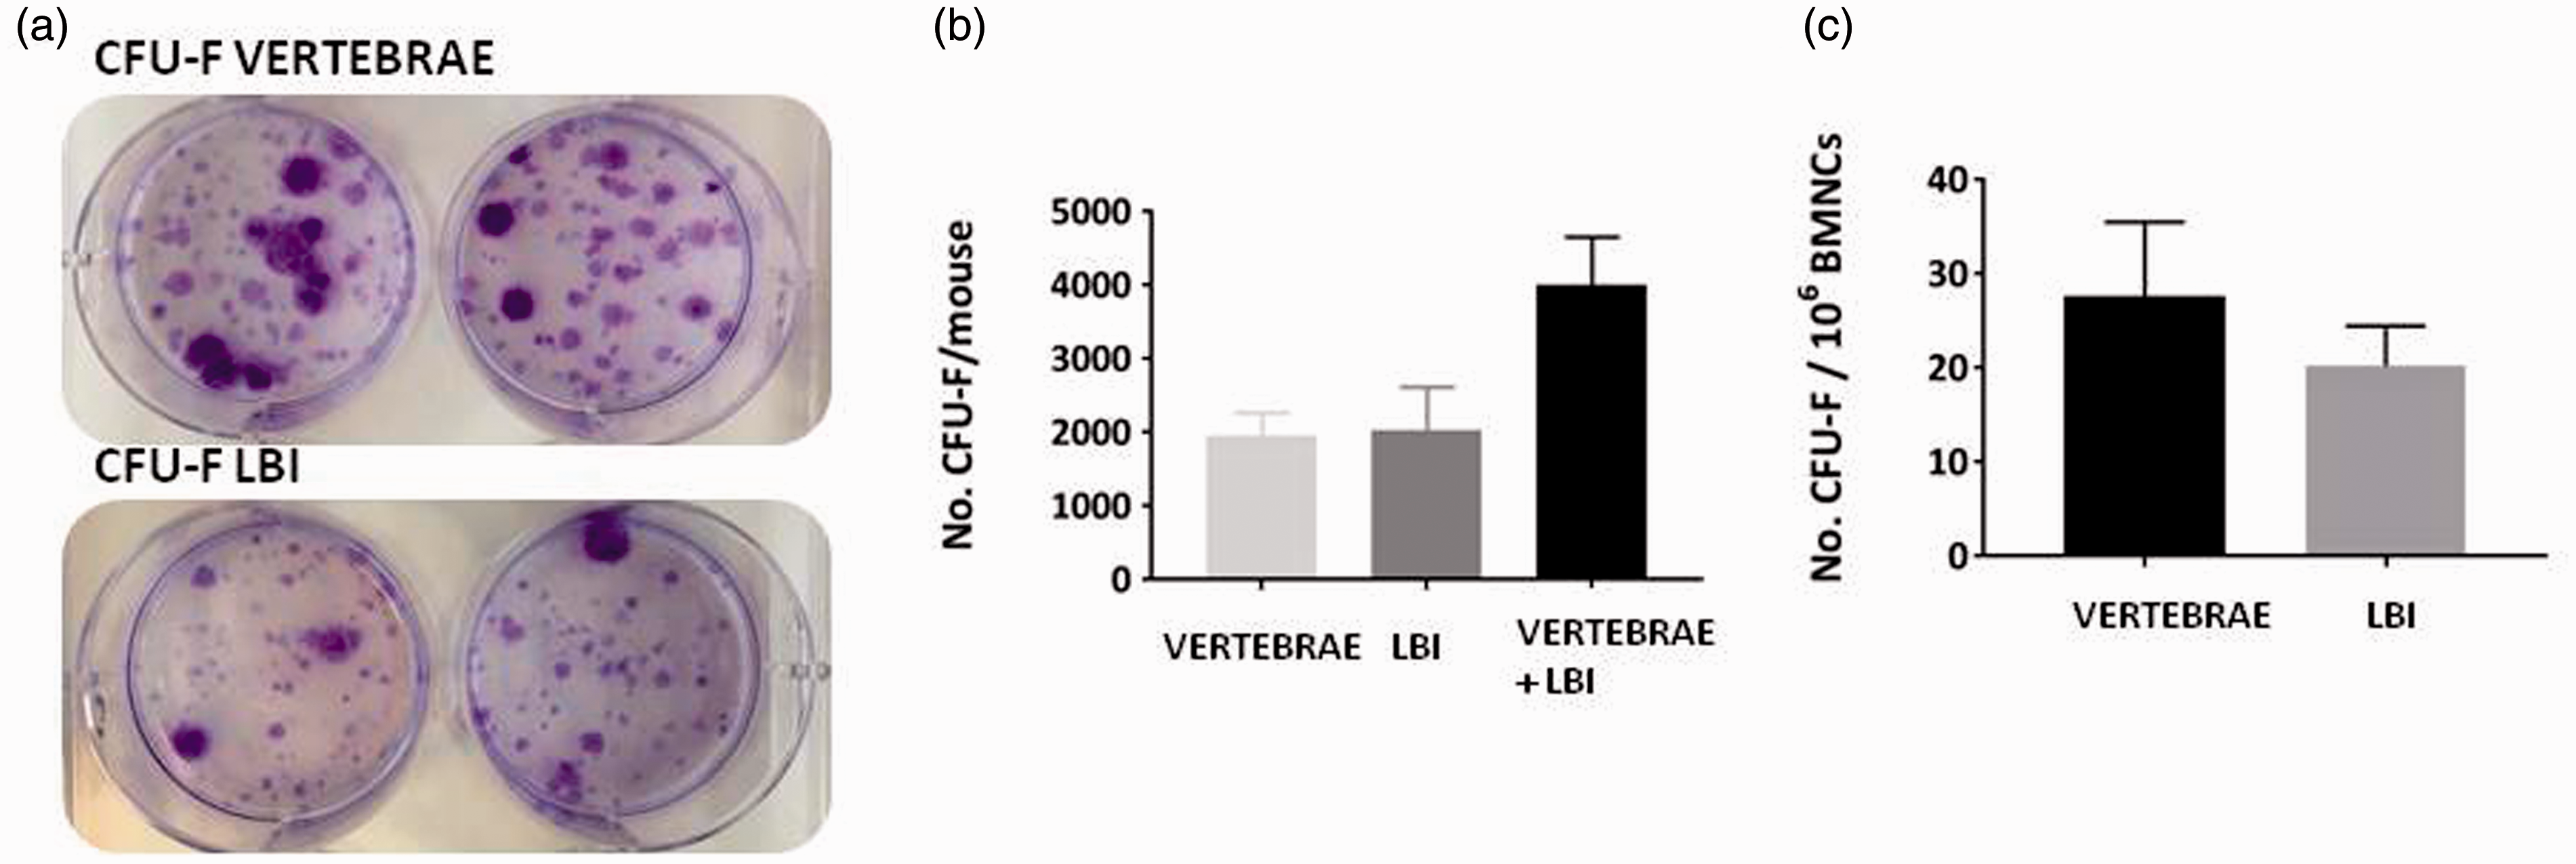
Analysis of CFU-F from BM cells isolated from vertebrae and LBI. CFU-F from BM cells isolated from vertebrae and LBI stained with crystal violet (a). Average number of CFU-F progenitors counted in vertebrae and LBI and the sum per whole mouse (b). Average number of CFU-F progenitors in BM cells from vertebrae and LBI per 1 × 10⁶ BMNCs (c). The results shown are the average and SD of six mice. CFU-F: fibroblastic colony-forming unit.
In the CFU-H assay, 0.32 ± 0.09% and 0.36 ±0.08% colonies were present in BM cells isolated from the LBI and from the vertebrae, respectively. The LBI-derived crush suspension contained 271,432 ± 85,727 CFU-H progenitors, while the vertebrae crush suspension contained 220,006 ± 57,519 CFU-H progenitors. There was no statistical difference in the number of haematopoietic progenitors isolated from the LBI and from the vertebrae (Figure 4(a)). When the number of progenitors was calculated per whole mouse (the LBI and vertebrae together), this represented 419,439 ± 121,115 CFU-H progenitors (Figure 4(a)). The number of CFU-H per 106 BMNCs was higher in cells isolated from vertebrae, but the difference was not statistically significant (Figure 4(b)). We also analysed the types of haematopoietic colonies (Figure 4(c)). In LBI, CFU-GM represented 70 ± 8%, BFU-E 19 ± 3% and CFU-GEMM 11 ± 4%, while in the vertebrae, CFU-GM represented 68 ± 5%, BFU-E 23 ± 4% and CFU-GEMM 9 ± 2%. We did not observe significant differences between the two sources of BM cells.
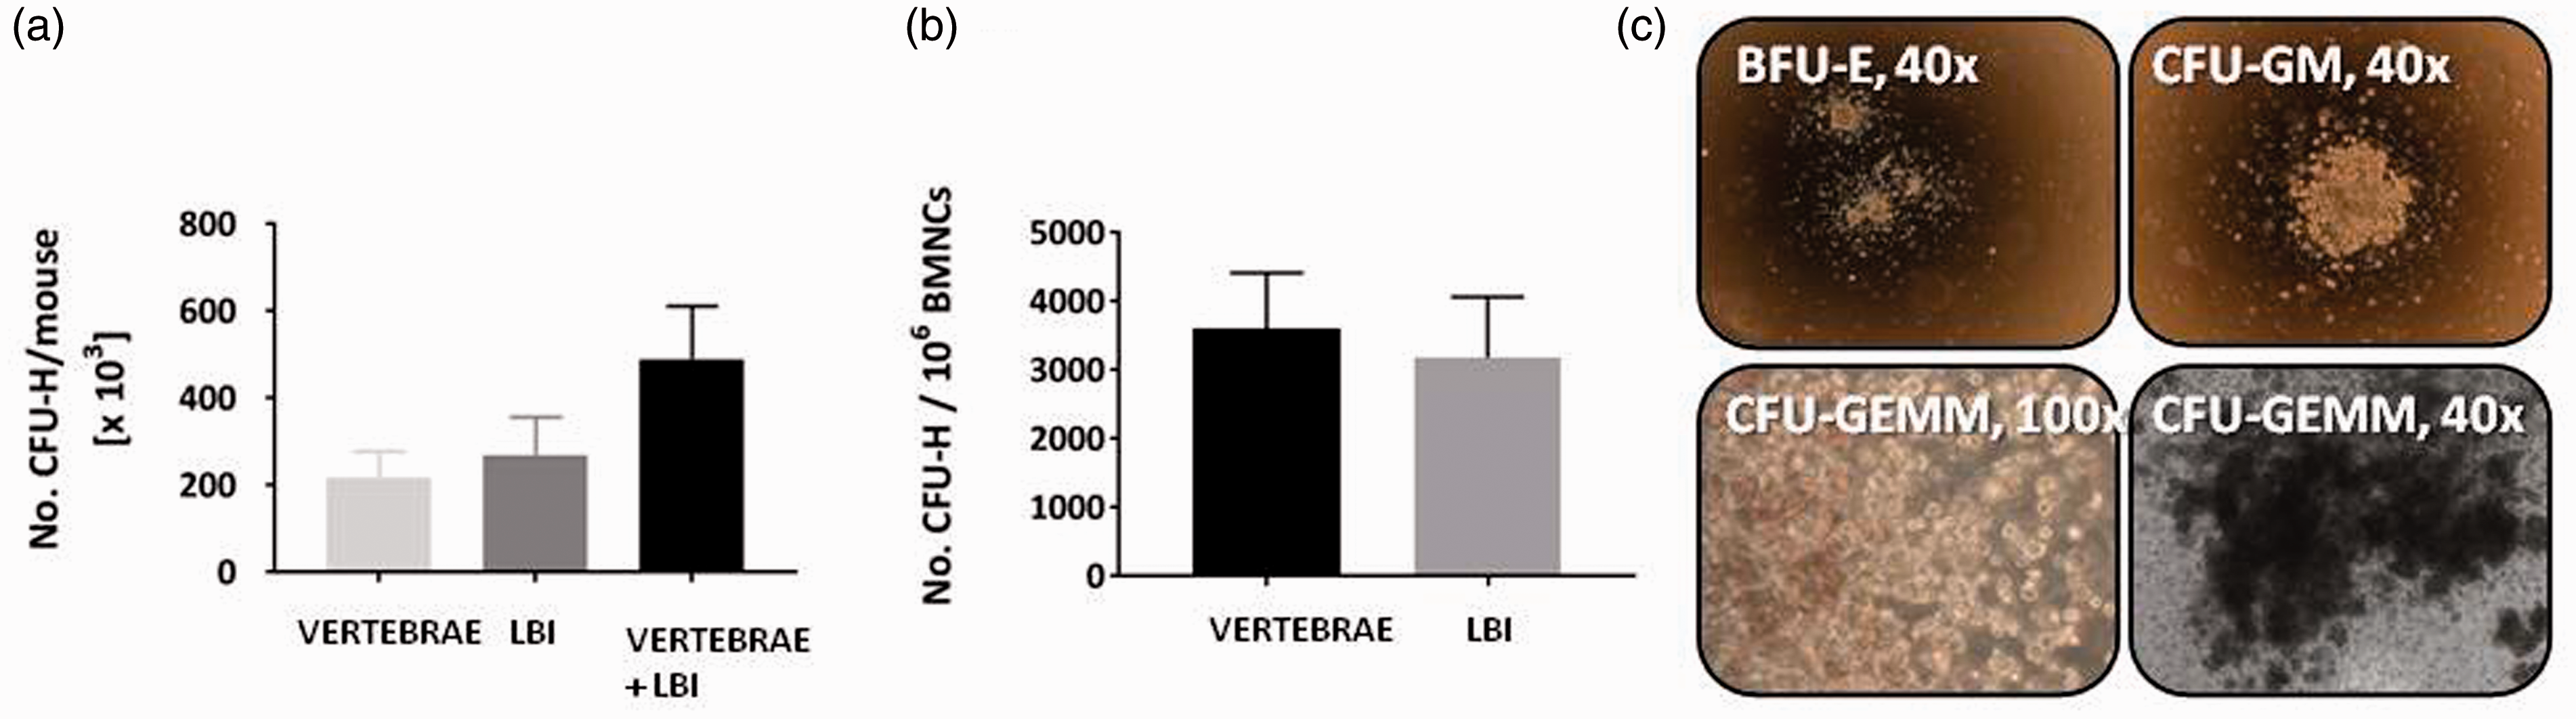
Analysis of CFU-H from BM cells isolated from vertebrae and LBI. Average number of CFU-H progenitors counted in vertebrae and LBI and the sum per whole mouse (a). Average number of CFU-H progenitors in BM cells from vertebrae and LBI per 1 × 10⁶ BMNCs (b). The results shown are the average and SD of six mice. All three types of CFU-H were present in BM cells from vertebrae and LBI (c). CFU-H: haematopoietic colony-forming units.
MSC expansion
The MSCs from LBI and MSCs from vertebrae were cultured up to passage 2. We were able to obtain MSC cultures from both sources with >90% CD45– cells in passage 1.
Although MSCs from the vertebrae seemed to grow better and had better morphology than MSCs from the LBI (Figure 5(a)), the difference in the percentages of CD45– and other CD markers through passages between both sources was not statistically significant (Table 2). CD45– cells were further analysed for CD29, CD44, CD73 and CD105 from passage 0 to passage 2 with flow cytometry. CD29 and CD44 were homogenously expressed through all the passages in both MSCs from the LBI and MSCs from vertebrae. The difference in the percentage of CD29 and CD44 cells through passages between both sources was not statistically significant. However, the expression of CD73 and CD105 was quite heterogeneous, but the difference in their proportions through passages between both sources was not statistically significant (Figure 5(b) and Table 2).
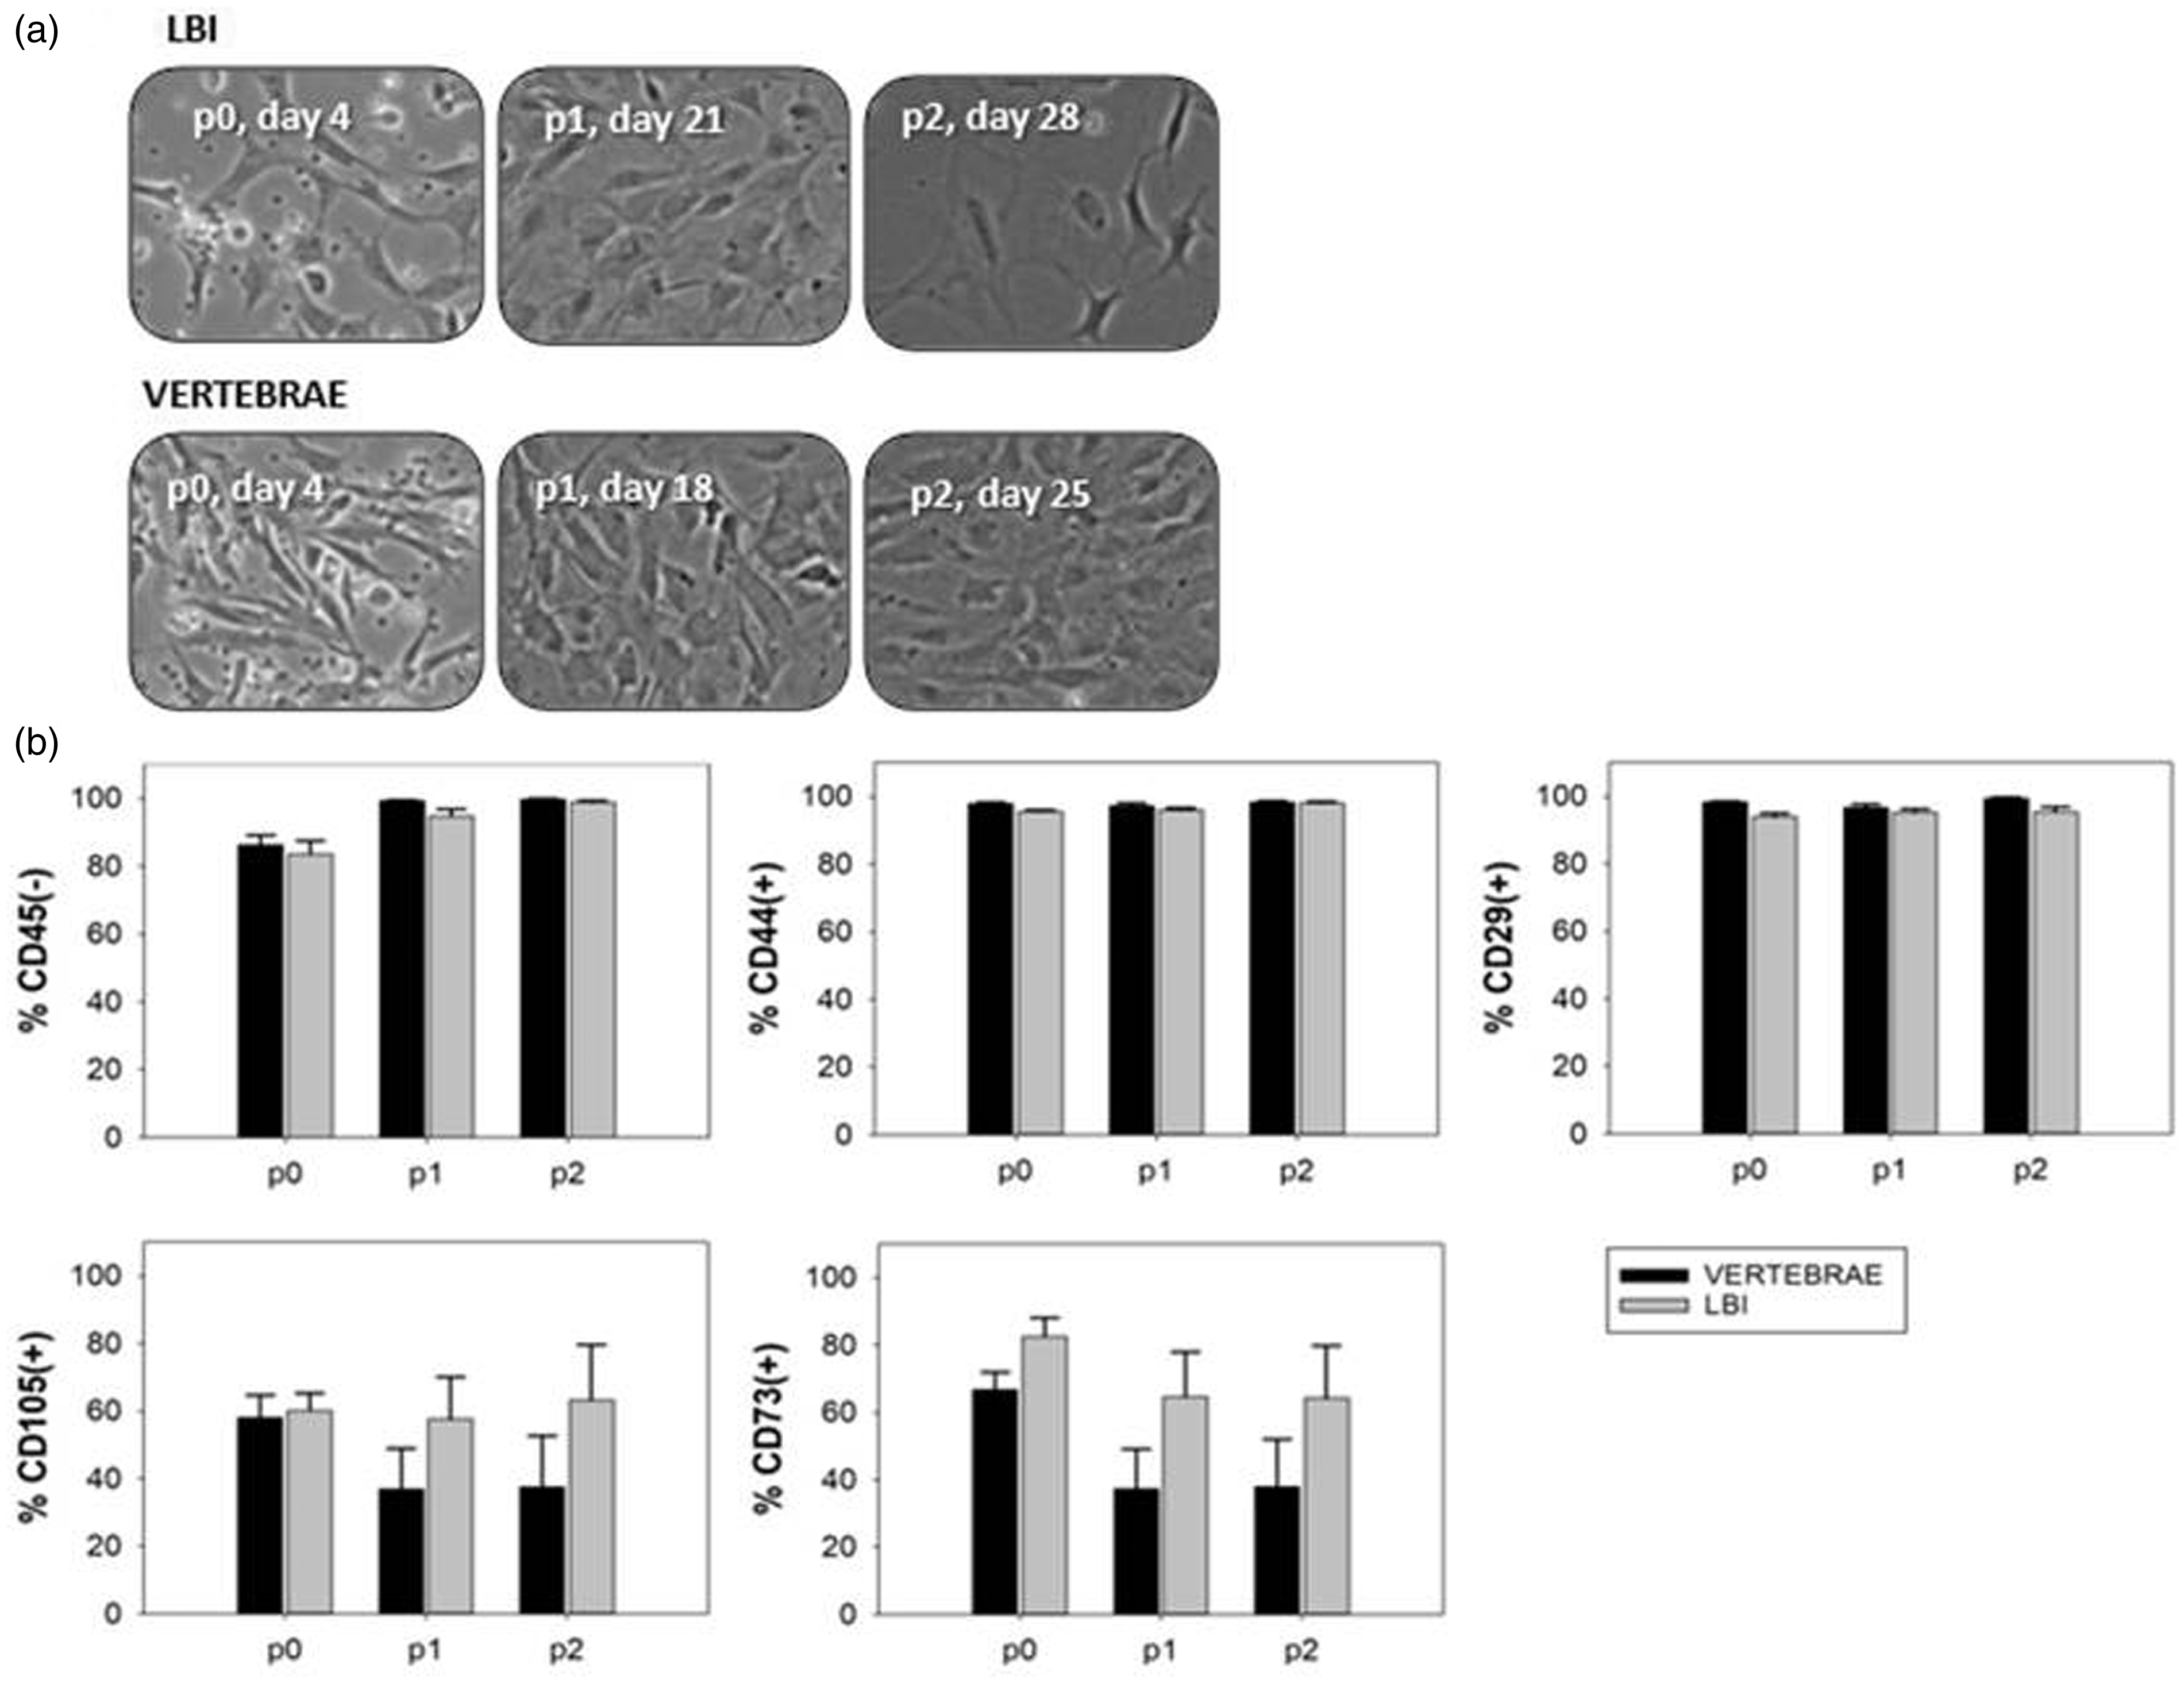
MSCs analysis. Phase contrast images taken before trypsinization of mouse MSCs through passage 0 to passage 2 (a) and the expression of markers on cultured MSCs from passage 0 to passage 2 (n=6) (b). MSCs: mesenchymal stem/stromal cells; p: passage; (–): negative; (+): positive.
Mesenchymal stem/stromal cell markers and percentages of live CD45- cells through passages 0 to 2: CD29, CD105, CD44 and CD73 percentages are calculated according to live CD45– populations.
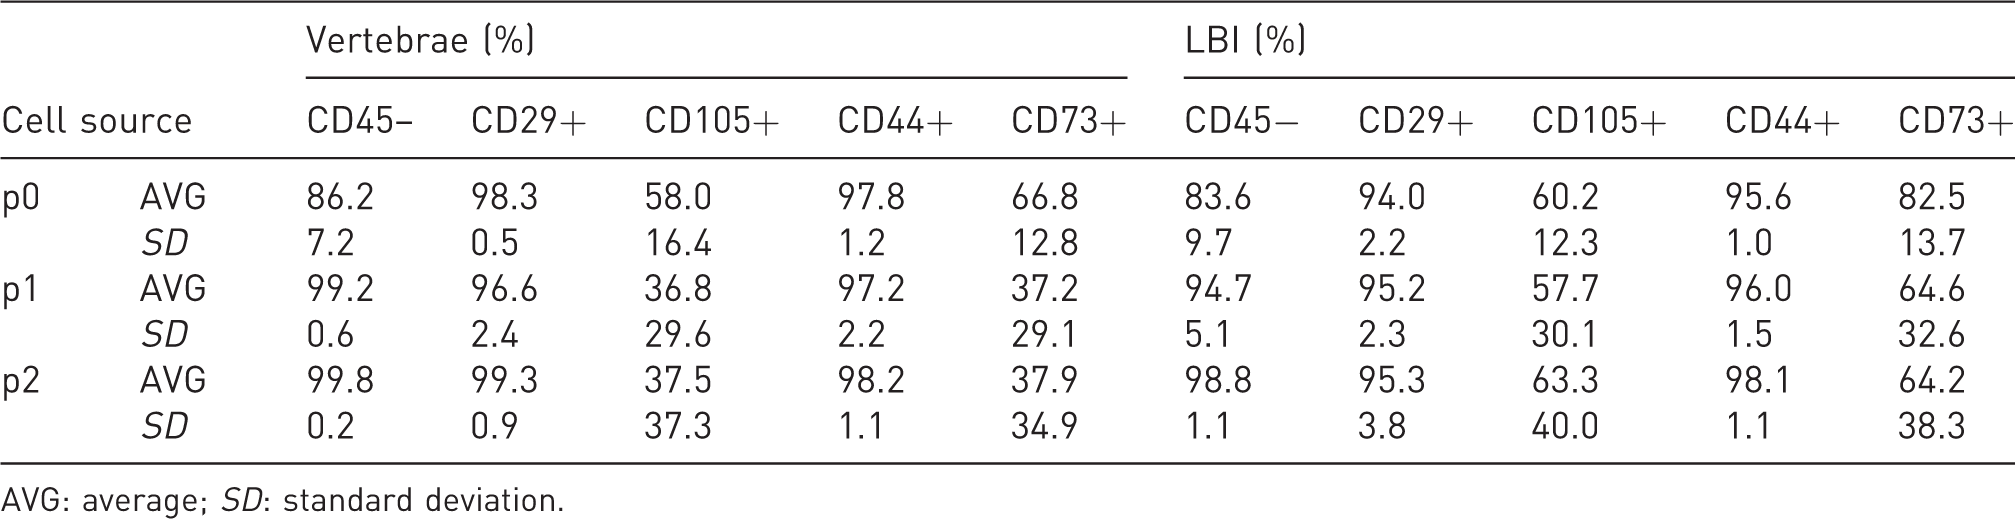
AVG: average; SD: standard deviation.
Immune cell population analysis
In isolated BM cells from the LBI and vertebrae, different immune cell populations were analysed by flow cytometry: B cells, various stages of maturation of B cells (prepro B, pre B, pro B, immature B and mature B cells), T cells, effector and central memory CD4 T cells, effector and central memory CD8 T cells, monocytes (classified into inflammatory and non-inflammatory monocytes) and neutrophils. The difference in percentages of all analysed immune cells in the BM from vertebrae and LBI was not statistically significant (Tables 3 and 4).
Percentages of lymphoid cells in the BM cells from vertebrae and LBI (average and standard deviation).
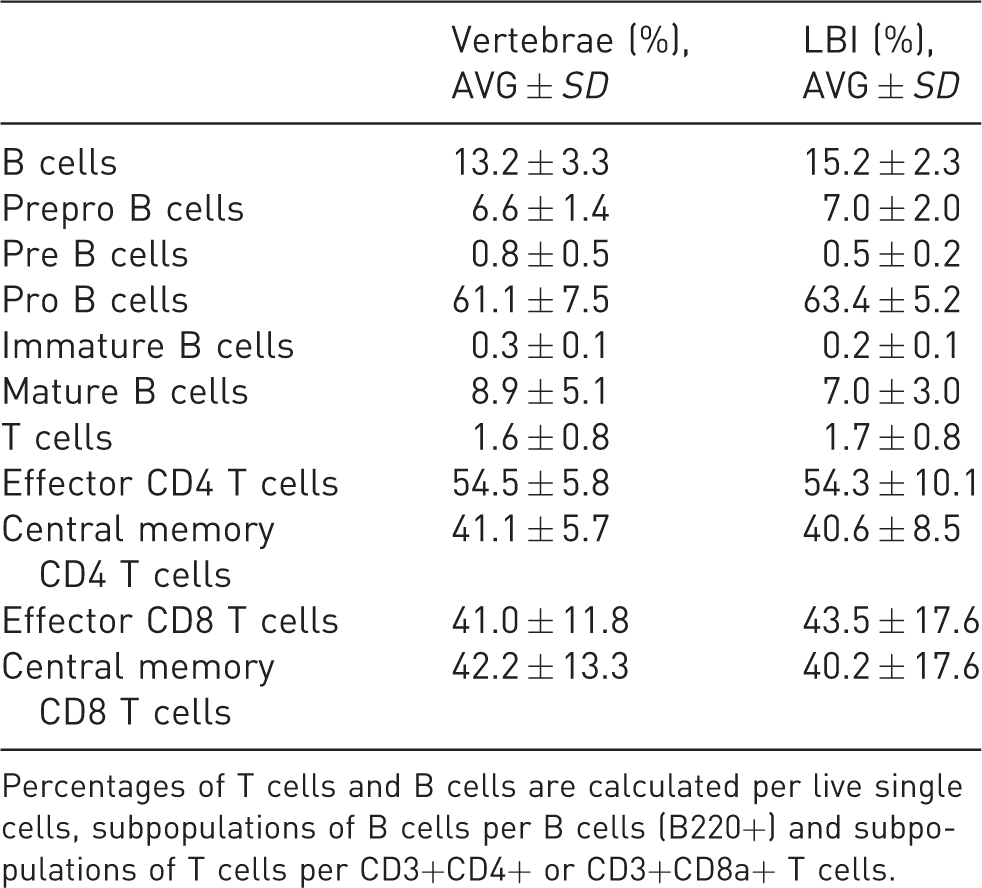
Percentages of T cells and B cells are calculated per live single cells, subpopulations of B cells per B cells (B220+) and subpopulations of T cells per CD3+CD4+ or CD3+CD8a+ T cells.
Percentages of myeloid cells in the BM cells from vertebrae and LBI (average and standard deviation).
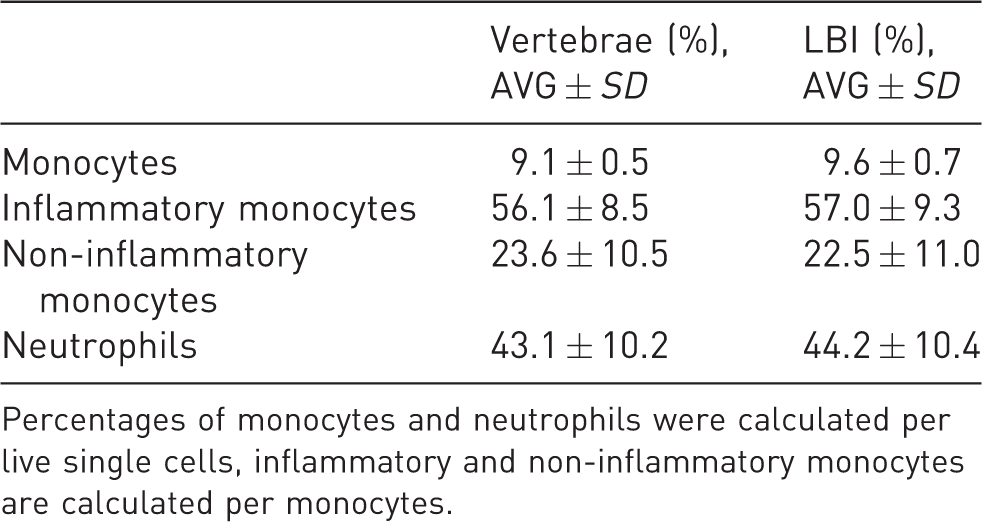
Percentages of monocytes and neutrophils were calculated per live single cells, inflammatory and non-inflammatory monocytes are calculated per monocytes.
Discussion
The aim of our study was to determine if vertebrae are a comparable source of BM cells to the traditionally used LBI, that is, whether the BM of vertebrae harbours a different set of HSPC and MSC subpopulations. BM is the main site of haematopoiesis. It contains haematopoietic stem cells which can give rise to myeloid and lymphoid progenitors. It also contains stromal cells and their progenitors. When doing research on mice, high numbers of haematopoietic and mesenchymal progenitors, as well as immune cells, are often required. The choice of the cell source and the isolation protocol is therefore extremely important in obtaining a satisfactory yield in the above-mentioned experiments. However, we must also take into consideration current standards and 3R principles, more specifically, a reduction in numbers of laboratory animals. We can minimise the number of mice used by applying the bone crush isolation protocol and using additional bones such as vertebrae, but it remains unknown if the percentages of immune cell populations and haematopoietic as well as mesenchymal progenitors are the same in BM cells from vertebrae and LBI. Here, we performed a comparative analysis of the yield of BM cells from both sources, the percentage of different progenitor types, the immune cell populations and the in vitro expansion capacity of the MSCs derived from BM cells of both sources.
Using the bone crush isolation protocol, we obtained 102 ± 36 million BM nucleated cells from LBI and 73.6 ± 11 million BM nucleated cells from vertebrae, which is in line with other studies. 1 Therefore, with this isolation protocol, we can almost double the number of isolated BM cells per mice. The percentage of RBCs in isolated BM cells did not differ between BM cells isolated from LBI and vertebrae. In the published literature, it is rarely evident whether RBC lysis was performed after the isolation of BM cells, or if the RBCs were excluded from counting. In our study, the RBCs were excluded from further analysis.
To gain insight into the frequency of haematopoietic progenitor cells and make a comparison between the BM cells isolated from LBI and vertebrae, we used the CFU-H in vitro assay and counted the multipotent haematopoietic progenitors (CFU-GM, CFU-GEMM) and the lineage restricted haematopoietic progenitors (BFU-E). CFU-GM were colourless and consisted of round and oval cells, which represented the granulocytes and macrophages, respectively. CFU-GEMM represented the biggest colonies in the dish and consisted of reddish-coloured erythroid cells that were mixed with the colourless granulocytes, macrophages and megakaryocytes. BFU-E consisted of tiny, irregular shaped cells fused in small clusters.
The percentage and ratio of the above-mentioned colonies was similar in the LBI and vertebrae. CFU-GM were the most frequent colonies in the dishes, followed by BFU-E, and CFU-GEMM. The overall number of haematopoietic progenitors was 271,432 ±85,727 and 220,006 ± 57,519 CFU-H in the total BM cells from LBI and vertebrae, respectively. Even though the number of the total haematopoietic progenitors was higher in LBI, the number of haematopoietic progenitors was higher in the vertebrae when calculated per 106 BMNCS, but there was no statistical difference observed. This is in agreement with other published data, showing a higher content of haematopoietic progenitors in vertebrae. 1
Furthermore, we compared the stromal cell line in LBI and vertebrae by determining the number of mesenchymal stem/stromal progenitors with the CFU-F assay and in vitro MSC expansion capacity. Regarding the CFU-F results, we observed the same pattern as when comparing the haematopoietic progenitors. The total number of mesenchymal stem/stromal progenitors was higher in LBI (2031 ± 591) than in vertebrae (1973 ± 296). However, when calculated per 106 BMNCs, the number of mesenchymal stem/stromal progenitors was higher in vertebrae.
The in vitro MSC expansion capacity was of great interest to us, since there have been numerous attempts by many authors to create a standardised method for the isolation and expansion of murine MSCs. However, obtaining a homogenous population of large numbers of MSCs is still challenging. Slow growth and contamination by various blood cells are the main problems with murine MSC cultures. 9 Therefore, plating large initial culture numbers under proper conditions is essential. The presented bone crush isolation protocol yields enough cells from one mouse for the successful expansion of MSCs. In the past, many researchers pooled the cells of several mice to obtain sufficient numbers of cells for cell plating, and this can now be avoided. On passages 0, 1 and 2, the expression of MSC markers was determined by flow cytometry. The absence of CD45 on our cultured cells showed a high level of purity of MSCs: more that 90% and 98% of cultured MSCs from LBI and vertebrae were CD45– in passage 1 and passage 2, respectively. CD45– cells were further analysed for CD29, CD44, CD73 and CD105. CD29 and CD44 were homogeneously expressed through all the passages in both MSCs from LBI and vertebrae. These results correspond with other studies that have characterised MSCs.10–12 However, the expression of CD105 and CD73 was quite heterogeneous in both LBI and vertebrae. While some researchers have reported that expression of CD73 and CD105 on MSCs increases during consecutive passages,13,14 others detected the presence of many of these cells in freshly isolated BM10. It has also been shown that the expression of CD73 and CD105 depends on the source of MSCs and their differentiation potential. 14 The level of expression can also be strain dependent. 12 However, there are hardly any data about the immunophenotype of the in vitro cultured MSCs from LBI and vertebrae. Our research indicates that MSCs from LBI and vertebrae are comparable to each other in terms of numbers and phenotype, and hence MSCs from vertebrae can be used as an additional source of MSCs. However, further functional tests are required to confirm their equal developmental potential.
The analysis of the following immune cell populations in two anatomically separate locations (vertebrae and LBI) was performed: (a) the lymphoid lineage (B cells, various stages of maturation of B cells, T cells, effector and central memory CD4 T cells, effector and central memory CD8 T cells) and (b) myeloid lineage (inflammatory and non-inflammatory monocytes and neutrophils). As seen in Tables 3 and 4, there was no significant difference in either lymphoid or myeloid lineage in BM cells from the vertebrae and LBI.
Conclusion
In summary, in an effort to respect the Reduction principle of the 3R principles, we compared the BM cells from LBI and vertebrae and investigated if they shared the same characteristics, which would allow us to pool these cells together for further analysis. Our results show that BM cells from LBI and vertebrae did not differ in the number of haematopoietic and mesenchymal stem/stromal progenitors and in the expression of MSCs surface markers through passages. However, MSCs from vertebrae expanded faster than MSCs from LBI when cultured in vitro, showing a higher proliferation potential. Furthermore, we did not observe a statistical difference in the analysis of lymphoid and myeloid cell populations in the BM from LBI and vertebrae. Here, we demonstrate that vertebrae could be used as an additional source of BM cells, equivalent to the BM from LBI, which consequently doubles the yield of isolated BM cells and halves the number of mice needed for each experiment.
Supplemental Material
sj-pdf-1-lan-10.1177_0023677220922573 - Supplemental material for Application of the 3R principles: Vertebrae as an additional source of murine bone-marrow cells
Supplemental material, sj-pdf-1-lan-10.1177_0023677220922573 for Application of the 3R principles: Vertebrae as an additional source of murine bone-marrow cells by Mojca Justin, Mojca Jež, Andrej Košir, Simona Miceska, Primož Rožman and Katerina Jazbec in Laboratory Animals
Footnotes
Acknowledgements
We would like to express our gratitude to Duško Lainšček from the National Institute of Chemistry (Ljubljana, Slovenia) for kindly providing the mice.
Declaration of Conflicting Interests
The author(s) declared no potential conflicts of interest with respect to the research, authorship and/or publication of this article.
Funding
The author(s) disclosed receipt of the following financial support for the research, authorship and/or publication of this article: This work was supported by the Slovenian Research Agency (Grant No. P3-0371).
Supplemental material
Supplemental material for this article is available online.
References
Supplementary Material
Please find the following supplemental material available below.
For Open Access articles published under a Creative Commons License, all supplemental material carries the same license as the article it is associated with.
For non-Open Access articles published, all supplemental material carries a non-exclusive license, and permission requests for re-use of supplemental material or any part of supplemental material shall be sent directly to the copyright owner as specified in the copyright notice associated with the article.