
Abstract
Abstract
Changes in bone mineral content of calcium (Ca), phosphorous (P), magnesium and potassium for male and female Wistar rats during their development from 3 weeks old to adulthood (27 weeks old) were measured. Bone mineral content was related to areal bone mineral density (BMD) which was measured in vivo at the femoral neck using a calibrated X-ray transmission system to obtain basal curves as a function of the age of the specimen. Diagnostic curves were built to determine low BMD (osteopaenia) and osteoporosis in female rats fed a Ca-depleted diet (50%) based on the obtained data and the criteria established by the World Health Organization. Bone mineral content is directly related to sex and age, but P did not change throughout the experimental period. P content did not exhibit significant changes with growing, while Ca was greatest in male rats, producing significant differences in the Ca:P ratio. Male rats reach the Ca:P ratio peak before female rats. However, areal BMD does not follow the same trend. On the other hand, osteoporosis produced a 45% decrease in this parameter for young and mature adults. These results make Z-score values available to diagnose bone-mass losses and hence the possibility of improving the conditions of non-contact measurement of BMD in vivo. This technique can be used for future experiments with Wistar rats.
Introduction
Areal and volumetric bone mineral density (BMD) are the most used parameters to determine bone-mass loss or gain for biological experiments and diagnosing bone diseases to establish skeletal integrity and to measure bone quantity, 1 and rats are the conventional model for that because of their similarity with humans.2–4 These parameters also allow the mineral and salt content in the bone to be determined per unit of area. 5 BMD changes according to breed, sex, age, diet, diseases, habits and the pathogenic stage of the bone.6,7 Therefore, the determination of areal BMD (aBMD) as a function of the age (basal curves) is fundamental to establish different disease models.
Measurement of aBMD has been carried out by techniques such as dual photon absorptiometry, quantitative computed scanning tomography, ultrasound and dual X-ray absorptiometry (DXA), the latter of which is widely used to measure BMD in humans. It applies a calibration process of the system using phantoms, which are commonly made of hydroxyapatite (HAp) with the L1–L4 lumbar vertebrae shape. 3 Finally, the experimental data for diagnosis are compared with standard curves.
For estimation of aBMD for small species, some DXA systems have additional software, but there are problems related to the amount of radiation, calibration and collimation of the X-ray beam. Today, computer technologies, medical imaging and manufacturing techniques have contributed to these advances and have created new possibilities to determine aBMD. Jiménez-Mendoza et al. 8 developed a single X-ray transmission (XRT) device to determine aBMD in small species through a calibration procedure that guarantees X-ray doses and the automatic calibration process. 9
In rats, a portable densitometer for research was developed, but it has problems with calibration and determination of aBMD, which complicates obtaining basal curves. 10 Approximations of aBMD curves and software for small species have had to be used due to the lack of BMD curves for rats, which represents a problem, as densities cannot be well determined. Paniagua et al. 11 studied aBMD in 15-week-old female Wistar rats in vitro using a dual X-ray system (Hologic QDR 1000) for humans, and the aBMD was 0.223 g/cm2. They did not use any filter to decrease the radiation intensity used for humans, and because of the sample thickness, unrealistic values for this parameter were obtained. 11 Pineda-Gomez et al. 12 studied the effect of calcium (Ca) depletion of male rats on bone quality by post-mortem tests. However, the aBMD measurements were not reported. Wang et al. 13 used peripheral quantitative computed tomography densitometry in Sprague Dawley rats, but their study did not present any standardised BMD curves, and their values were overestimated according to those reported by Tamayo et al. 14 that showed the baseline curves for the Mexican mestizo population compared with the databases of Hispanic people using DXA. That study included 9946 subjects, of whom 6487 were healthy men and women aged 7–80 years used to determine the bone density of the T- and Z-scores. The criteria established by the World Health Organization to diagnose bone health in humans include T- and Z-scores. These values are based on the maximum BMD peak in young adult white women, and they are used as a reference scale for women aged ≥50 years old, which in turn correspond with rats >28 weeks old. Nevertheless, Z-scores are used for populations aged <50 years. This indicates that every human population or animal species must have their baseline curves for aBMD.
The objective of this work was to obtain aBMD basal and diagnose curves for male and female Wistar rats that allow low BMD and osteoporosis to be determined. For this purpose, the bone mineral content for Wistar rats was monitored from childhood to adulthood, and an osteoporosis model for female rats by 50% Ca depletion in the standard diet was developed.
Methods
Animal identification
Animals were identified according to De La Puente and Hernández-Becerra et al.15,16 The protocols were approved by the Ethics Committee of the Universidad Autónoma de Querétaro, Dirección de Investigación y Posgrado (authorisation number DIP/546-19). A total of 59 male and 67 female Wistar rats (Rattus norvegicus) aged 2 to 3 weeks were provided by the Vivarium of the Neurobiology Institute, Universidad Nacional Autónoma de Mexico (SAGARPA-SENASICA No. AUT-B-C-0815-024). Rats were acclimatised for at least 72 hours after acquisition. The sample size was chosen based on pilot studies and previous experience. 12 Housing conditions included a 12-hour/12-hour light/dark cycle (lights on at 07:00), humidity of about 45–55% and temperature of 23 ± 1°C. Rats were housed by sex, six of them in individual acrylic boxes, and all experimental groups were fed ad libitum with AIN-93G (Zeigler Bros., Inc., Gardners, PA). Rats were kept under environmentally controlled conditions according to Mexican official regulation norms (NORMA Oficial Mexicana NOM-062-ZOO-1999). 17
Animal studies
This research was divided into three experiments: bone mineral content, basal curves of aBMD and changes in BMD during osteopaenia and osteoporosis. For each test, the experimental unit was an individual animal.
Bone mineral content
Changes in the bone mineral content of male (n = 51) and female (n = 51) rats were determined weekly from week 3 to week 16 (peak in bone mass) as well as for weeks 20, 23 and 27 (adulthood). Rats were fed a standard diet. 12 For this experiment, six rats (three male) were randomly chosen and sacrificed every week by CO2 inhalation. Then, femurs were dissected, and soft tissue was manually removed. Samples were kept at –80°C until analysis. Ca, phosphorus (P), magnesium (Mg) and potassium (K) levels were determined using inductively coupled plasma optical emission spectroscopy (Variant 730-ES; Kyoto, Japan) according to Hernández-Becerra et al. 16 The results are expressed in milligrams per gram of dry mass of clean bone. Mineral mean values ± standard deviation of three rats per sex per week are reported. Figure 1(a) shows the timeline for this experiment.
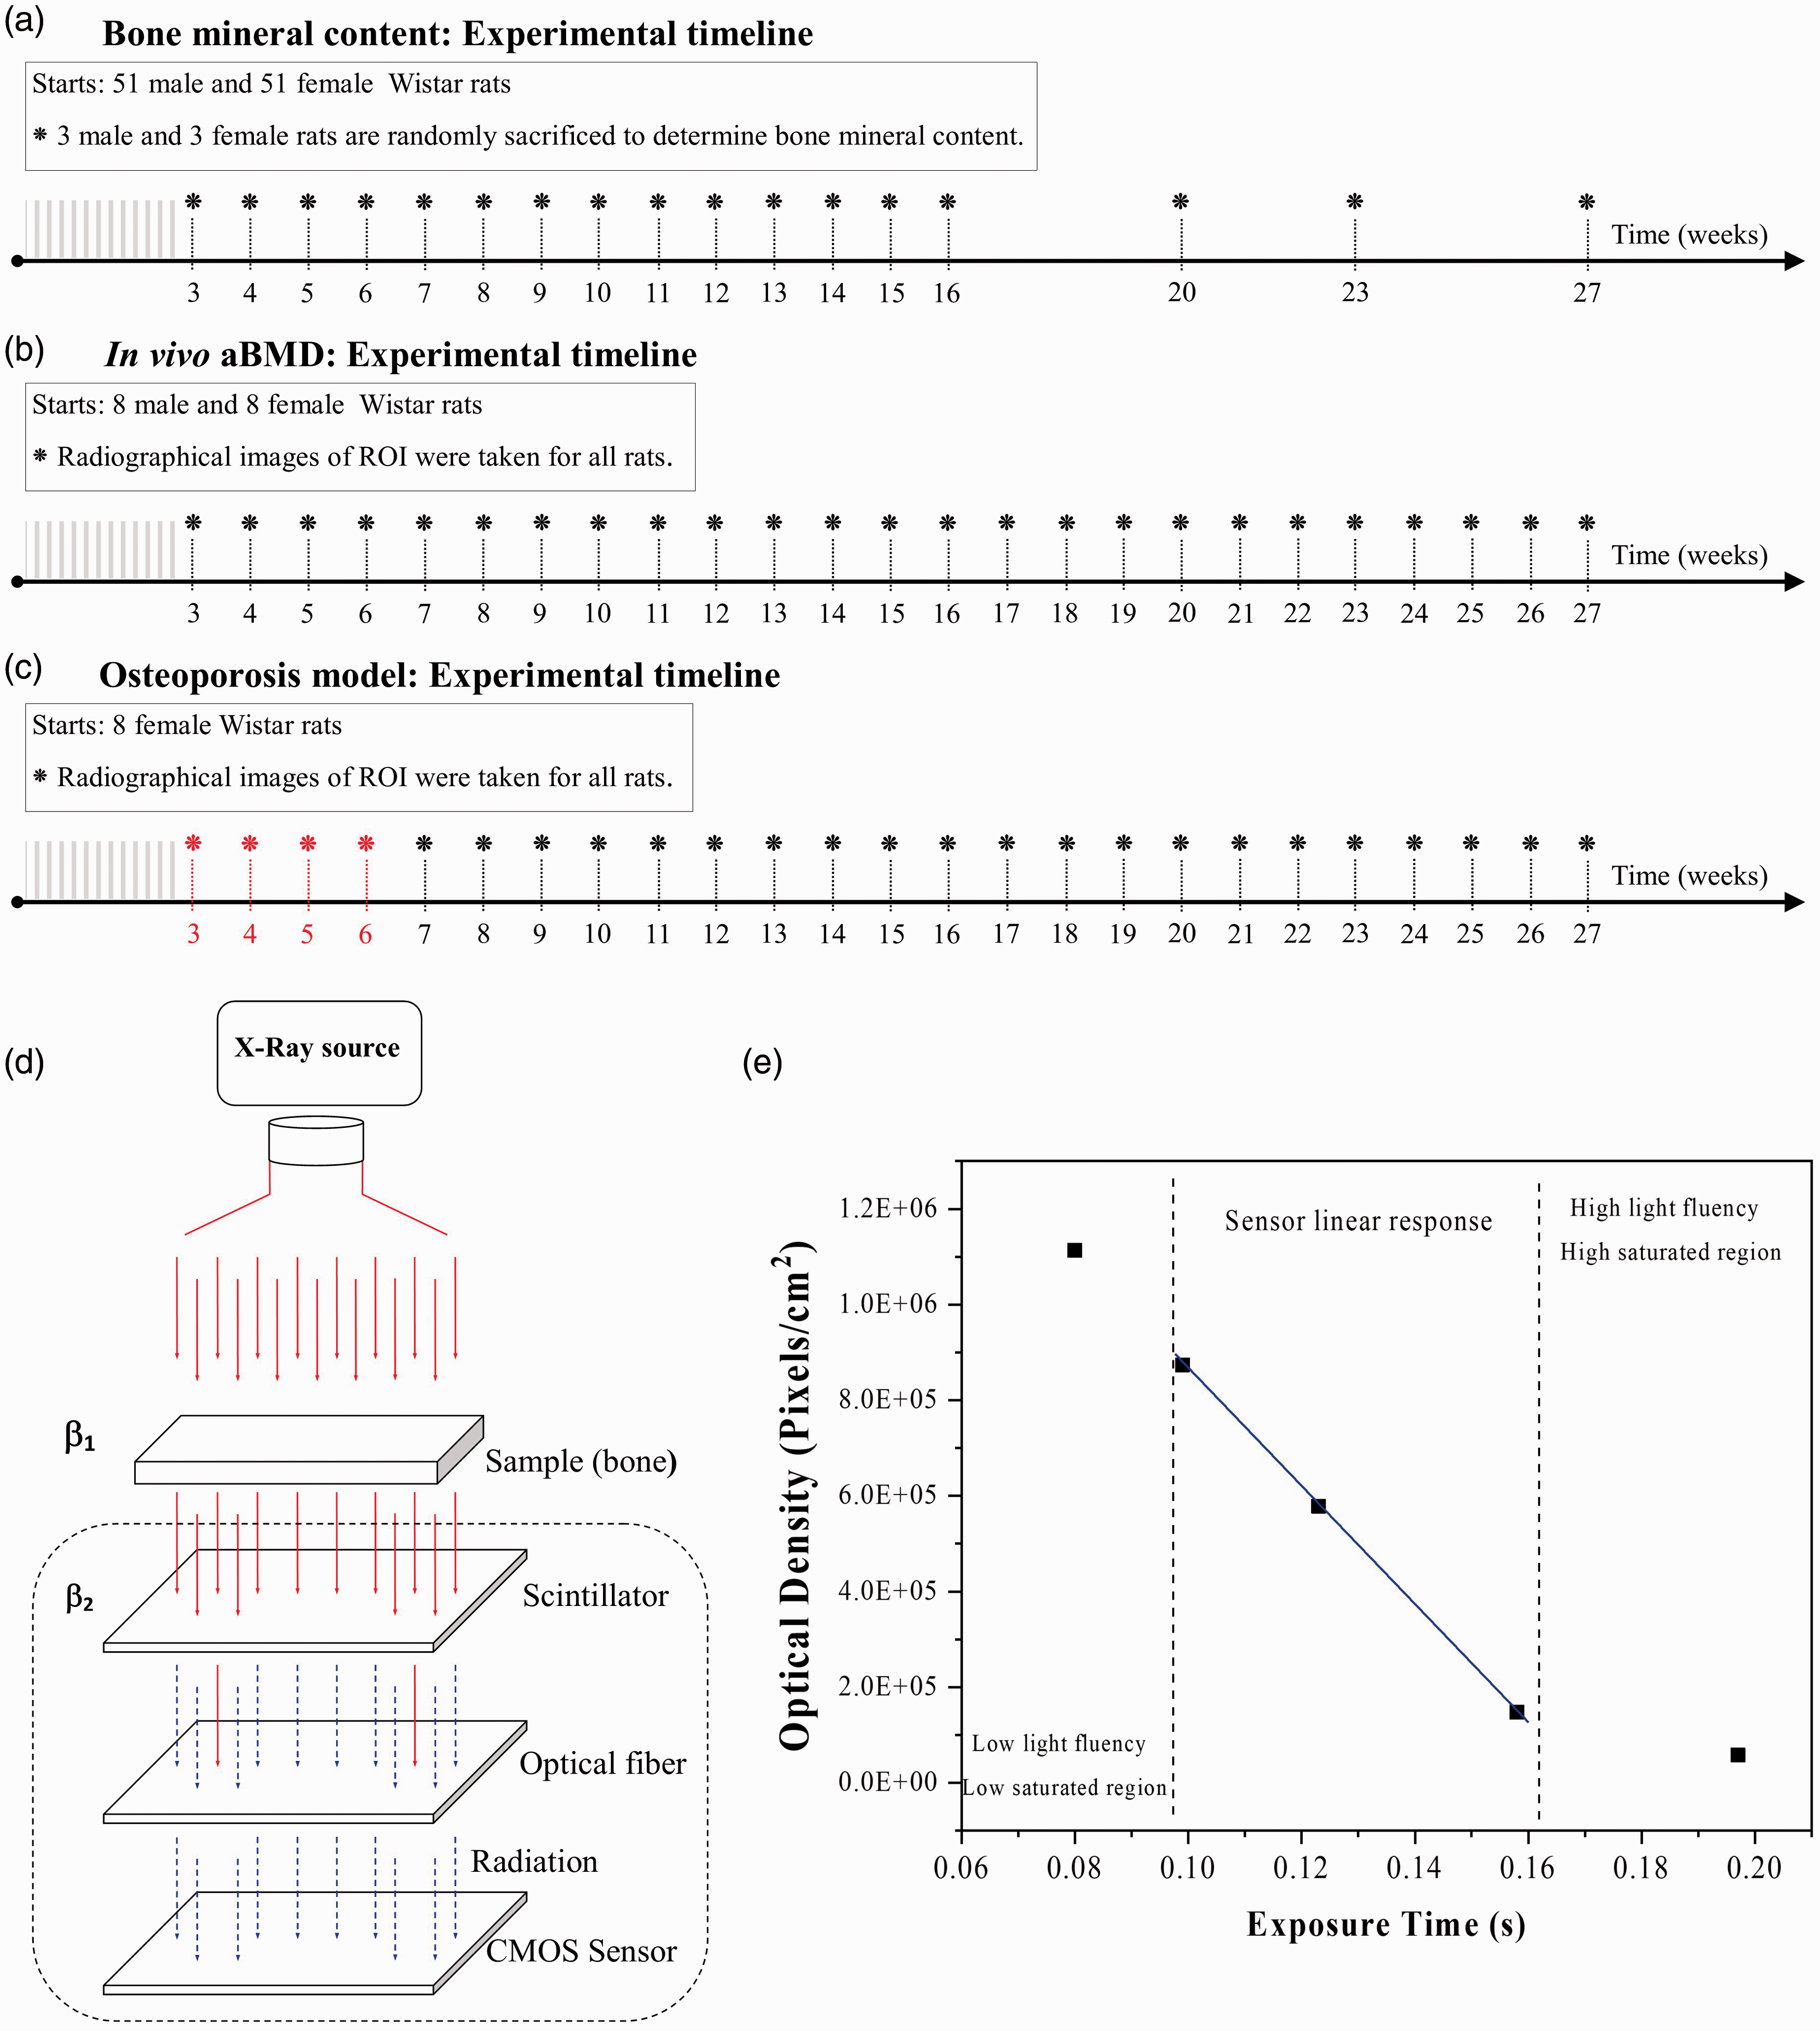
Timeline for the following experiments: (a) determination of bone mineral content, (b) calculation of areal bone mineral density (aBMD) and (c) development of an osteoporosis model. (d) Schematic representation of the X-ray sensor and (e) detector working region for the Hamamatsu X-ray.
aBMD: basal curves
In this second experiment, male (n = 8) and female (n = 8) rats fed a standard diet were used to study the aBMD in vivo. Weekly, three radiographic scans of the femoral neck were taken per animal from week 3 to week 27. Rats were randomly chosen and sacrificed at the end of the experiment. The timeline is shown in Figure 1(b).
Changes in aBMD during low BMD and osteoporosis
Female rats (n = 8) were fed a 50% Ca-depleted modified diet to develop a low BMD model according to the methodology already proposed. 12 Results obtained for female rats with the standard diet were the control group for this treatment. In brief, Ca levels in diets were reached with the addition of free-Ca mineral mixture and CaCO3 (MERK) 5 g/kg. The aBMD was randomly determined in all experimental units, and the reported values corresponded to the mean ± standard deviation of eight female rats. These rats were sacrificed at the end of the experiment. Figure 1(c) shows the timeline for this experiment from week 5 to week 27. However, only results from week 7 are reported because in that week the effect of the diet was evident.
High-resolution transmission electron microscopy characterisation of rat bones
Femoral cortical bones of 7-week-old female and male rats were defatted and calcined at 400°C. After that, the bone was crushed in an agate mortar until 75 µm particle size (200 mesh) was obtained, and the sample was sonicated with isopropyl alcohol. 18 Dark-field images were obtained using a JEM2010 FEG microscope operated at 200 kV. The crystal size was determined by using ImageJ software (National Institutes of Health, Bethesda, MD).
Scanning electron microscopy characterisation of rat bones
Micrographs were taken to study changes in the bone morphology. A Jeol JSM 6060LV was used, and imaging analyses were carried out at 20 kV. Samples were gold coated before analysis.
In vivo aBMD determination by a single XRT system
For the in vivo determination of the aBMD, animals fasted for eight hours were sedated using Isoflurane-Forane® (Datex-Ohmeda Tec 7, 0.5–1.5% in oxygen), and for the mineral determination as a function of age, animals were anaesthetised for 8 minutes and euthanised in a chamber with 80 µL ethyl ether per litre of the volume of a container.19,20 Here, it is important to note that the use of ether is currently accepted by Mexican regulations. The femurs were placed within the active sensor area of the X-ray using the digital X-ray radiography with a 4.5 cm distance between the X-ray collimator and the sensor and 158 ms exposure time to conduct the BMD assessments. Figure 1(d) shows a schematic representation of the X-ray detector used. The scale of the X-ray image is fundamental to obtain numerical data. In our case, the scale was obtained by using a calibrated stainless-steel ball bearing from Centro Nacional de Metrología (CENAM-Mexico) with 3.125 mm diameter. Digital radiography avoids problems associated with high exposure time, radiation and film exposure development that are experienced with conventional films. This radiography technique allows in vivo bone parameters such as length, width and BMD to be determined.
In vivo aBMD was evaluated in female and male rat femur bones from 3 to 27 weeks of age using a single XRT system composed of a monochromatic X-ray source (Satelec X-mind® with 70 kV energy, a wavelength of 0.177 × 10⁻¹⁰ m and 8 mA), an X-ray image sensor (Hamamatsu S10835) and custom-made software developed in C++ for obtaining radiographs. 8 The X-ray image sensor is integrated with a scintillator detecting photons at 540 nm and a fibre-optic plate cover; both are hermetically encapsulated. The sensor has an active area of 2.58 cm × 3.6 cm and an optical image resolution of 16.7 line pairs (meaning each millimetre contains 16.7 pixel lines), and each pixel is 30 µm. The exposure times of radiation used are within the lineal response of the detector for a chosen detector working region (DWR). Figure 1(e) shows the pixels per unit of a region of interest (ROI) selected as a function of the exposure time for the sensor. The first region corresponds to a low flux of the X-ray source, the DWR corresponds to the linear response region of the detector, while the third region corresponds to high exposure time that produces saturation and erroneous determination of the BMD. Therefore, all measurements were carried out in the DWR in triplicate. 9
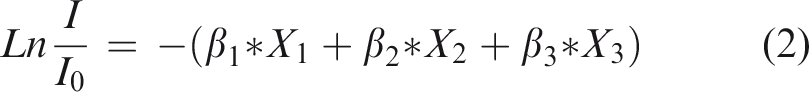
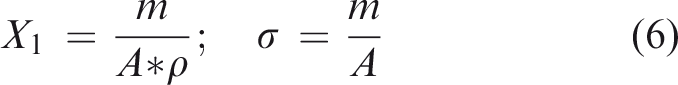
The aBMD calculation resulting from the optical density (transmitted intensity) by XRT is based on the modified Beer–Lambert law (equation (1)) in which the absorption coefficients of soft tissues were considered.
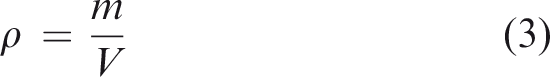
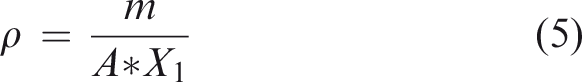
Equation (1) relates the transmitted intensity (I) and the entrance intensity (I0) to the aBMD after a calibration process which was performed by using a single silicon crystal (as a phantom) instead of a polycrystalline aluminium piece that avoids any X-ray inelastic scattering. The mass/area (g/cm2) ratio represents the density per unit of area. Then, once the system is calibrated and using equation (7) with the rat femur, this ratio represents the BMD.
8


Statistical analysis
A total of 59 male and 67 female rats were used per group for the three experiments. The first experiment was carried out to study the in situ changes in BMC (n = 51) per sex. The second experiment was carried out to determine the changes in aBMD (n = 8) per sex weekly. Finally, eight female rats were studied for the depletion diet test to induce a low BMD model. For the first and second experiments, the mean value and standard deviations are reported. Meanwhile, for the depletion diet test, data were analysed using a test for homogeneity of variances and a one-way analysis of variance, and post hoc Student’s t-test (p ≤ 0.05) was applied using IBM SPSS Statistics for Windows v23 (IBM Corp., Armonk, NY).
Results
High-resolution transmission electron microscopy analysis of hydroxyapatite from rat bones
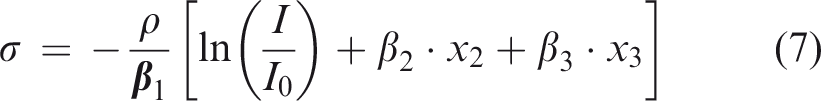
Figure 2 shows high-resolution transmission electron microscopy (HR-TEM) images of bone powder for 7-week-old male (Figure 2(a)) and female (Figure 2(b)) rats. In these images, nanocrystals with elongated plate shapes are present, and bar-like crystals corresponds to their frontal view. This shape corresponds to the preferential crystal growth of the HAp. Crystallite dimensions are 20 nm long and 8 nm wide, which confirm the nanometric character of HAp. This result is significant, since the aBMD of the rats is the consequence of the transmission of photons (X-ray) through nano polycrystalline structures.
(a) and (b) Light-field high-resolution transmission electron microscopy images of the nanocrystal of rat bone (scale 50 nm). (c) X-ray diffraction pattern of defatted and deproteinised rat bone.
Figure 2(c) shows the X-ray pattern of a rat bone (4 weeks) which confirmed the presence of HAp nanocrystals (ICDD card No. 00-009-0432). According to Londoño-Restrepo et al., HAp from mammalian bones are highly ordered. 18 Therefore, the broad peaks exhibited by this pattern are not due to a poor crystalline quality of HAp, but rather the nanocrystalline character of the sample. HAp patterns become narrower when crystals reach micrometric sizes. 21
Changes in BMC as a function of age
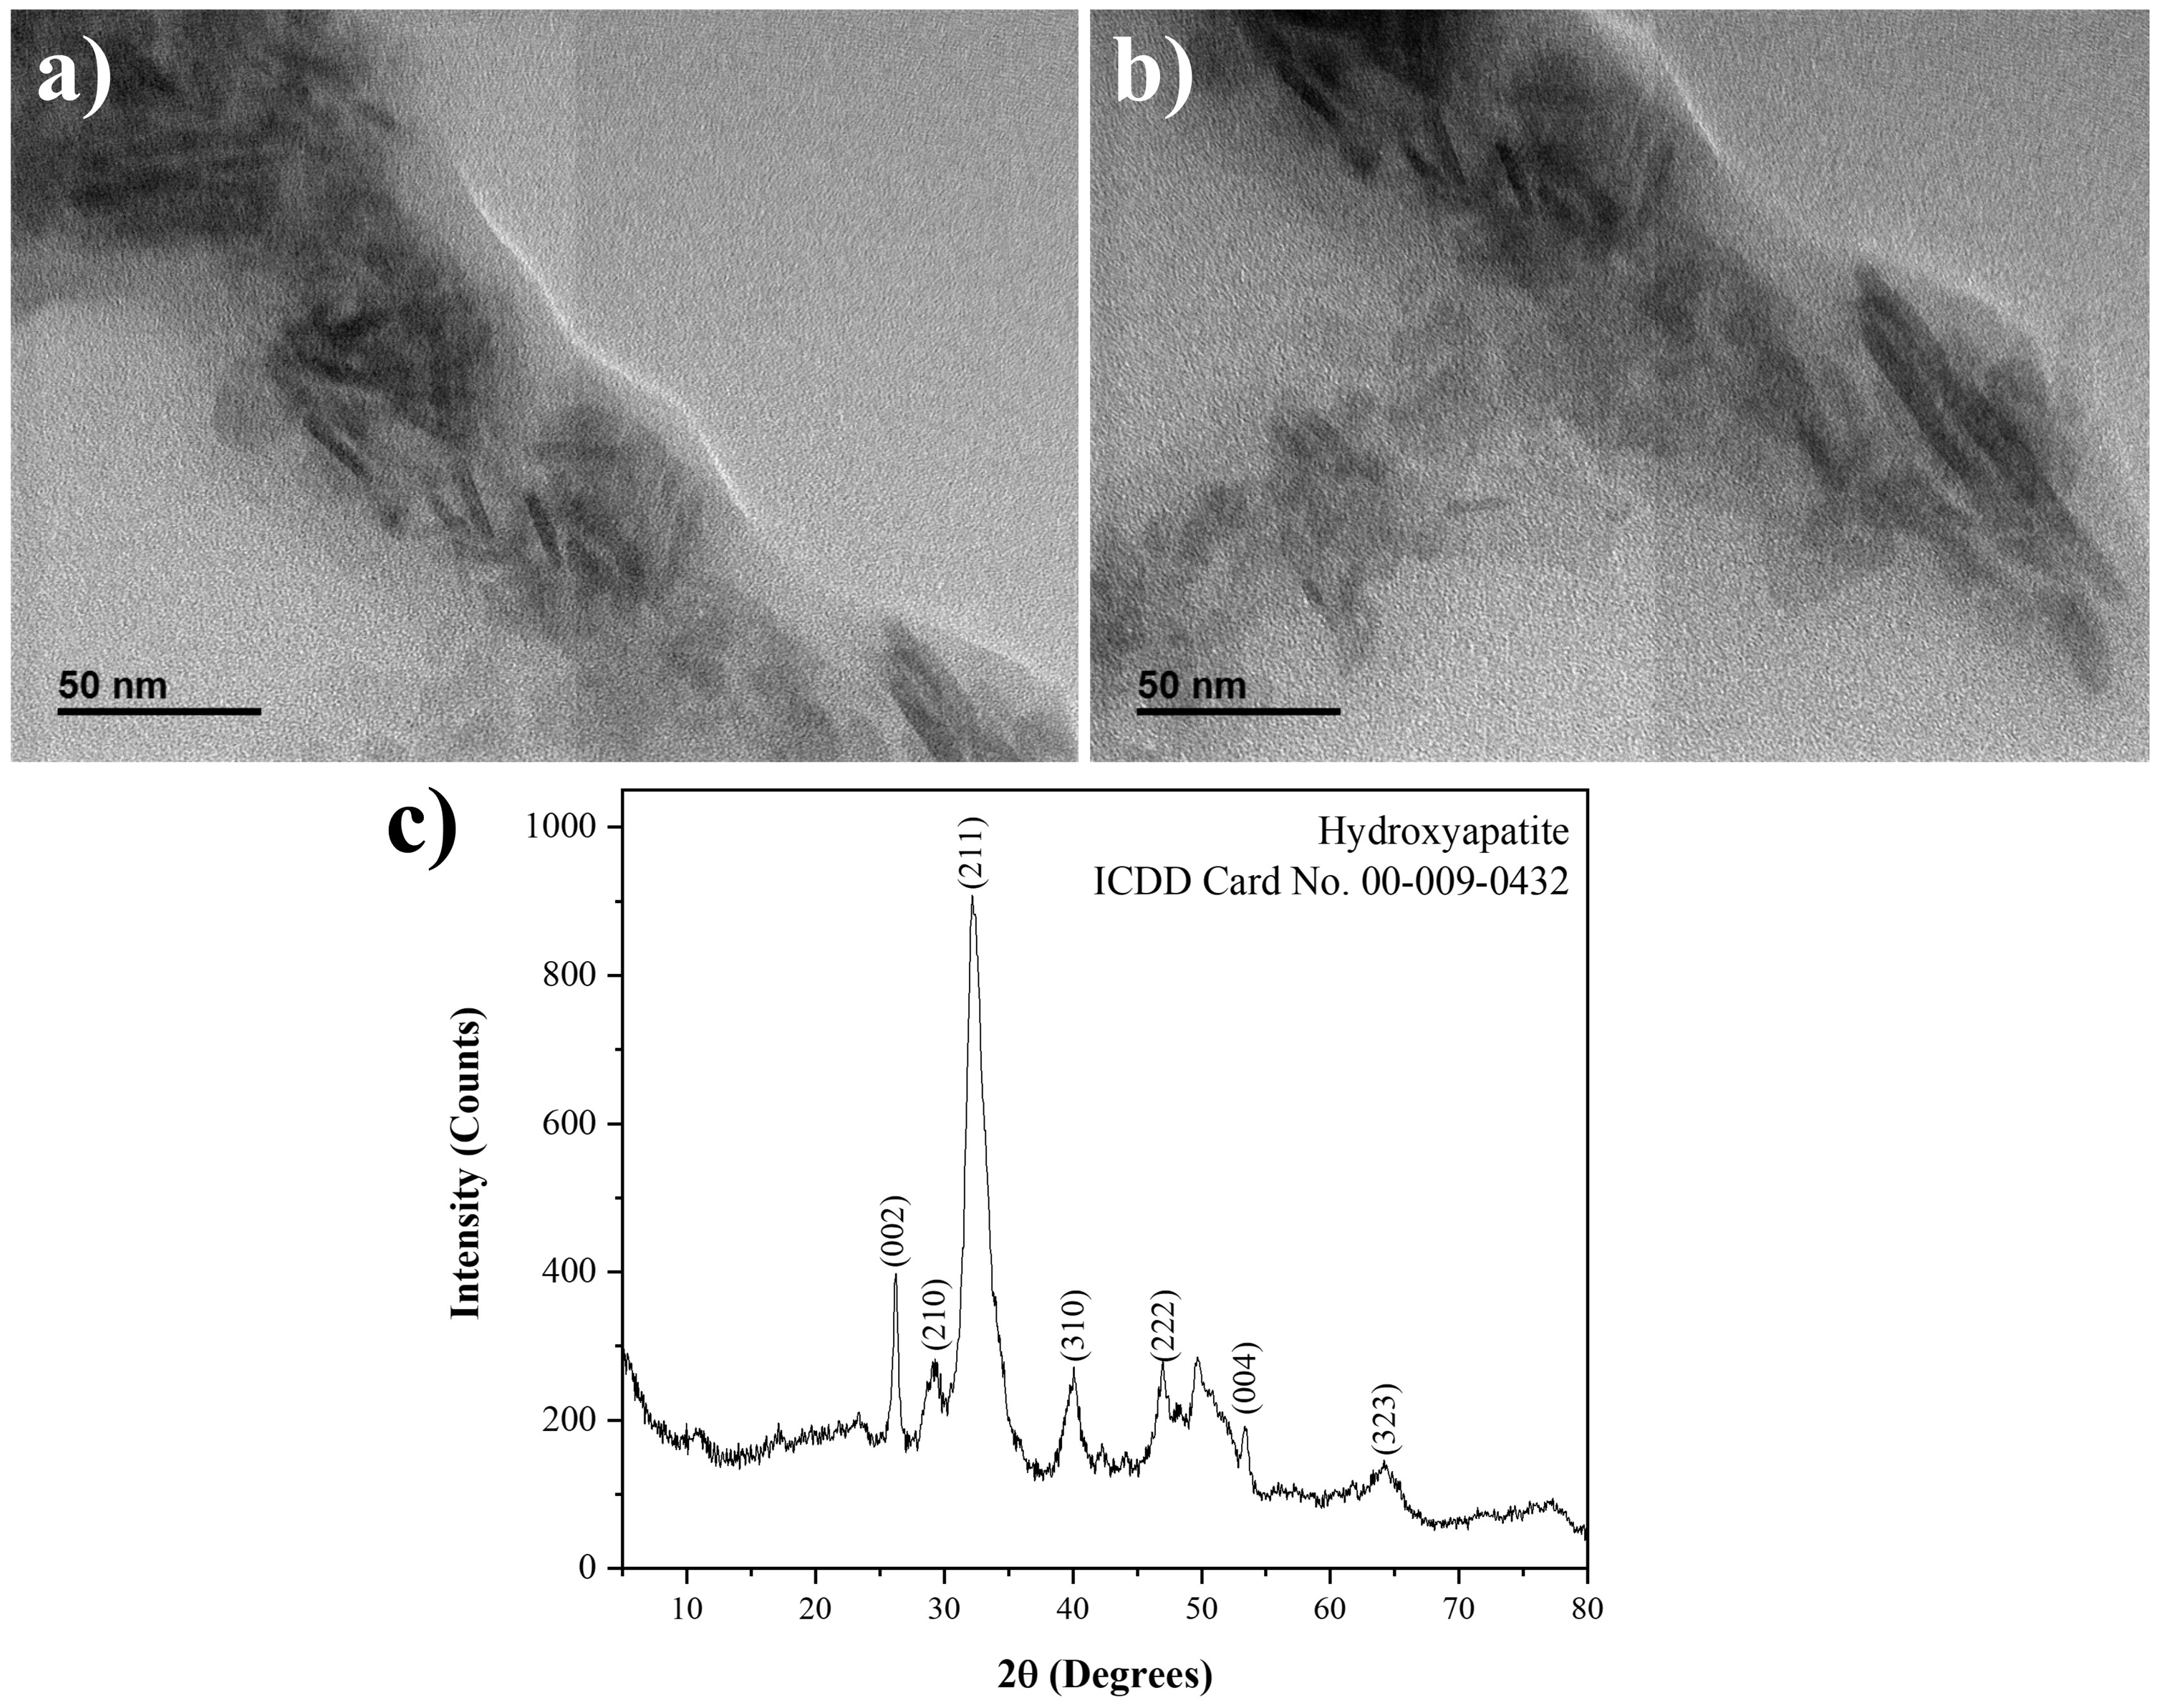
Figure 3(a) shows Ca and P contents as a function of the age of the rats from 3 to 27 weeks. For both sexes, Ca content increases with age until the 10th week. After that, there is a 3-week period of stabilisation. Finally, Ca content decreases in the last weeks of the test period. Male rats exhibit greater Ca than female rats do. On the other hand, P content does not exhibit significant changes as a function of age.
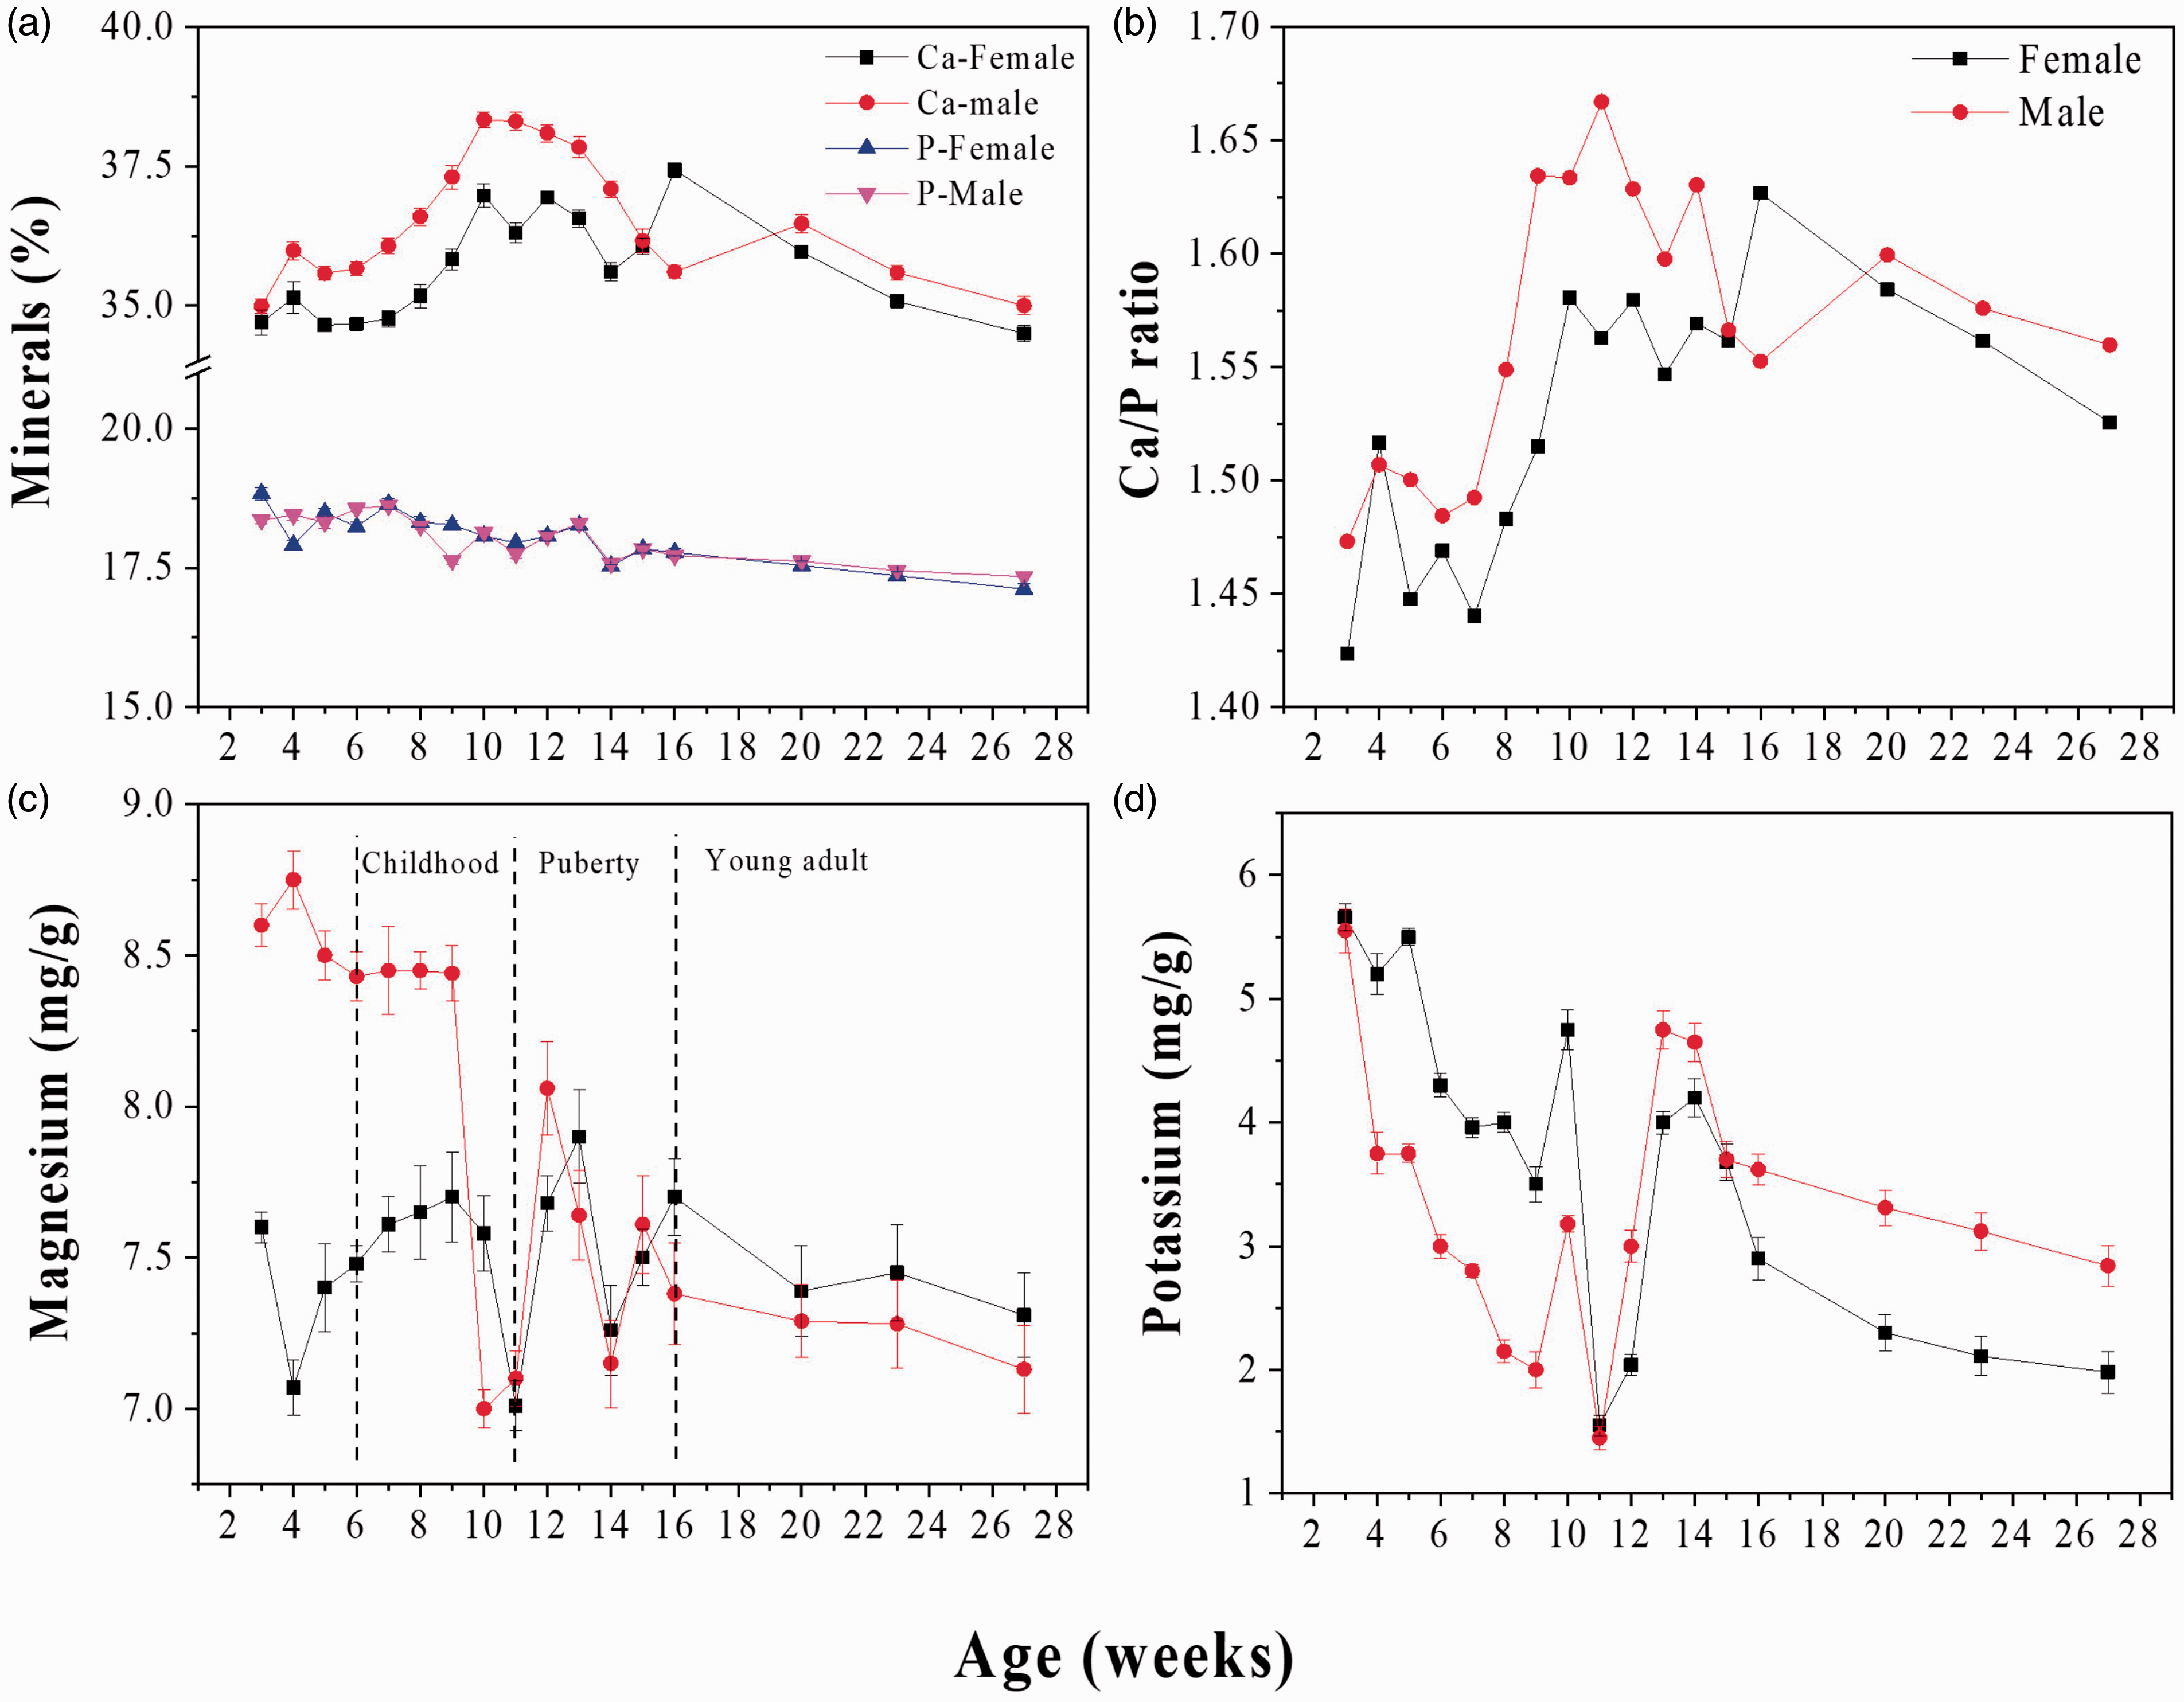
Mineral content in femur bones of rats during the growing stage. (a) Calcium (Ca) and phosphorous (P) content in female and male rats. (b) Ca:P ratio in bones of female and male Wistar rats during development. (c) Magnesium content in femur of female and male rats, and (d) potassium content in femurs of female and male Wistar rats. Values are the mean ± standard deviation (SD; n = 3, 6 femurs) per group.
Figure 3(b) shows the Ca:P ratio as a function of age for male and female rats. The Ca:P molar ratio for 4 weeks is lower than the value for stoichiometric HAp (1.67), which indicates that this is a Ca-deficient HAp. 18 However, Ca:P ratio increases from 1.47 to 1.67 for males because of the increases in Ca content (see Figure 3(a)) as does age until a relative maximum found around week 11 (the end of childhood) where it is closer to 1.67 (stoichiometry value for synthetic hydroxyapatite). This fact is directly related to the Ca increase caused by the physiological response during the growing stage. The Ca:P ratio decreases after 12 weeks because the growth-spurt stage ends. So, aBMD could be influenced by this fact. For females, the increase in the Ca:P ratio happens until week 16 (the end of puberty), increasing from 1.42 to 1.63. After week 12, the ratio decreases due to the decrease of Ca (see Figure 3(a)). The Ca:P ratio is governed by the changes in Ca because P does not exhibit significant changes as a function of age and sex.
Figure 3(c) and (d) exhibits the changes in Mg and K content that present an opposite trend to Ca. This could be due to a competitive effect between them and Ca and P into the HAp lattice. 18 This can be evidenced by the minimum observed at week 12 for Mg compared with the maximum for Ca, which is associated with a divalent substitution, which in turn could be associated with hormonal fluctuations characteristic of sexual dimorphism.22,23 This claim is in agreement with Smith and Field 22 who found a decrease from young to adult stages in around 13% of rat femurs. There are several fluctuations in K content that are associated with hormonal changes at the pubertal stage. K decreases from week 3 to week 11, while it increases from week 11 to week 15, and finally there is a monotonic decrease after week 15. The inclusion of the above-mentioned ions makes HAp nonstoichiometric.
Determination of aBMD by XRT
The femoral neck is one of the areas used to calculate aBMD for human bone densitometry. Therefore, for this work, radiographic studies focused on that area. The ROI was defined as a square of 33 × 33 pixels for all cases (Figure 2(c)). The capture of the digital X-ray radiographs was carried out weekly from weeks 3 to 27.
Figure 4 shows radiographs obtained at different ages for female and male rat femurs. For both sexes, the femur heads of 3-week-old rat appear with high optical density, which is related to the low Ca and P mineral content. For this reason, the other radiographs (Figure 4(c)–(j)) are whiter than those ones taken at 3 weeks old. The optical density decreases because of the increase in Ca and P levels. This means that the aBMD changes are caused by the remodelling process during the life of the rat. As was mentioned, this process guaranties the calibration of the system, the measuring procedure and the right doses for the X-ray images.
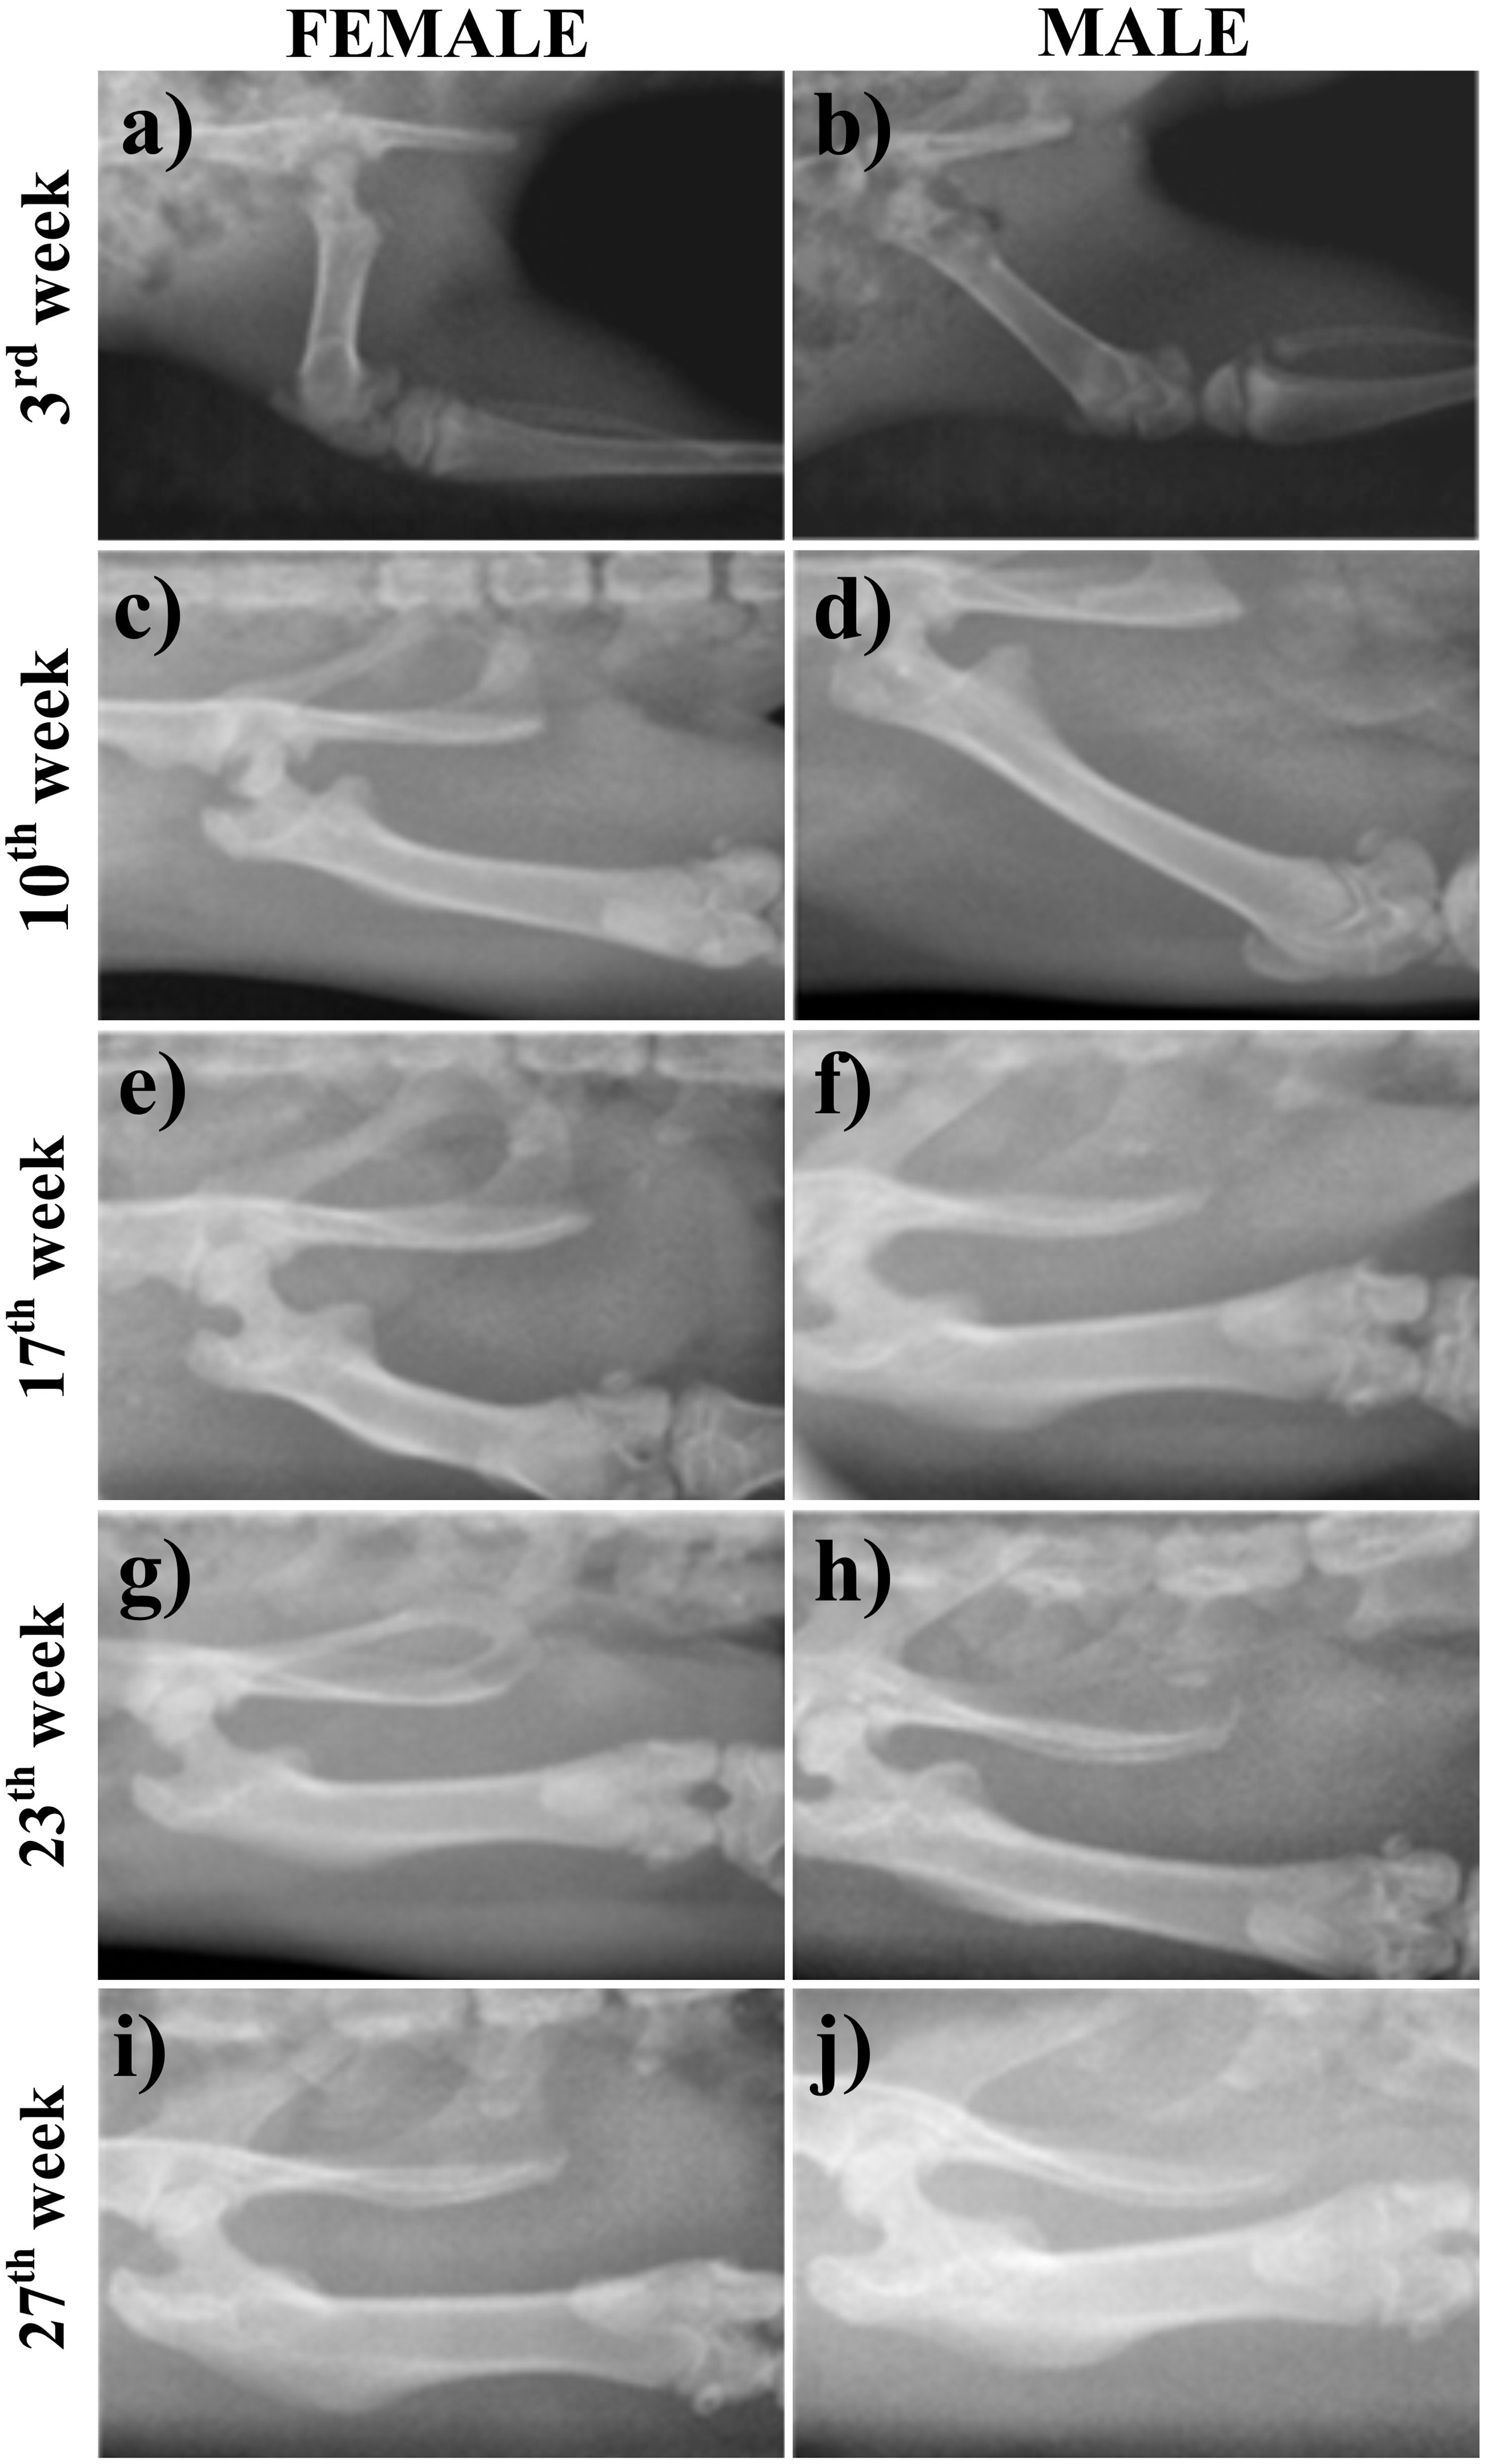
Bone radiographies from rats at 3, 10, 17, 23 and 27 weeks of age for both sexes.
Figure 5(a) and (b) shows the basal aBMD values for female and male rats in the femoral neck region as a function of age. The reported values correspond to the average ± SD (n = 8) per group, sex and age. Childhood corresponds to weeks 3–6. During weeks 3–4, rats have a critical short step because of the weaning period and adaptation to the new environmental conditions without maternal stimulation, which implies no significant bone development. From weeks 4–7, rat bones show an abrupt increase in aBMD for both sexes. This period coincides with the first phase of rapid change in their physical development. It is worth noting that the higher aBMD increase in male rats compared with that in female rats is caused by sexual dimorphism,24,25 and the increase of the Ca content in the bone (see Figure 3(a)).
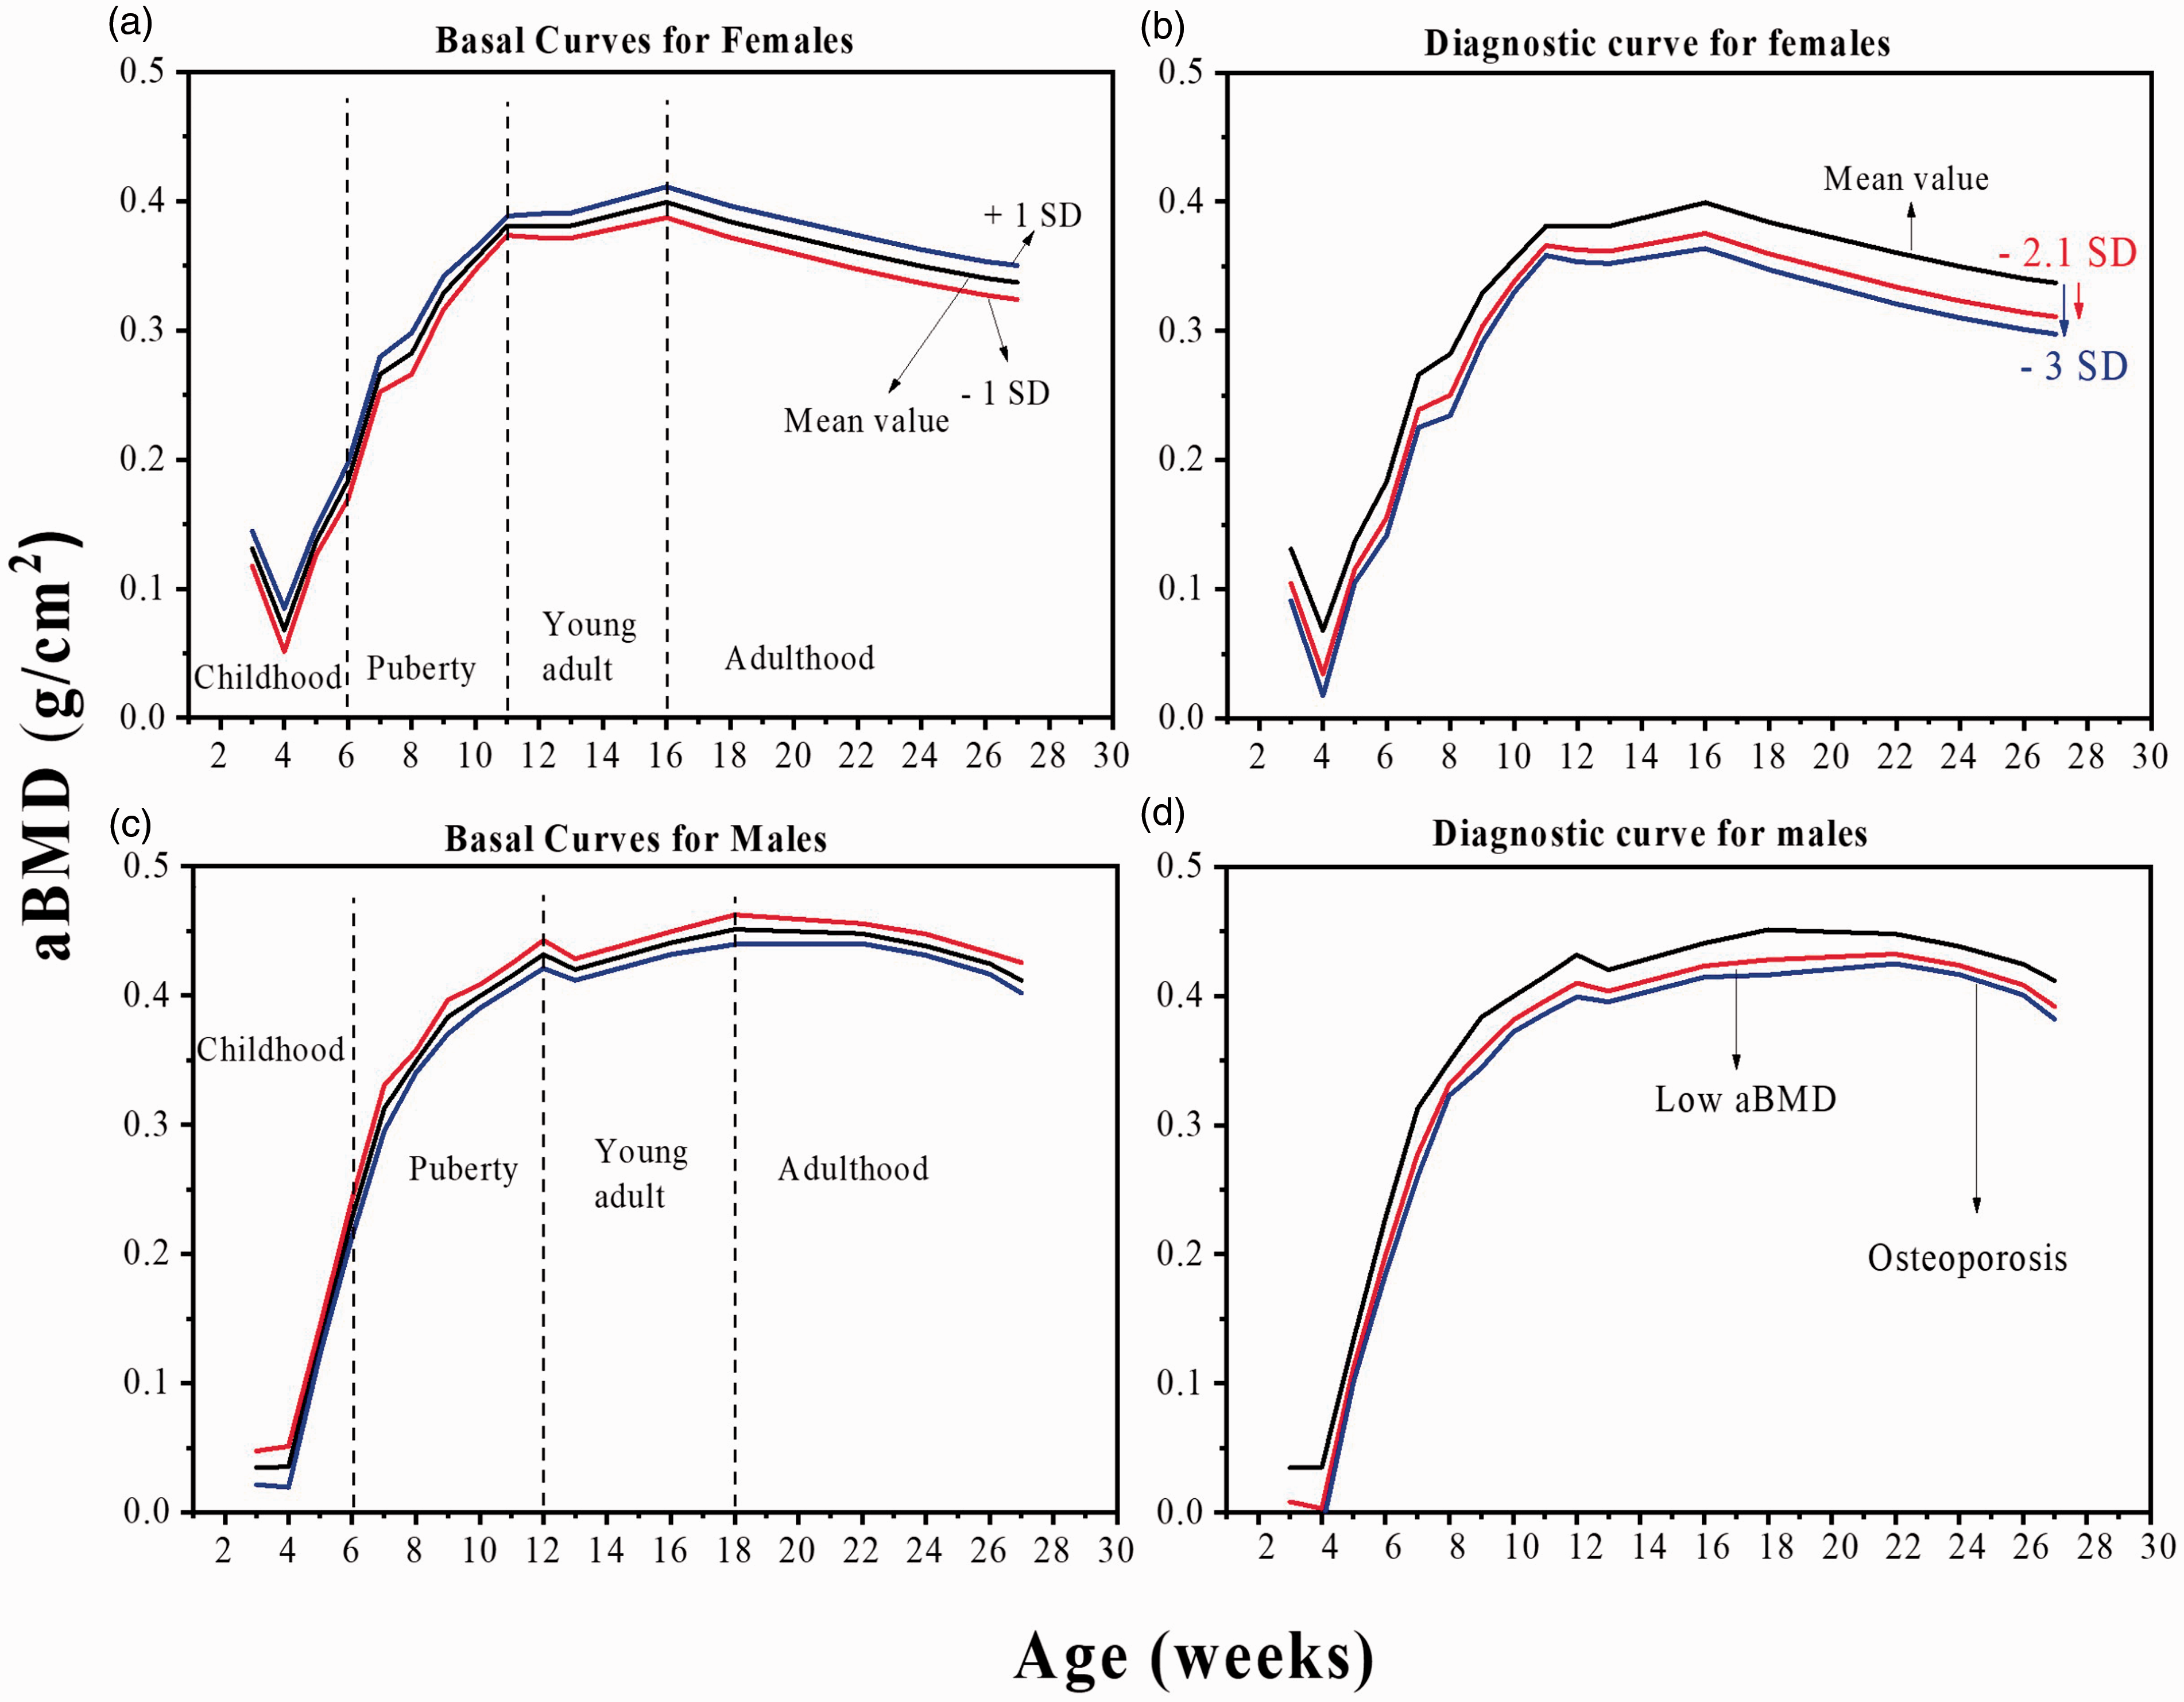
(a) BMD for female and (b) male Wistar rats as a function of age. The values are mean of eight repetitions ± SD. Diagnostic curve of BMD (Z-score) in (c) female and (d) male rats by age.
Puberty starts at week 7 and ends at weeks 11 and 12 for female and male rats, respectively, when they have reached sexual maturity. In the first three weeks of this stage, bones have a significant aBMD increase. Young adult covers the period from week 11 to week 16 for female rats and from week 12 to week 18 week for male rats. aBMD increases until reaching its maximum peak. Adulthood starts at week 16 for female rats and week 18 for male rats, when a decrease in aBMD was found in both sexes. However, in this last stage, bone metabolism is balanced, since bone formation is equal to bone resorption, but this period is shorter for female rats than it is for male ones, and a bone mass loss starts for female rats.
Z-score value to diagnose low mineral density and osteoporosis in Wistar rats
Tamayo et al. 14 established the Z-score value for the Mexican population of the same sex and age. This criterion establishes that aBMD is normal when it is above –1 SD regarding the average and lowering the fracture risk. Considering the basal curves for both sexes (Figure 5(a) and (b)) and applying the Z-score (1.1 to –2.49 SD), it is possible to establish the diagnostic criteria to define low aBMD and osteoporosis in an animal model. When aBMD values are –2.5 SD (see Figure 5(c) and (d)), it is classified as osteoporosis. These curves (Figure 5(c) and (d)) serve as a reference value for the Z-score to compare experimental subjects with groups of the same age, species and sex.
Osteoporosis model
Figure 6(a) and (b) shows images from the condyle to metaphyseal region of a bone for the normal group and the group with 50% Ca depletion for week 17. Bones of rates that were fed a Ca-depleted diet exhibit a decrease in the trabecular bone as well as a decrease in the thickness of the cortical bone. Figure 6(c) and (d) shows the trabecular region for bones of normal and Ca-depleted groups. In the normal group, the micro-architecture of the trabecular bone remains unchanged, but the trabeculae for the depleted group suffer drastic changes in their density. The trabeculae are more porous and thinner than those in the normal group, which implies that this femur has low BMD.
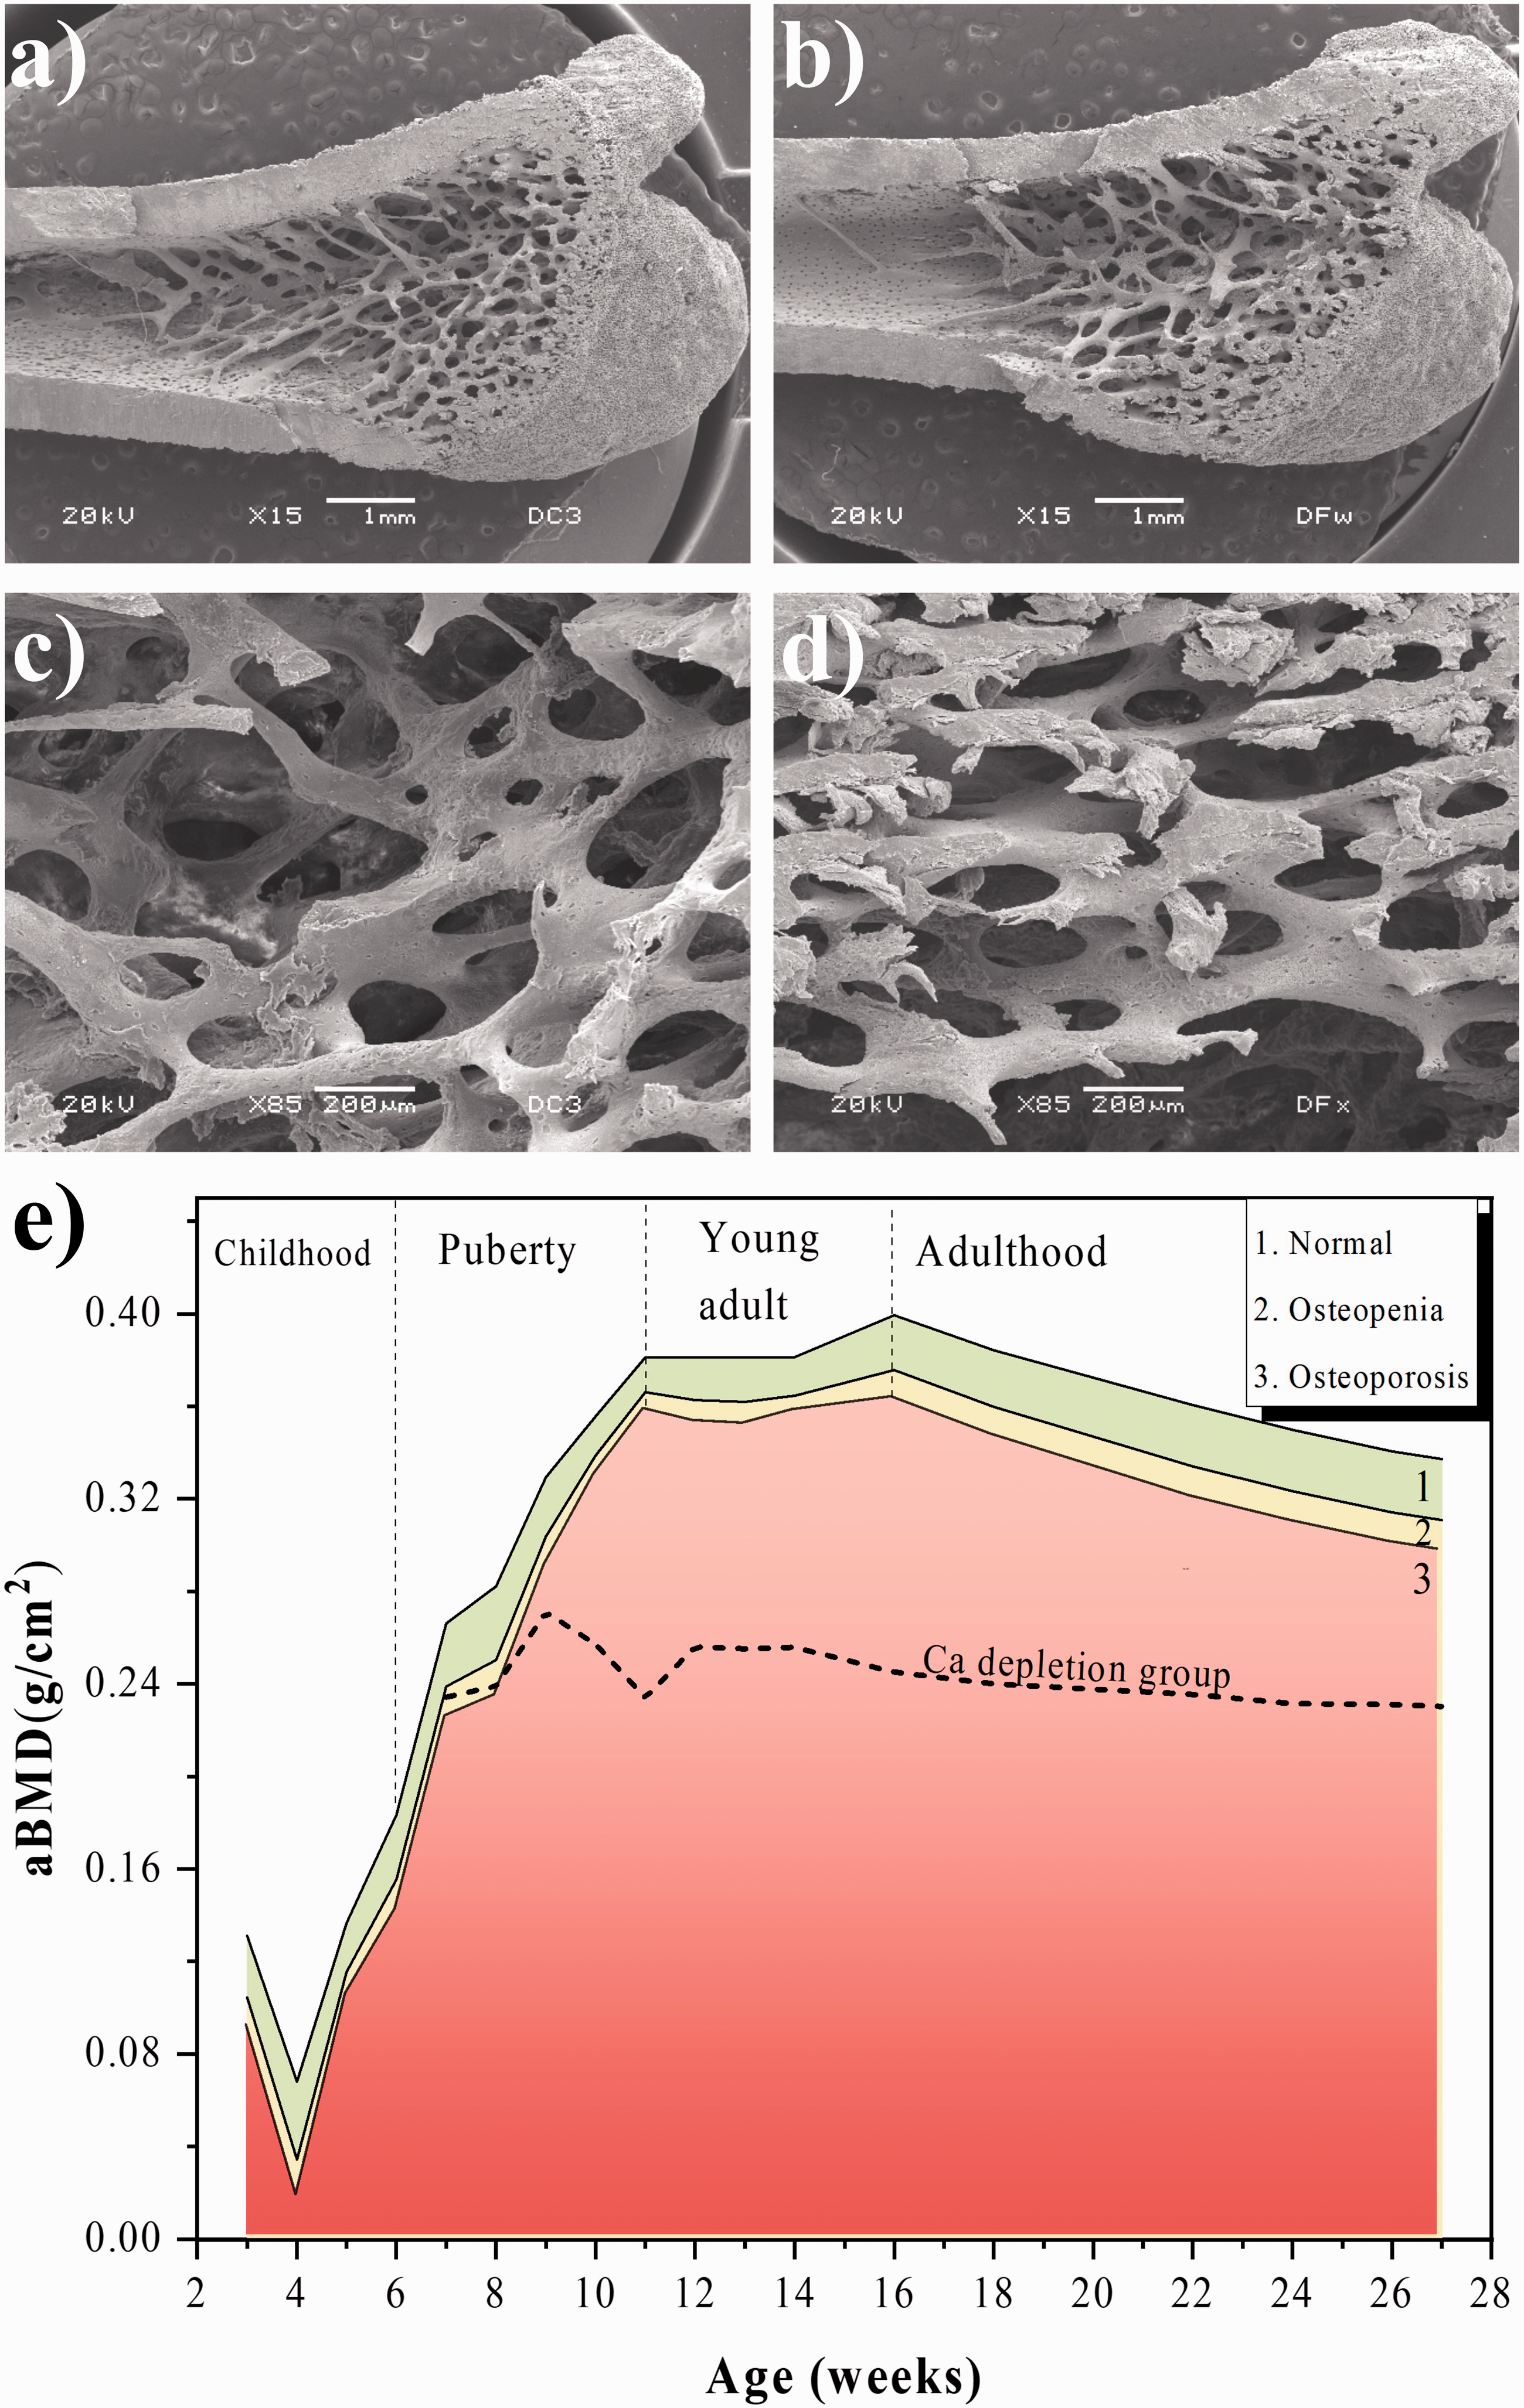
Model for osteoporosis by Ca depletion in the diet for female rats during the growth stage. Values represent the mean ± SD of eight rats.
Figure 6(e) shows the aBMD curves for the normal group in which normal (green area), osteopaenic (yellow area) and osteoporotic (red area) regions are indicated. The dashed curve corresponds to the Ca depletion group. In this last curve, aBMD decreased from week 9 to week 27 because of the Ca reduction in the diet. Trabecular and cortical tissues present drastic changes in their composition and microarchitecture (Figure 6(b) and (d)) due to the Ca decrease, and it and makes the bone susceptible to fractures. It is worth considering that rats undergo small changes in aBMD in the adult stage; bone remodelling exhibits a decrease under normal conditions related to the natural process of aging.
The 50% decrease in Ca levels in the diet occurred mainly during puberty, resulting in these animals being osteoporotic and not reaching the maximum peak of aBMD (0.376 g/cm2) for 14 weeks as the normal group did (see Figure 5(a), female), and the peak value for aBMD was 0.242 g/cm2. Therefore, the depletion of Ca in the diet by 50% is valid to generate an osteoporotic model (see Figure 6(e)).
Discussion
HR-TEM images showed that the rat bone is formed by nanocrystals, and the X-ray diffraction pattern of the bone showed broad diffraction planes of hydroxyapatite associated with their nano size. Ca and P are the main components of rat bones. However, Mg, K and Na levels are high enough to be considered in the basic bone composition, which is an indicator of bone quality. 18 The presence of these minerals contributes to bone health, and the minerals are directly related to the values of the aBMD. Changes in the chemical composition of the bones as a function of age take place throughout life. Thus, the aBMD follows the same trend because of the remodelling process. The bone ion content for male and female rats is a kinematic process governed by sexual dimorphism and can be modified by diet, hormones, physical activity and developmental stage.19,20
The calibration process of the XRT system based on a crystalline phantom (Si) reduces the inelastic X-ray diffraction contribution and allows for excellent data reproducibility to obtain in vivo aBMD values and establish for the first time basal curves as a function of the age for male and female rats. These curves behave in the same manner as for humans, namely they also increase rapidly in the early life stages and stabilise in the adult stage. In addition, men tend to have higher aBMD than women do. 14
The results observed in the aBMD curves in rat femurs show an accelerated increment during weeks 3–10. The peak bone mass observed at the end of the young adult period is established by hormonal fluctuations that are characteristic of this period.
It is necessary to highlight that the young adult period has minor changes due to aBMD stabilisation. These results also show a rapid growth stage and a stabilisation phase (adult stage), as previously described. 21 Moreover, sexual dimorphism was established from 4 to 6 weeks of age as the first important peak in development. 24 This peak occurs before reaching sexual maturity (weeks 11–12) which is a crucial factor associated with hormonal fluctuations required for structural bone mineralisation.
There is a tendency for aBMD to stabilise after week 16, as is the case in the human aBMD curve. 14 The results of aBMD reported in this work are higher than the reported values for 12-week-old female rats by Talbott et al. 26 (0.271 g/cm2) in which no calibration process was carried out. Rats reach the maximum density peak in the next stage from sexual maturation (week 16) based on the aBMD curves. This value is held almost until week 27 when rats are in the adult stage, and the bone formation and resorption are similar between them. It is important to remember that during childhood and puberty, the growth of the organism is a consequence of the formation of bone: from cartilage to subsequent ossification. When the rate of aBMD decreases (weeks 16–16), rats are considered young, and the bone formation and resorption stay in balance. 27 After week 16, rats are in the adult stage, as noted by Tamaki and Uchiyama, 25 in which bone remodelling is still balanced. The interaction between genetic, nutritional, mechanical, hormonal and local factors produces small variations in the bone mass peak between 25 and 50 years of age in humans and between 6 and 12 months of age in rats. In our study, this balance was observed between weeks 16 and 24 under normal physiological conditions, but after that period, aBMD in rats begins to decline. This study provides an alternative way to determine aBMD of a Wistar rat avoiding sacrifice. A limitation of this study is the fact that the developed curves are only applicable to Wistar rats. Thus, obtaining aBMD curves for other species is still a problem. This single XRT system can be used in different small species to determine aBMD and to study other pathologies. The development of an X-ray dual system will help to reduce the calibration time but would increase the x-ray radiation.
Footnotes
Acknowledgements
Sandra M. Londoño and E. Hernandez thank CONACYT-Mexico for the financial support of their postdoctoral position. The authors thank Dr M.V.Z. José Martín García (INB, UNAM) for technical support and animal management. This project was supported by Laboratorio Nacional de Caracterización de Materiales (LaNCaM) at CFATA-UNAM.
Declaration of Conflicting Interests
The author(s) declared no potential conflicts of interest with respect to the research, authorship and/or publication of this article.
Funding
The author(s) disclosed receipt of the following financial support for the research, authorship and/or publication of this article: This project was financed by PAPIIT-Universidad Nacional Autónoma de Mexico, project number IN114320 and CONACY-Mexico.