
Abstract
In the past, bone loss in the ovariectomized (OVX) osteoporotic rat model has been monitored using in vitro micro-computed tomography (micro-CT) to assess bone structure (bone volume/total volume, BV/TV). The purpose of this study was to assess the importance of baseline control and sham groups in 12–16-week-old, reproductively mature rats. Measurements were carried out in a longitudinal and age-matched fashion using newer in vivo peripheral quantitative computed tomography (pQCT), which measures apparent bone mineral density (BMD). BMD was measured at the distal femoral metaphysis of 12-week-old female Wistar rats with pQCT. Subsequently, animals were either OVX or sham operated, and pQCT measurements were repeated four weeks later. Then, all rats were euthanized and in vitro BMD and BV/TV were obtained by micro-CT imaging. Results from three consistently differentiated regions of interest showed that there was significant bone loss and growth during the four weeks in the OVX and sham group, respectively. Taking this into account, i.e. a posteriori superimposing growth to loss, no differences resulted between BMD values measured in a longitudinal fashion with pQCT and that measured in comparison with an age-matched sham group with micro-CT and pQCT. In addition, there was a strong linear correlation between BMD measured with pQCT and BV/TV obtained from micro-CT. In conclusion, this outcome provides new insights into individual bone changes due to OVX and growth in Wistar rats during the age period of 12–16 weeks, which is often applied in osteoporosis research as the ‘mature’ rat model. Data can be used as baseline information upon which future in vivo study designs with this rat model can refer to reduce and minimize animal use.
Osteoporosis is a systemic skeletal disease characterized by low bone mass and microarchitectural deterioration of bone tissue with a consequent increase of bone fragility and susceptibility to fractures. Among the elderly, osteoporosis is a problem with great morbidity and high mortality. For older women, the risk of dying from a hip fracture 1 is nearly as high as dying from a stroke. 2 In addition, the increase in the elderly population will lead to an increased prevalence of osteoporosis and subsequent costs to society will rise. In order to study and develop surgical treatments for osteoporotic fractures as well as new strategies for pharmaceutical therapies, animal models of osteoporosis are needed. 3 The ovariectomized (OVX) rat is the most widely used animal model for osteoporosis 4,5 as it shares many similar characteristics to postmenopausal bone loss in women, e.g. bone resorption exceeding bone formation, greater loss of cancellous bone than cortical bone as well as similar treatment response to drugs like bisphosphonates, oestrogen, parathyroid hormones and calcitonin. 6,7
Two different OVX rat models have been described in the literature: the ‘aged’ rat model, addressing older animals with no further longitudinal bone growth and the ‘mature’ rat model, which is based on three-month-old, still growing, but reproductively mature animals. 6,8 The considerably slowed but not yet complete bone growth is a downside of three-month-old rats, making sham animals and baseline controls inevitable 6 when assessing bone changes. On the other hand, rats in this age offer several advantages: they are highly available, have reduced housing costs and due to their sexual maturity are capable of responding appropriately to the hormone deficiency induced by OVX (i.e. mostly similar characteristics of the ‘aged’ rat model). For those reasons, rats ovariectomized around 12 weeks of age and with an osteoporosis inducing period of a few weeks are commonly used in research as osteoporosis models. 9–11
To monitor bone loss in the OVX rat model conventional histology has been used in the past. 12,13 Histology allows us to address changes at cellular level and to quantify tissue morphology. To overcome the limitations of histology for the latter purpose, such as solely two-dimensional morphometry, its destructive nature and manually intense procedures, the use of high-resolution micro-computed tomography (micro-CT) has become more and more popular. 14–18 However, despite the possibility to quickly assess mineral density and three-dimensional microarchitecture from bone samples in a repeatable, non-destructive manner, a major disadvantage of standard micro-CT is that, similar to conventional histology, it is used in vitro making it impossible to assess longitudinal temporal changes in the same animal. Instead, peripheral quantitative computed tomography (pQCT) as well as a recently developed in vivo micro-CT (vivaCT40, Scanco Medical, Bassersdorf, Switzerland) is able to provide information from living animals in a longitudinal fashion. pQCT has been widely applied in rats, 19–21 mice 22,23 and goats 24 for research purposes. The great advantage of longitudinal study designs is that one and the same animal can be monitored over different time-points enabling researchers to obtain comparable levels of information from fewer animals.
This study is the first combined application and validation of different methodological, experimental and analytical techniques within a single frame. In vivo longitudinal pQCT and in vitro age-matched micro-CT measurements (methodological), assessment of bone changes in normal vs. OVX rats (experimental), as well as sensitivity analysis based on bone mineral density (BMD) and bone volume/total volume (BV/TV) data of different regions of interest comprising cortical and trabecular bone (analytical) were tested in the presence of the additional biological factor ‘growth’, as in the case of 12–16-week-old Wistar rats broadly used in osteoporotic research. Future in vivo studies working with the same rat model can apply these data as further information to adjust the experimental design and optimize animal use.
Materials and methods
Animals
Twenty-one female HanRcc:WIST rats of eight weeks of age were acclimatized for four weeks, housed in Makro Type IV cages in groups of four with sawdust as bedding material. They were fed with standard rodent chow (Provimi, Provimi Kliba AG, Kaiseraugst, Switzerland) and bottled tap water ad libitum. The animal housing room was maintained under standard laboratory conditions (light–dark cycle: 12:12 h, temperature: 20–22°C, relative humidity: 45–55%). At 12 weeks of age, they were randomly divided into two groups: one group underwent bilateral ovariectomy (n = 13, larger number for a subsequent study), while the other group received a sham operation (n = 8). Animals were premedicated with buprenorphine (Temgesic®, Essex Chemie AG, Lucerne, Switzerland) and anaesthetized with isoflurane (Isofluran Baxter ad us. vet.®, Baxter AG, Volketswil, Switzerland). Buprenorphine was given for two days postoperatively for analgesia. Each animal received a pQCT scan prior to surgical intervention. Four weeks later the pQCT scan was repeated under isoflurane anaesthesia and then animals were euthanized by CO2 inhalation. The left femurs were harvested, freed from soft tissue, immediately fixed in 70% ethanol and scanned with high-resolution micro-CT. The procedure for animal care, experimental protocol and euthanasia in the study was approved by the Animal Experimentation Commission of the Veterinary Office of the Canton of Grison, Switzerland and followed the guidelines of the Swiss Federal Veterinary Office for the use and care of laboratory animals.
Peripheral quantitative computed tomography measurements
pQCT was performed using a 3D XtremeCT (Scanco Medical, Brüttisellen, Switzerland). This scanning system consists of a two-dimensional detector array with 3072 × 255 elements in combination with a micro-focus X-ray tube having a spot size of 70 μm, enabling simultaneous acquisition of a stack of parallel CT slices. The rat was positioned on an in-house custom-made acrylic holder, which allowed consistent and precise positioning of the rat leg (Figure 1). The longitudinal axis of the left leg was aligned perpendicular to the scanner beam. Fifty-one cross-sectional slices (corresponding to a length of 2 mm) were collected at the distal femoral metaphysis with an isotropic voxel size resolution of 41 μm and a pixel matrix of 3072 × 3072, using an effective energy of 60 keV and a current intensity of 900 μA. The total examination time was 10 min. The resulting grey-scale images were then processed using a Gaussian low-pass filter (Σ = 0.7; support = 1) to remove noise, and apparent BMD was calculated.
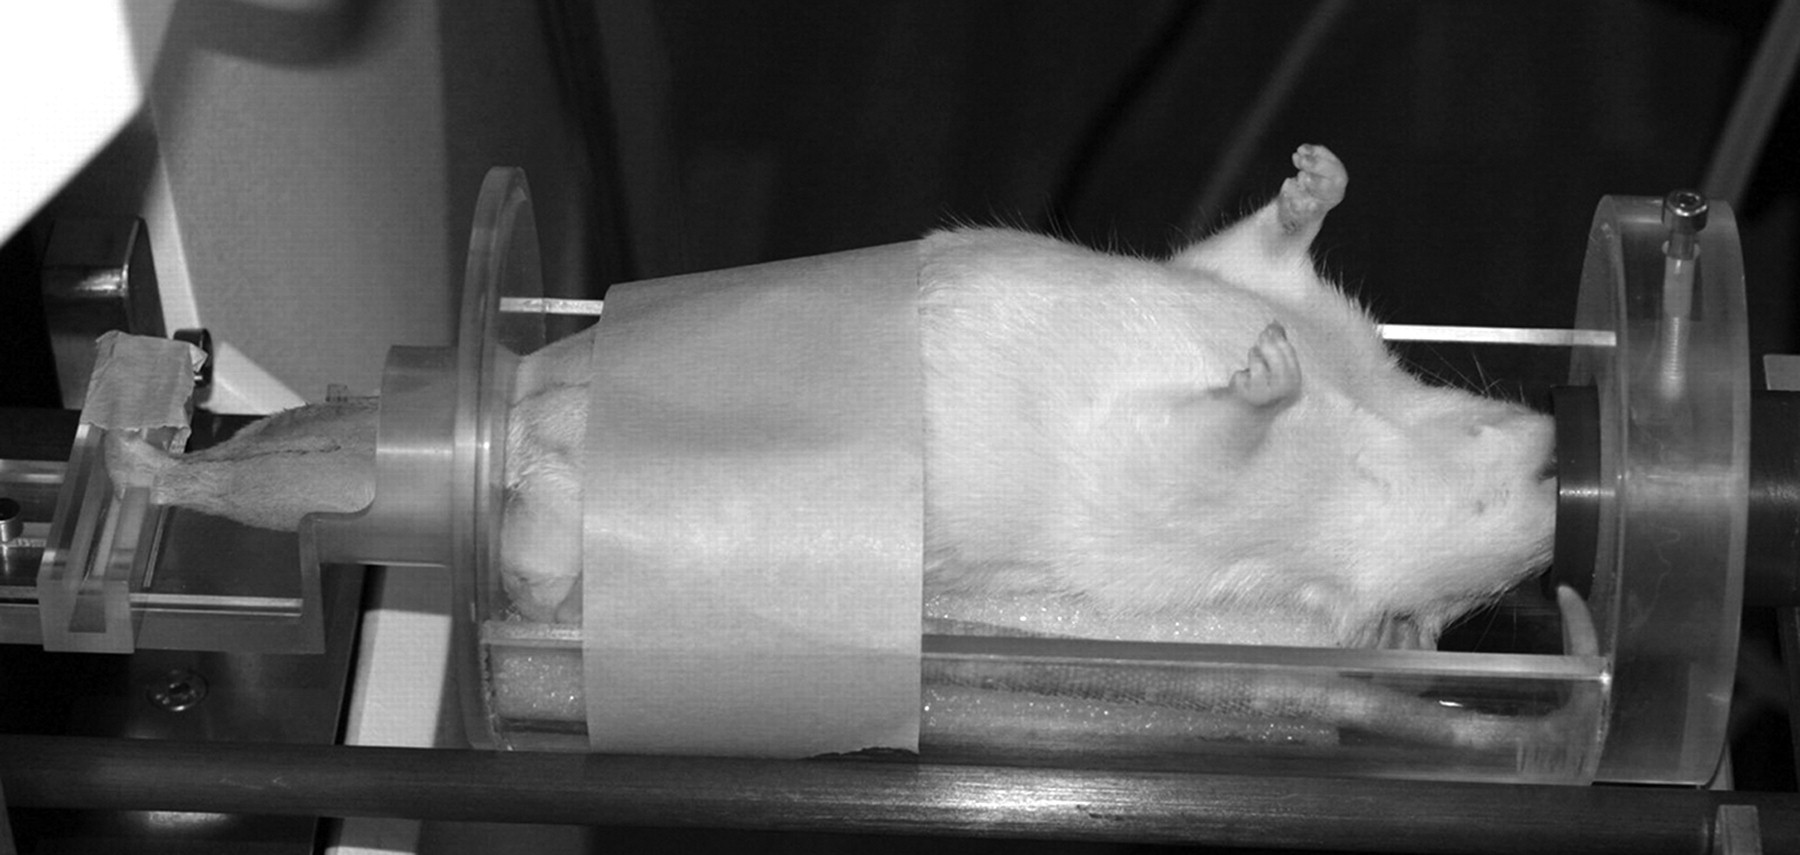
Custom-made acrylic holder used for consistent positioning of the distal rat femur during in vivo imaging with the peripheral quantitative computed tomography scanner
Micro-computed tomographic measurements
The femurs were also examined with a fan-beam micro-CT system (μCT40, Scanco Medical). This scanner was equipped with a micro-focus X-ray tube (5 μm spot size) and a two-dimensional detector array with 2048 × 256 elements. The postmortem harvested left femur was placed longitudinally into a cylindrical holder with a diameter of 16 mm filled with 70% ethanol. Analogous to the pQCT measurements, the distal femoral metaphysis was scanned, whereby in this case with a higher isotropic voxel size resolution of 16 μm. In total, 120 high-resolution slices (=2 mm length, same length as chosen for the pQCT) with a pixel matrix of 2048 × 2048 were measured using an effective energy of 70 keV and a current intensity of 114 μA. After preprocessing the images with the same Gaussian filter (Σ = 0.7, support = 1), a threshold was selected at 28% of the maximal grey-scale value, which corresponds to the peak for bone tissue in the histogram of the grey value distribution in the image. BMD as well as BV/TV were evaluated.
Volume of interest
For accurate matching of the volume of interest (VOI) between pQCT and micro-CT measurements in the axial direction, an anatomical reference point, i.e. the most proximal aspect of the distal femoral growth plate, was defined (Figure 2A). The VOI corresponded to a 2 mm length proximal to this landmark. Analysis was performed for the total cross-sectional area (including cortical and trabecular bone; defined as ‘out’) as well as for trabecular bone only. For the selection of trabecular bone, two different algorithms were used. With the first algorithm, the central 50% cross-sectional area was defined based on an automatic contouring procedure available from the built-in computer software of the manufacturer (defined as ‘d50’). In the second algorithm, the trabecular region was precisely contoured in each single cross-section manually (defined as ‘man_in’) (Figure 2C).
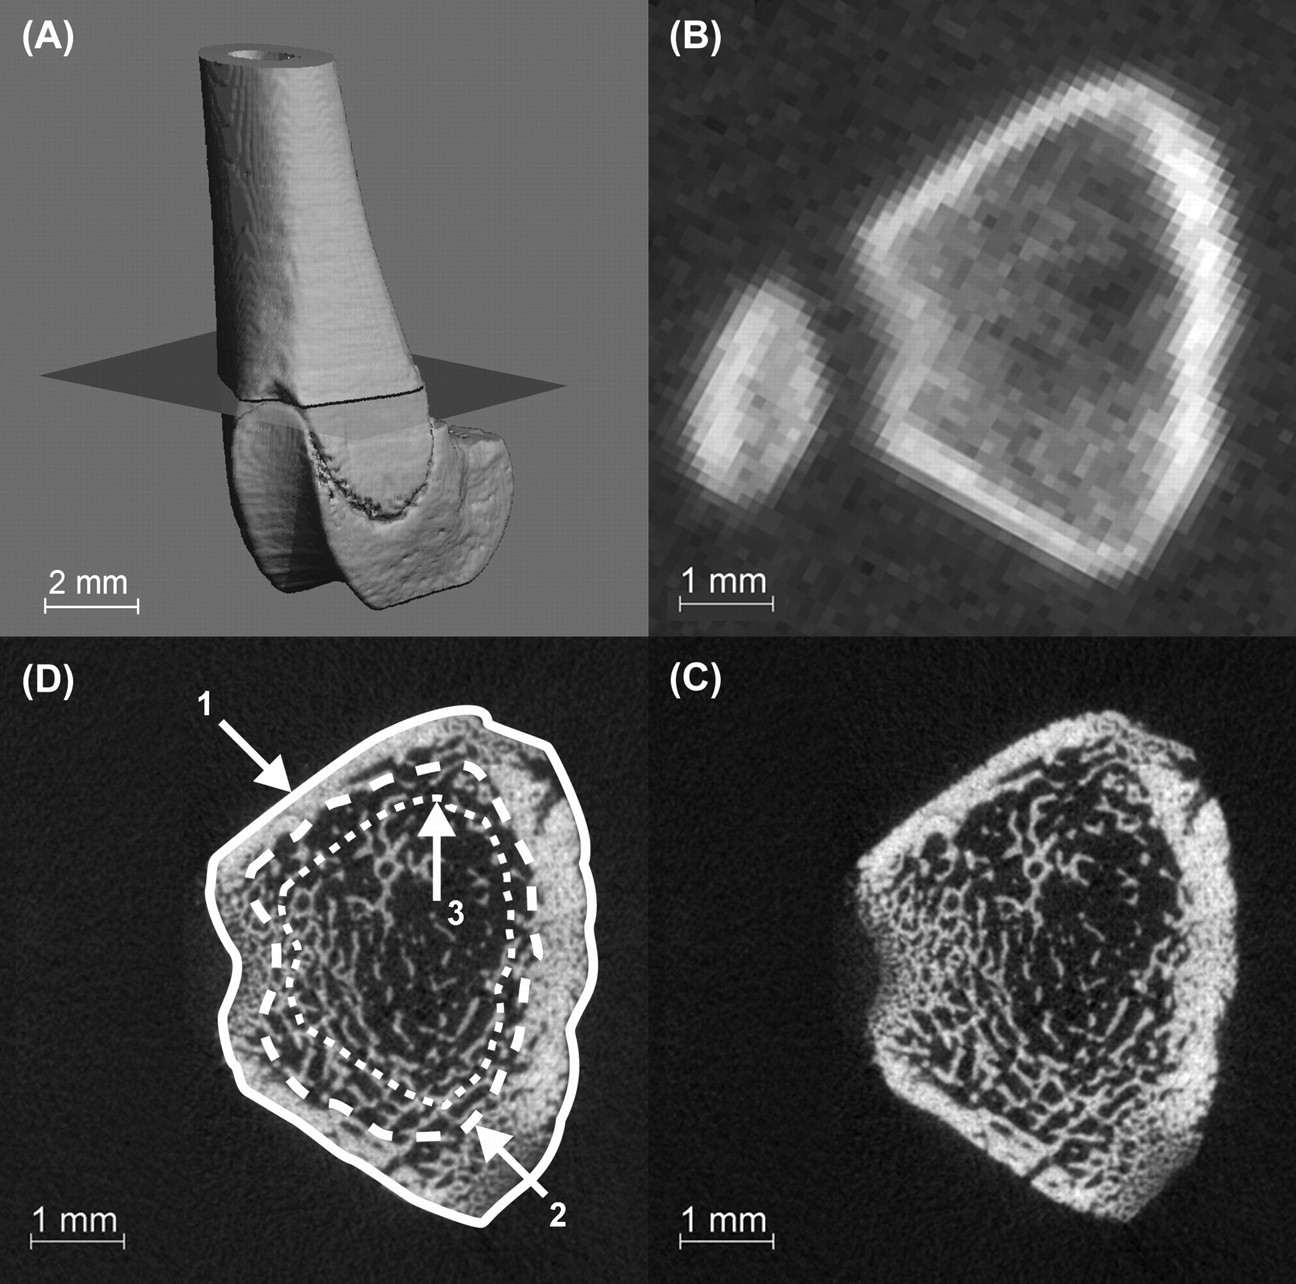
The distal half of the rat femur as imaged with the micro-computed tomography (micro-CT). The cutting plane indicates the most distal cross-section included in the volume of interest (VOI) (A). The corresponding pQCT cross-section image taken at the most distal aspect of the analysed VOI (B) and the corresponding micro-CT image (note the difference in resolution) (D). The three contours defining the VOIs: 1 = out, 2 = man_in, 3 = d50 (C)
Statistics
Analyses were carried out using SPSS software (SPSS Science, 14.0 for Windows; Chicago, IL, USA) and the significance threshold of P < 0.05 was applied. A paired sample t-test was used to detect differences between the baseline and the follow-up measurement of the sham and OVX groups and to evaluate differences between values assessed using the ‘d50’ and ‘man_in’. A repeated measures general linear model was used to compare differences in bone loss obtained with ‘out’, ‘d50’ and ‘man_in’. Tukey HSD post hoc test was used to examine the differences within each group. An analysis of variance was carried out to determine whether there were significant differences between bone loss measured in a longitudinal fashion (pQCT) vs. bone loss obtained from the comparison with an age-matched sham group (pQCT and micro-CT). If significant differences were detected, a Tukey HSD post hoc test was used to examine direct intergroup differences. A linear regression was also applied to evaluate the correlation between pQCT and micro-CT measurements as well as between the automatic (i.e. ‘d50’) and the manually defined areas of interest (i.e. ‘man_in’).
Results
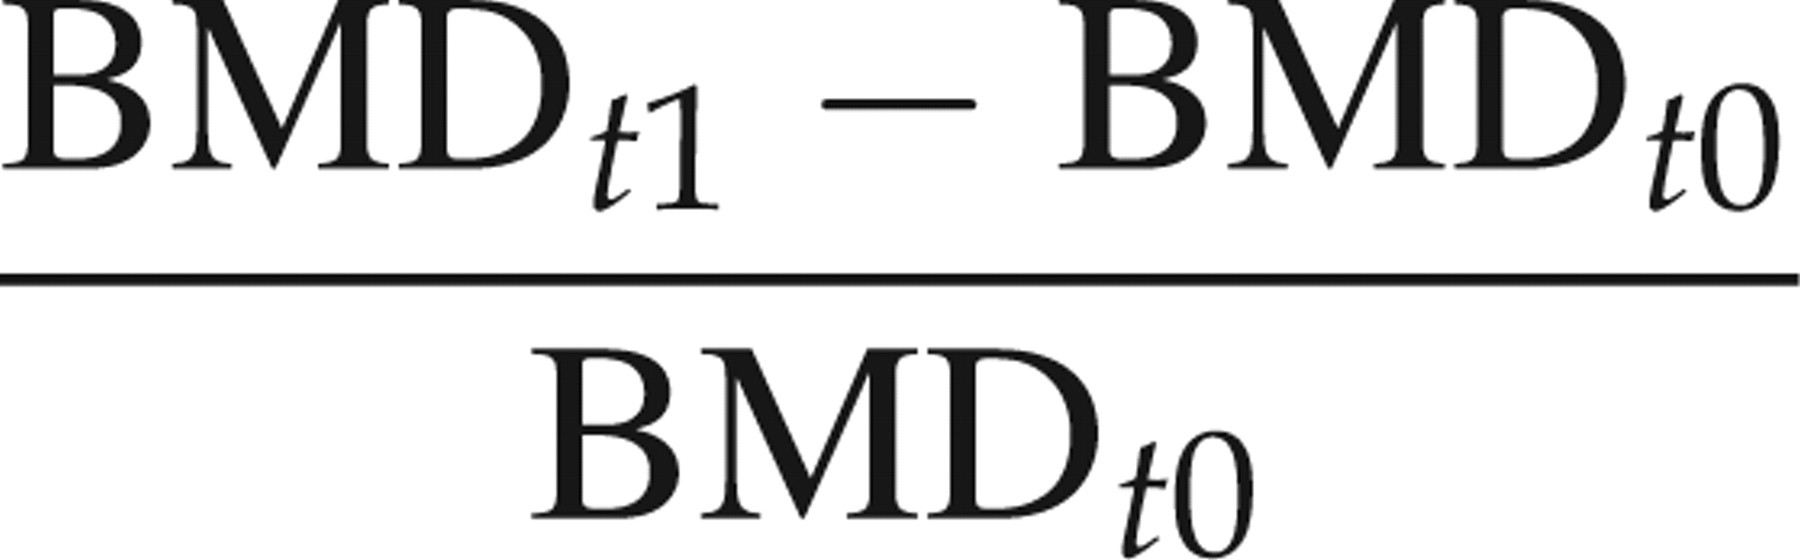
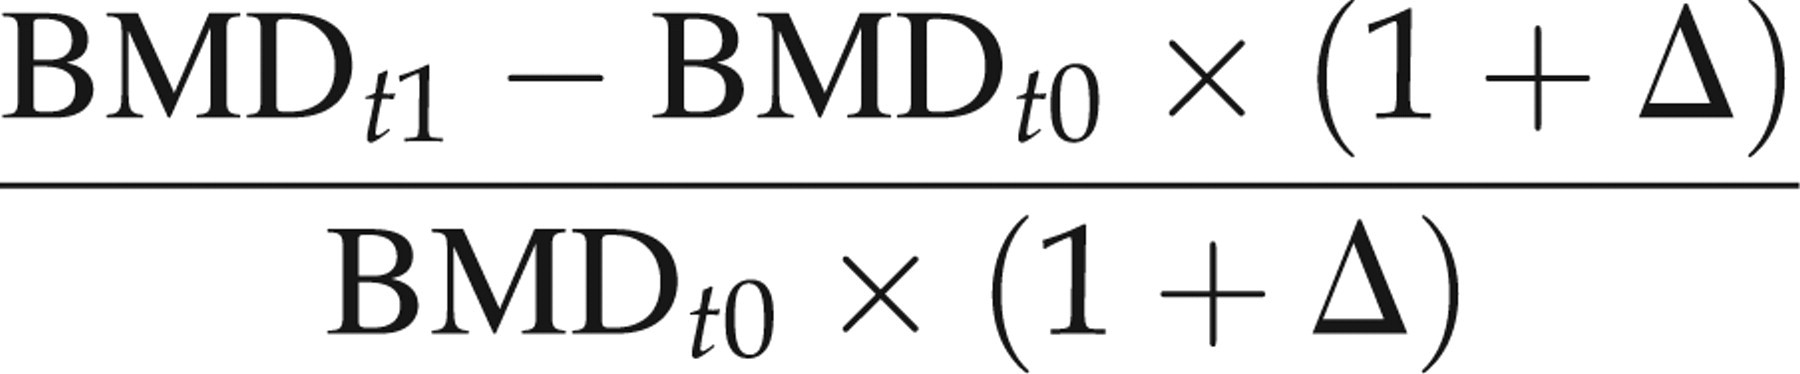
All animals survived the entire study period without unusual events. There was a significant increase in BMD from the baseline to follow-up pQCT in the sham animals in all defined VOIs. The expected decrease in BMD between the baseline and follow-up pQCT in the OVX animals was also significant for all VOIs (Table 1). As a consequence of those changes, the percentage bone loss assessed longitudinally was smaller than the bone loss measured between age-matched OVX and sham animals with the pQCT in terms of BMD as well as with the micro-CT in terms of BMD and BV/TV (Table 2, e.g. for ‘man_in’: 32.1% smaller than 37.9%, 36.0% and 44.5%, respectively). As the bone loss between the baseline and follow-up pQCT in the OVX animals did not take into account the significant bone growth detected in the longitudinal measurements of the sham animals, the longitudinal OVX bone loss was adjusted a posteriori by adding the mean bone growth of the sham animals to the BMD value of the baseline OVX rats (‘growth-corrected’ OVX in Table 2).
Longitudinal bone loss:
Bone mineral density (BMD) and bone volume/total volume (BV/TV) values from the ovariectomized (OVX) and sham-operated rats measured with peripheral quantitative computed tomography (pQCT) and micro-computed tomography (micro-CT)
Each value represents group mean ± SD (units: mgHA/ccm for BMD, ratio for BV/TV). t0 = 12 weeks, t1 = 16 weeks. Evaluation of three different regions of interest (out, d50, man_in). Paired t-test for pQCT measurements. Within a row, values bearing the same superscript letter are significantly different (P < 0.05).
*d50, an algorithm provided by the pQCT manufacturer, does not include the calculation of BV/TV
Post-ovariectomized (OVX) relative changes in bone mineral density (BMD) and bone volume/total volume (BV/TV) for the different volume of interests (out, d50, man_in) obtained from repeated measures (longitudinal) or age-matched comparison (cross-sectional) of peripheral quantitative computed tomography (pQCT) and micro-computed tomography (micro-CT) data
Each value represents mean ± SD in %. Longitudinal = relative change between 12- and 16-week-old rats. Cross-sectional = relative change between 16-week-old OVX and SHAM rats
*gc-OVX = growth-corrected OVX rat, i.e. the average amount of BMD increase
**d50, an algorithm provided by the pQCT manufacturer, does not include the calculation of BV/TV
With this adjustment, no significant differences were detected between the ‘growth-corrected’ longitudinal bone loss of the OVX animals (pQCT/BMD) in comparison with bone loss measured with the help of sham animals in any of the characterized VOIs (Figure 3).
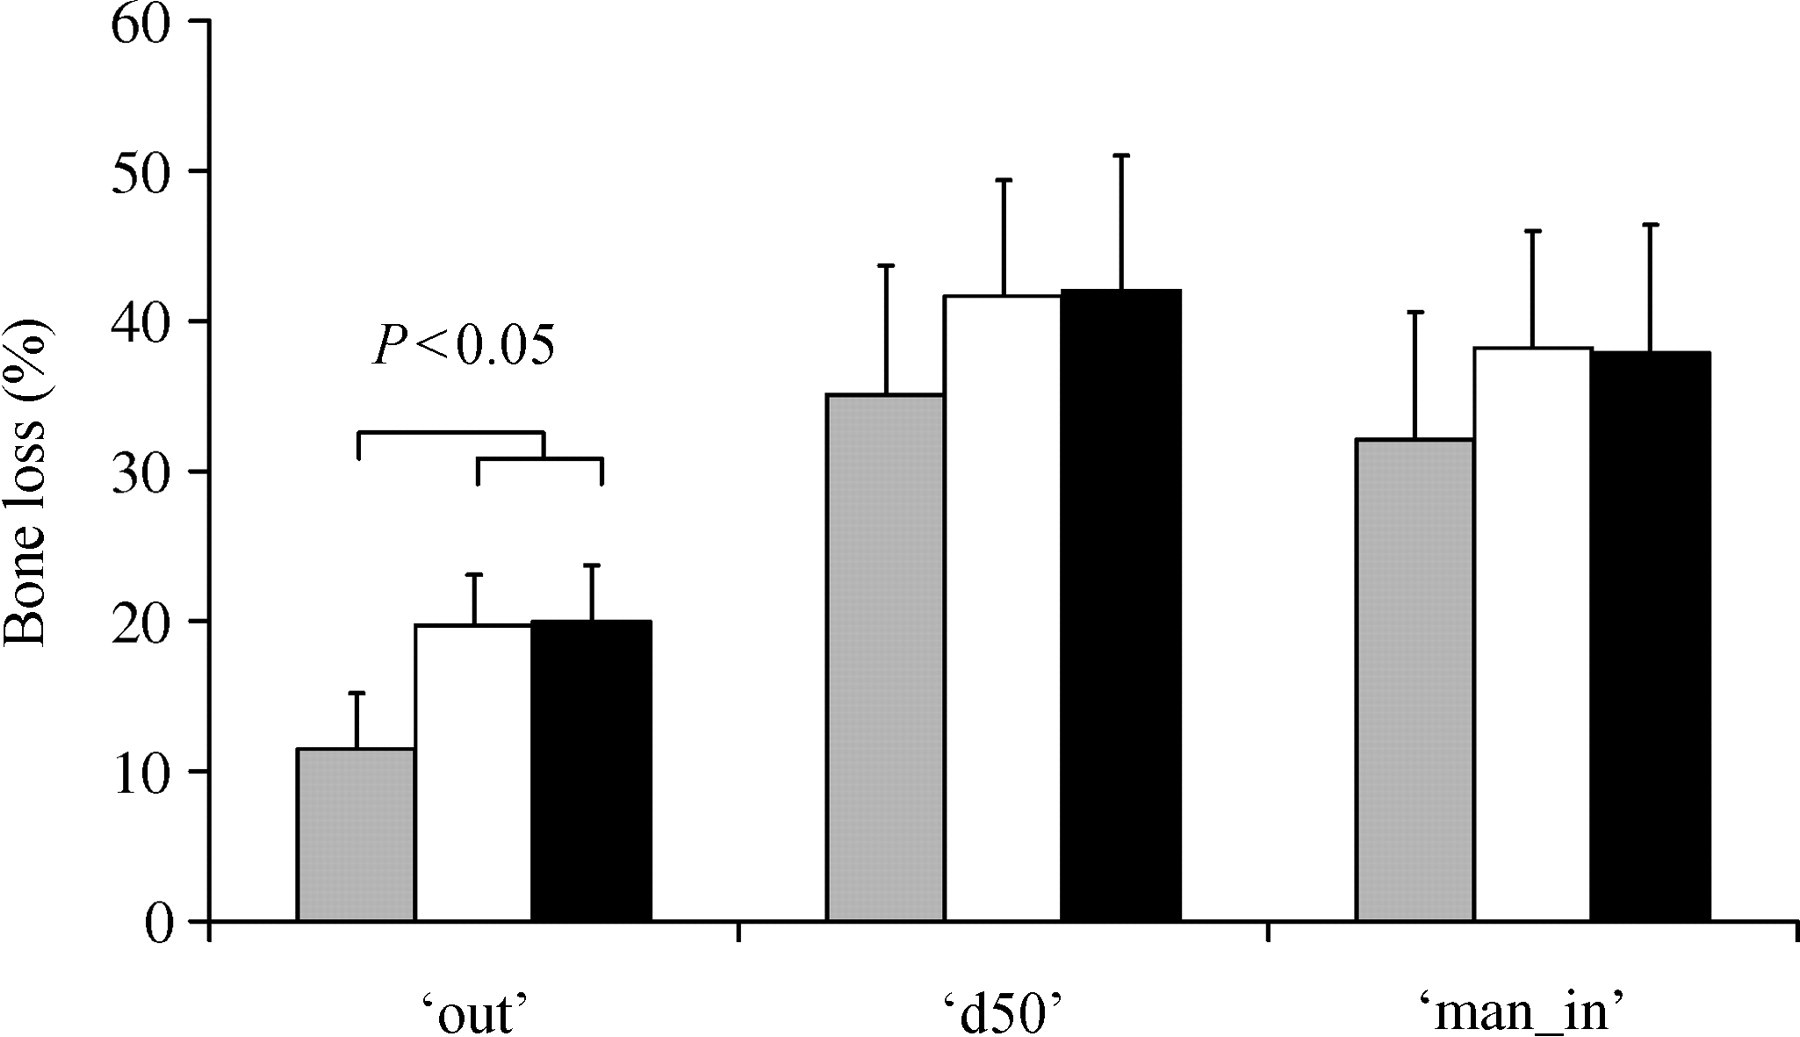
Post-ovariectomized (OVX) percentage bone loss relative to pre-OVX or SHAM. Mean ± SD (grey: longitudinal peripheral quantitative computed tomography [pQCT]; white: growth-corrected, longitudinal pQCT; black: age-matched pQCT)
The BMD values obtained from high-resolution micro-CT measurements showed significant (P = 0.001), strong correlations with those measured by lower-resolution pQCT (‘out’: R 2 = 0.99, ‘d50’: R 2 = 0.96, ‘man_in’: R 2 = 0.95) (Figure 4). Moreover, BV/TV measured with micro-CT also correlated significantly (P = 0.001) with BMD measured by the pQCT (‘out’: R 2 = 0.96, ‘man_in’: R 2 = 0.95) (Figure 5). As expected, the osteoporotic bone loss was always more pronounced when analysing the trabecular region only (‘d50’, ‘man_in’) than when examining the full cross-section (‘out’) (Table 2). There was also a significant difference in the evaluation of the trabecular region using ‘d50’ or ‘man_in’ (P = 0.001). However, both measurements showed a strong correlation to each other (R 2 = 0.98).
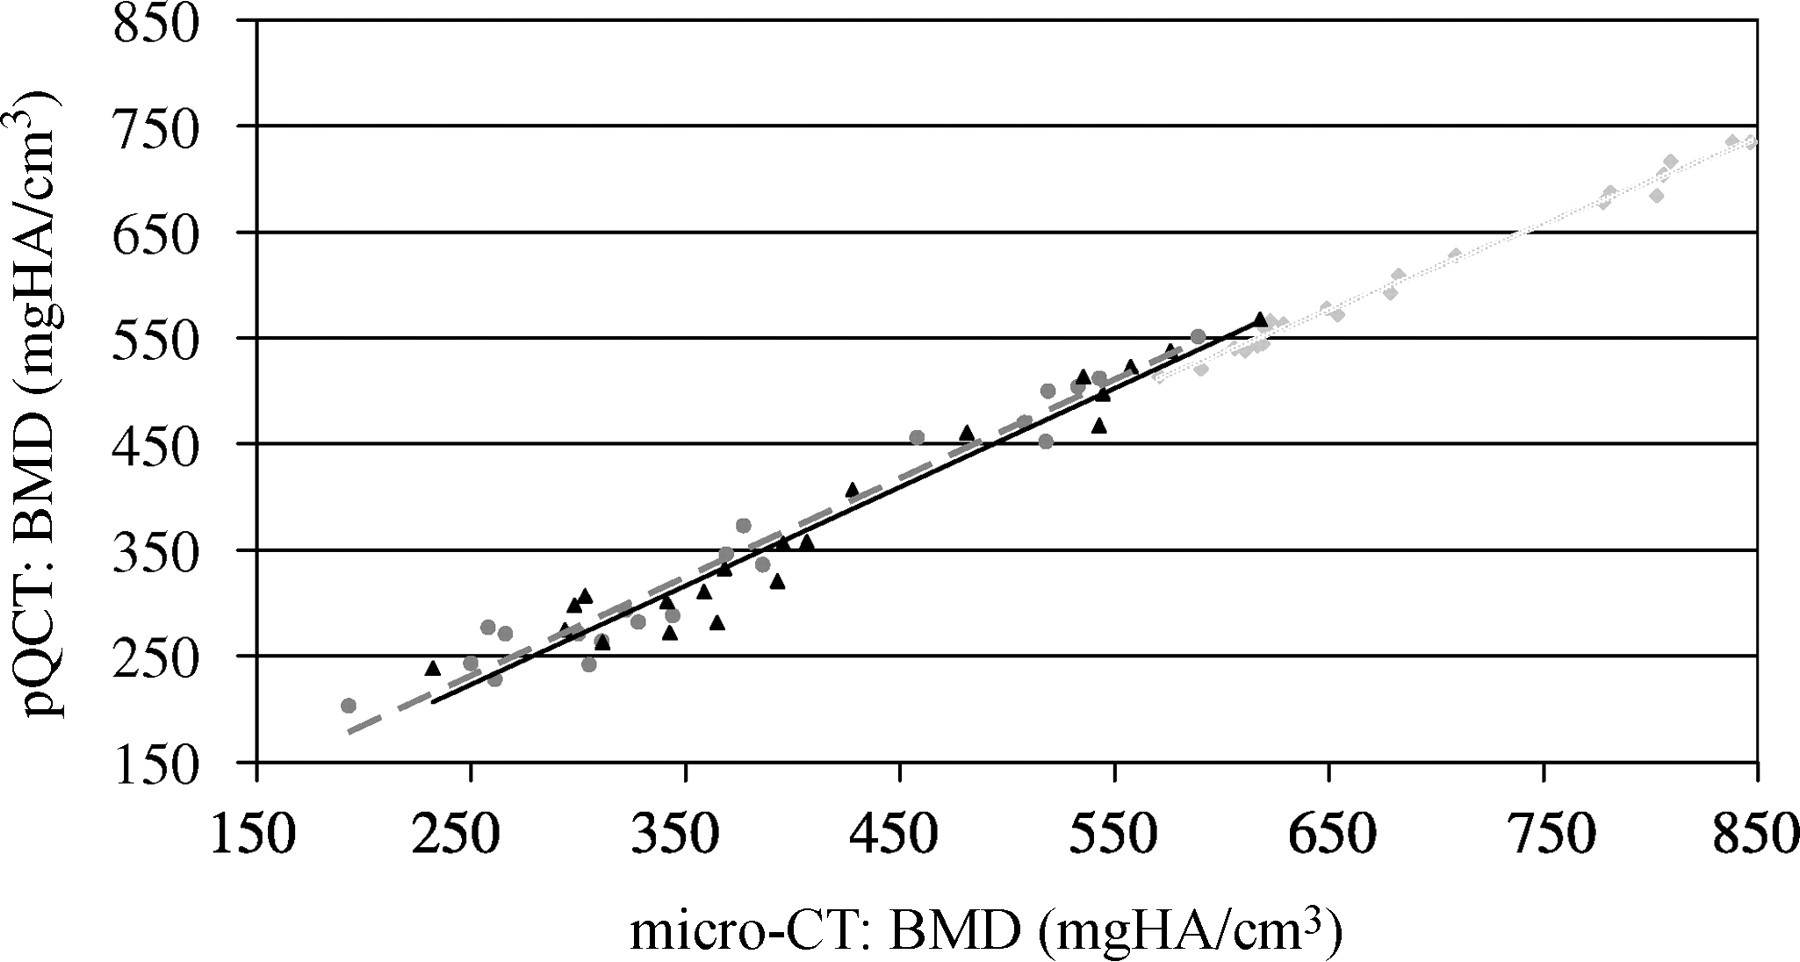
Correlation between micro-computed tomography (bone mineral density [BMD]) and peripheral quantitative computed tomography (BMD). Light grey square points: ‘out’ (R 2 = 0.99; y = 0.82 + 44.1); dark grey round points: ‘d50’ (R 2 = 0.96; y = 0.93 − 1.1812); black triangular points: ‘man_in’ (R 2 = 0.95; y = 0.93–9.29)
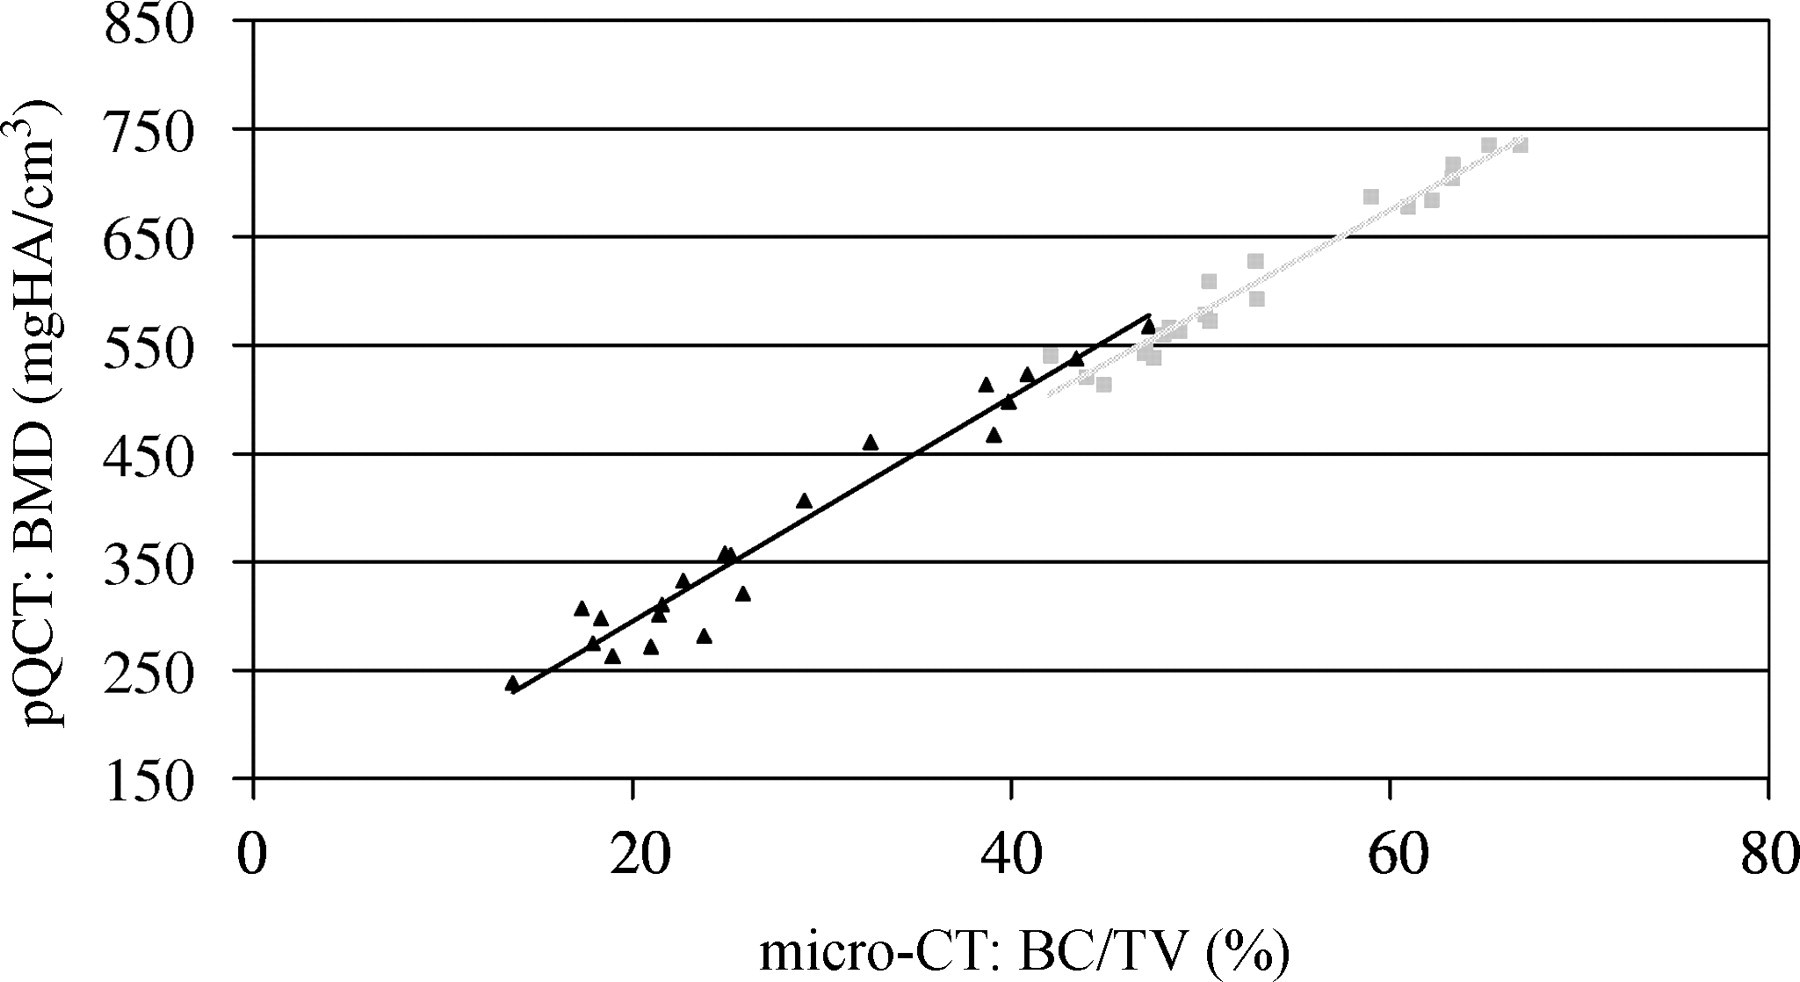
Correlation between micro-computed tomography (bone volume/total volume [BV/TV] %) and peripheral quantitative computed tomography (bone mineral density); light grey square points: ‘out’ (R 2 = 0.96); black triangular points: ‘man_in’ (R 2 = 0.95)
Discussion
BMD changes caused by OVX and simultaneous bone growth were determined in a longitudinal and age-matched fashion in 12–16-week-old rats. The OVX animals experienced a significant decrease in BMD after four weeks, while animals receiving the sham operation had a significant BMD increase in the same time period. The strong correlation between micro-CT and pQCT technologies obtained with our repeatable and consistent methodology demonstrate that in vivo measurements of bone BMD by pQCT are sufficient to assess changes in bone BMD over time. This study shows that changes in BMD in the still growing, but reproductively mature rat model based on age-matched controls or calculated by superposition of growth and OVX-induced resorption measured longitudinally lead to the same outcome. The exact information of percental bone loss/increase from pQCT data helps to better tune this OVX model in future studies on osteoporosis.
The post-OVX bone changes detected with repeated measures in still growing animals do not reflect the real ‘total’ bone loss. The difference between OVX-induced bone loss measured in a longitudinal fashion and bone loss detected in a comparative, cross-sectional way in a sham group is represented by the factor ‘growth’. This growth was monitored in an age-matched set of sham rats of the same outbred species. The same outcome was observed in each defined VOI and was also true for different outcome parameters (Table 1). By superimposing the average amount of bone growth to the bone loss measured longitudinally in the OVX group, the ‘growth-corrected’ bone loss was not different from that directly calculated in comparison with age-matched, sham-operated animals (Figure 3). This is especially important for using three-month-old rats in in vivo studies, where each animal can serve as its own control.
In this study, consistent differences in osteoporotic bone loss between the trabecular and the cortical region were identified, which is in agreement with the literature. 25 The detected bone loss of approximately 40% in the trabecular region matches previous findings where approximately 50% bone loss was reported after five weeks (Table 1). 12 The longitudinal bone growth of approximately 10% within four weeks in sham animals was statistically significant and stands in contrast to the previous literature where no bone volume changes were detected during 270 days of post-sham operation. The more accurate and consistent definition of the region of interest in our study may explain this discrepancy, whereby we always chose the exact same volume size and location. It must also be mentioned that Sprague-Dawley rats were used instead of Wistar rats. 13
Previous studies demonstrated a good correlation between micro-CT and pQCT evaluations in other mouse and goat animal models 23,24 and human specimens. 26 This is in accordance with our results in the OVX rat model. A strong correlation (R 2 > 0.95) resulted between the two CT scanners, independent of the chosen correlation parameter. Analysis of the trabecular region showed an even stronger correlation (R 2 > 0.95) than the results from a goat study with an R 2 of 0.7. 24 This probably points again to the relevant effect resulting from more precise and differentiated evaluations as used in this study. Besides minimizing the in vivo scanning protocol (i.e. minimized scanning volume means reduced exposure to radiation), the obtained changes in BMD better corresponded to changes in bone mineral content as well as changes in BV/TV from the micro-CT analysis.
In the past, with study designs based on in vitro, age-matched measurements, the number of animals needed was proportional to the number of time-points of interest, which often led to an increased number of animals used. In vivo analysis cannot replace the use of baseline and control animals, as age-related changes require monitoring. However, the big advantage of in vivo analysis like pQCT is that the amount of animals stays constant no matter how many time-points are of interest. Thus, animal use is directly reduced because of the experimental design and can also be additionally minimized due to increased sensitivity of statistical analysis based on repeated measures.
In conclusion, the outcome of this study provides new insights about bone changes in 12–16-week-old Wistar rats. It was demonstrated that for different but precisely and consistently defined regions of interest, the longitudinal effect of OVX and growth on BMD can be accurately measured by pQCT and simply superimposed. These data and methods can be applied as baseline information upon which future in vivo study designs using this rat model can refer to reduce the number of animals needed and to make decisions without using labour-intensive histological procedures.
Footnotes
ACKNOWLEDGEMENTS
The authors would like to thank the experimental surgery group and Ina Gröngröft for assistance with surgery.