
Abstract
Cephalopods are the first invertebrate class regulated by the European Union (EU) under Directive 2010/63/EU on the protection of animals used for scientific purposes, which requires prospective assessment of severity of procedures. To assist the scientific community in establishing severity classification for cephalopods, we undertook a web-based survey of the EU cephalopod research community as represented by the participants in the European COoperation on Science and Technology (COST) Action FA1301, CephsInAction'. The survey consisted of 50 scenarios covering a range of procedures involving several cephalopod species at different life stages. Respondents (59 people from 15 countries) either allocated a severity classification to each scenario or indicated that they were unable to decide (UTD). Analyses evaluated score distributions and clustering. Overall, the UTD scores were low (7.0 ± 0.6%) and did not affect the severity classification. Procedures involving paralarvae and killing methods (not specified in Annexe IV) had the highest UTD scores. Consensus on non-recovery procedures was reached consistently, although occasionally non-recovery appeared to be confused with killing methods. Scenarios describing procedures above the lower threshold for regulation, including those describing behavioural studies, were also identified and allocated throughout the full range of severity classifications. Severity classification for scenarios based on different species (e.g. cuttlefish vs. octopus) was consistent, comparable and dependent on potentially more harmful interventions. We found no marked or statistically significant differences in the overall scoring of scenarios between the demographic subgroups (age, sex, PhD and cephalopod experience). The COST Action FA1301 survey data provide a basis for a prospective severity classification for cephalopods to serve as guide for researchers, project assessors and regulators.
Introduction
Prediction of the likely effects of experimental scientific procedures on live animals is a requisite of the European Union’s (EU) Directive 2010/63/EU for the protection of animals used for scientific purposes. 1 When planning experiments, all procedures considered to be above the lower threshold for regulation should be classified into the categories ‘non-recovery’, ‘mild’, ‘moderate’ or ‘severe’ (as required by Article 15 of Directive 2010/63/EU). Prospective assessment and assignment of severity based on the worst expected outcome for any animal undergoing the procedure must be included in applications for project authorisation,1,2 and the actual severity experienced by each individual animal which has undergone the procedure must be documented and reported accordingly (as required by Articles 38, 39 and 54).
Severity assessment is also an essential aspect of the 3Rs (reduce, refine, replace) principle, which is at the core of the Directive (Article 1) and is considered fundamental for experimental biology. 3 Adequate assessment of severity classification is an important element in promoting good animal welfare, but it is also important for scientific validity of the study, since physiological and behavioural responses to any putative suffering, if not adequately assessed, may affect data quality and outcomes. Prospective severity classification is pivotal for good scientific study and fundamental to inform the harm–benefit analysis undertaken by regulatory bodies and ethical and institutional review committees. 4
The inclusion of live cephalopods (nautiloids, cuttlefish, squid and octopus) in Directive 2010/63/EU 1 brought, for the first time, a class of invertebrate animals (Phylum Mollusca: Class Cephalopoda) within the scope of legislation regulating the use of animals for scientific and educational purposes. The term ‘live cephalopod’ operationally includes all species (∼800 known)5–7 from hatching.2,8–10 In Europe, a limited number of cephalopod species are currently utilised, including the common cuttlefish Sepia officinalis, the bobtail squid Euprymna scolopes, the European squid Loligo vulgaris and the octopuses Octopus vulgaris, Eledone cirrhosa and Eledone moschata. 11 Analysis of cephalopod research assessing the potential impact of Directive 2010/63/EU identified multiple studies, including procedures which would now fall within the scope of the Directive. 12
Directive 2010/63/EU (Article 3) defines the threshold for regulation as a procedure ‘which may cause pain, suffering, distress or lasting harm equivalent to, or higher than that caused by the insertion of a hypodermic needle in accordance with good veterinary practice’. 1 There is clear evidence that cephalopods may be utilised for scientific purposes in a large number of studies in which this regulatory threshold is likely to be exceeded.2,9,12
Although the European Commission Working Group guidance on severity classification13,14 is of general applicability to cephalopods, the illustrative examples are exclusively based on laboratory mammals, 14 and this is also the case for the FELASA/ECLAM/ESLAV Working Group report published in 2018. 4 For fish, the paucity of guidance on severity classification was recognised in 2009 by the Norwegian Consensus-Platform for the 3Rs (Norecopa) that established a Working Group to produce guidance on severity classification for scientific procedures involving fish. 15 Even in the UK, where O. vulgaris has been regulated since 1993, 11 neither in the current transposition of the Directive nor in the Code of Practice for the Housing and Care of Animals Bred, Supplied or Used for Scientific Purposes is there information on severity classification applicable to any cephalopod (https://www.gov.uk/government/uploads/system/uploads/attachment_data/file/388535/CoPanimalsWeb.pdf).
Similarly to what was achieved by Norecopa, 15 the COST Action FA1301 ‘A network for improvement of cephalopod welfare and husbandry in research, aquaculture and fisheries (CephsInAction)’ initiated an activity specifically designed to derive a preliminary guidance document on prospective severity classification of procedures (within the meaning of Directive 2010/63/EU) for cephalopods to facilitate and act as a reference for project applications to the National Competent Authority (NCA). This initiative was carried out as part of those planned within the aims of COST Action FA1301-Working Group 4 (Cephalopod Welfare) dedicated to facilitate and promote a collaborative framework for increasing knowledge on biological, physiological and behavioural aspects of cephalopods’ welfare. Different from the approach used by Norecopa (a meeting with a published consensus statement), 15 COST Action FA1301 CephsInAction launched a Prospective Assessment of Severity Survey (PAS-C Survey), applying a Delphi methodology in the initial stages in order to develop a consensus on prospective severity classification of regulated procedures using cephalopod molluscs (www.cephsinaction.org/activities/projects/pas-c/). The PAS-C Survey comprised 50 scenarios, each giving a brief description of a procedure based on the literature. Scenarios contained sufficient information to make an assessment, and supporting notes and definitions were provided to help respondents identify the main issues to consider in making the assessment.
Here, we report and analyse the outcomes of the PAS-C Survey in order to (a) identify examples of procedures in cephalopods in each of the prospective severity categories, (b) identify procedures where severity classification may be difficult and (c) provide researchers, project reviewers and regulators with examples of procedures in each severity category to inform allocation of prospective severity classifications.
Methods
The approach followed here differs from the approach adopted by Norecopa 15 by using a PAS-C Survey with the initial survey design inspired by the Delphi method,16,17 that is, which aims to obtain a reliable opinion consensus on draft scenarios from a group of experts by subjecting them to a series of questionnaires interspersed with controlled opinion feedback. As described below, we carried out rounds of a modified Delphi process to develop the survey scenarios. 17
Scenarios are based on data derived from a non-systematic review of the use of live cephalopods in studies published between 1940 and 2014, including biochemistry, physiology, immunology, neuroscience, eco-toxicology and behavioural sciences. Procedures were selected for inclusion in the scenarios by the senior authors of this paper with the intention of encompassing the full range of possible severities, and were also based on a preliminary list in Fiorito et al. 12
A critique of the methodology is included in the Discussion.
Survey development
Proof of concept (first round of Delphi approach)
The principle of using hypothetical scenarios based upon the literature was tested on four national regulators (the UK and the Irish Republic) using a pilot of 10 scenarios. Responses and feedback were assessed and informed the drafting of additional scenarios.
Drafting and revision of scenarios for the survey (second round of Delphi approach)
Sixty-three scenarios and guidance notes were piloted on a group that included a graduate student studying animal welfare (the UK), a postdoctoral cephalopod researcher (Italy), a regulator (the UK), two veterinarians (the UK and Italy), an aquarium technician (the UK) and established researchers (France, Italy, Norway, Portugal and the UK). Scenarios with >60% consensus in any severity category were included in the final survey, with modifications as required. Questions with <60% consensus were redrafted based on feedback and sent out for further review. Fifty scenarios were selected for the final PAS-C survey with the intention of covering the full range of severity classifications.
List of cephalopod species and relative life stages included in the 50 scenarios of the COST Action FA1301 PAS-C Survey.
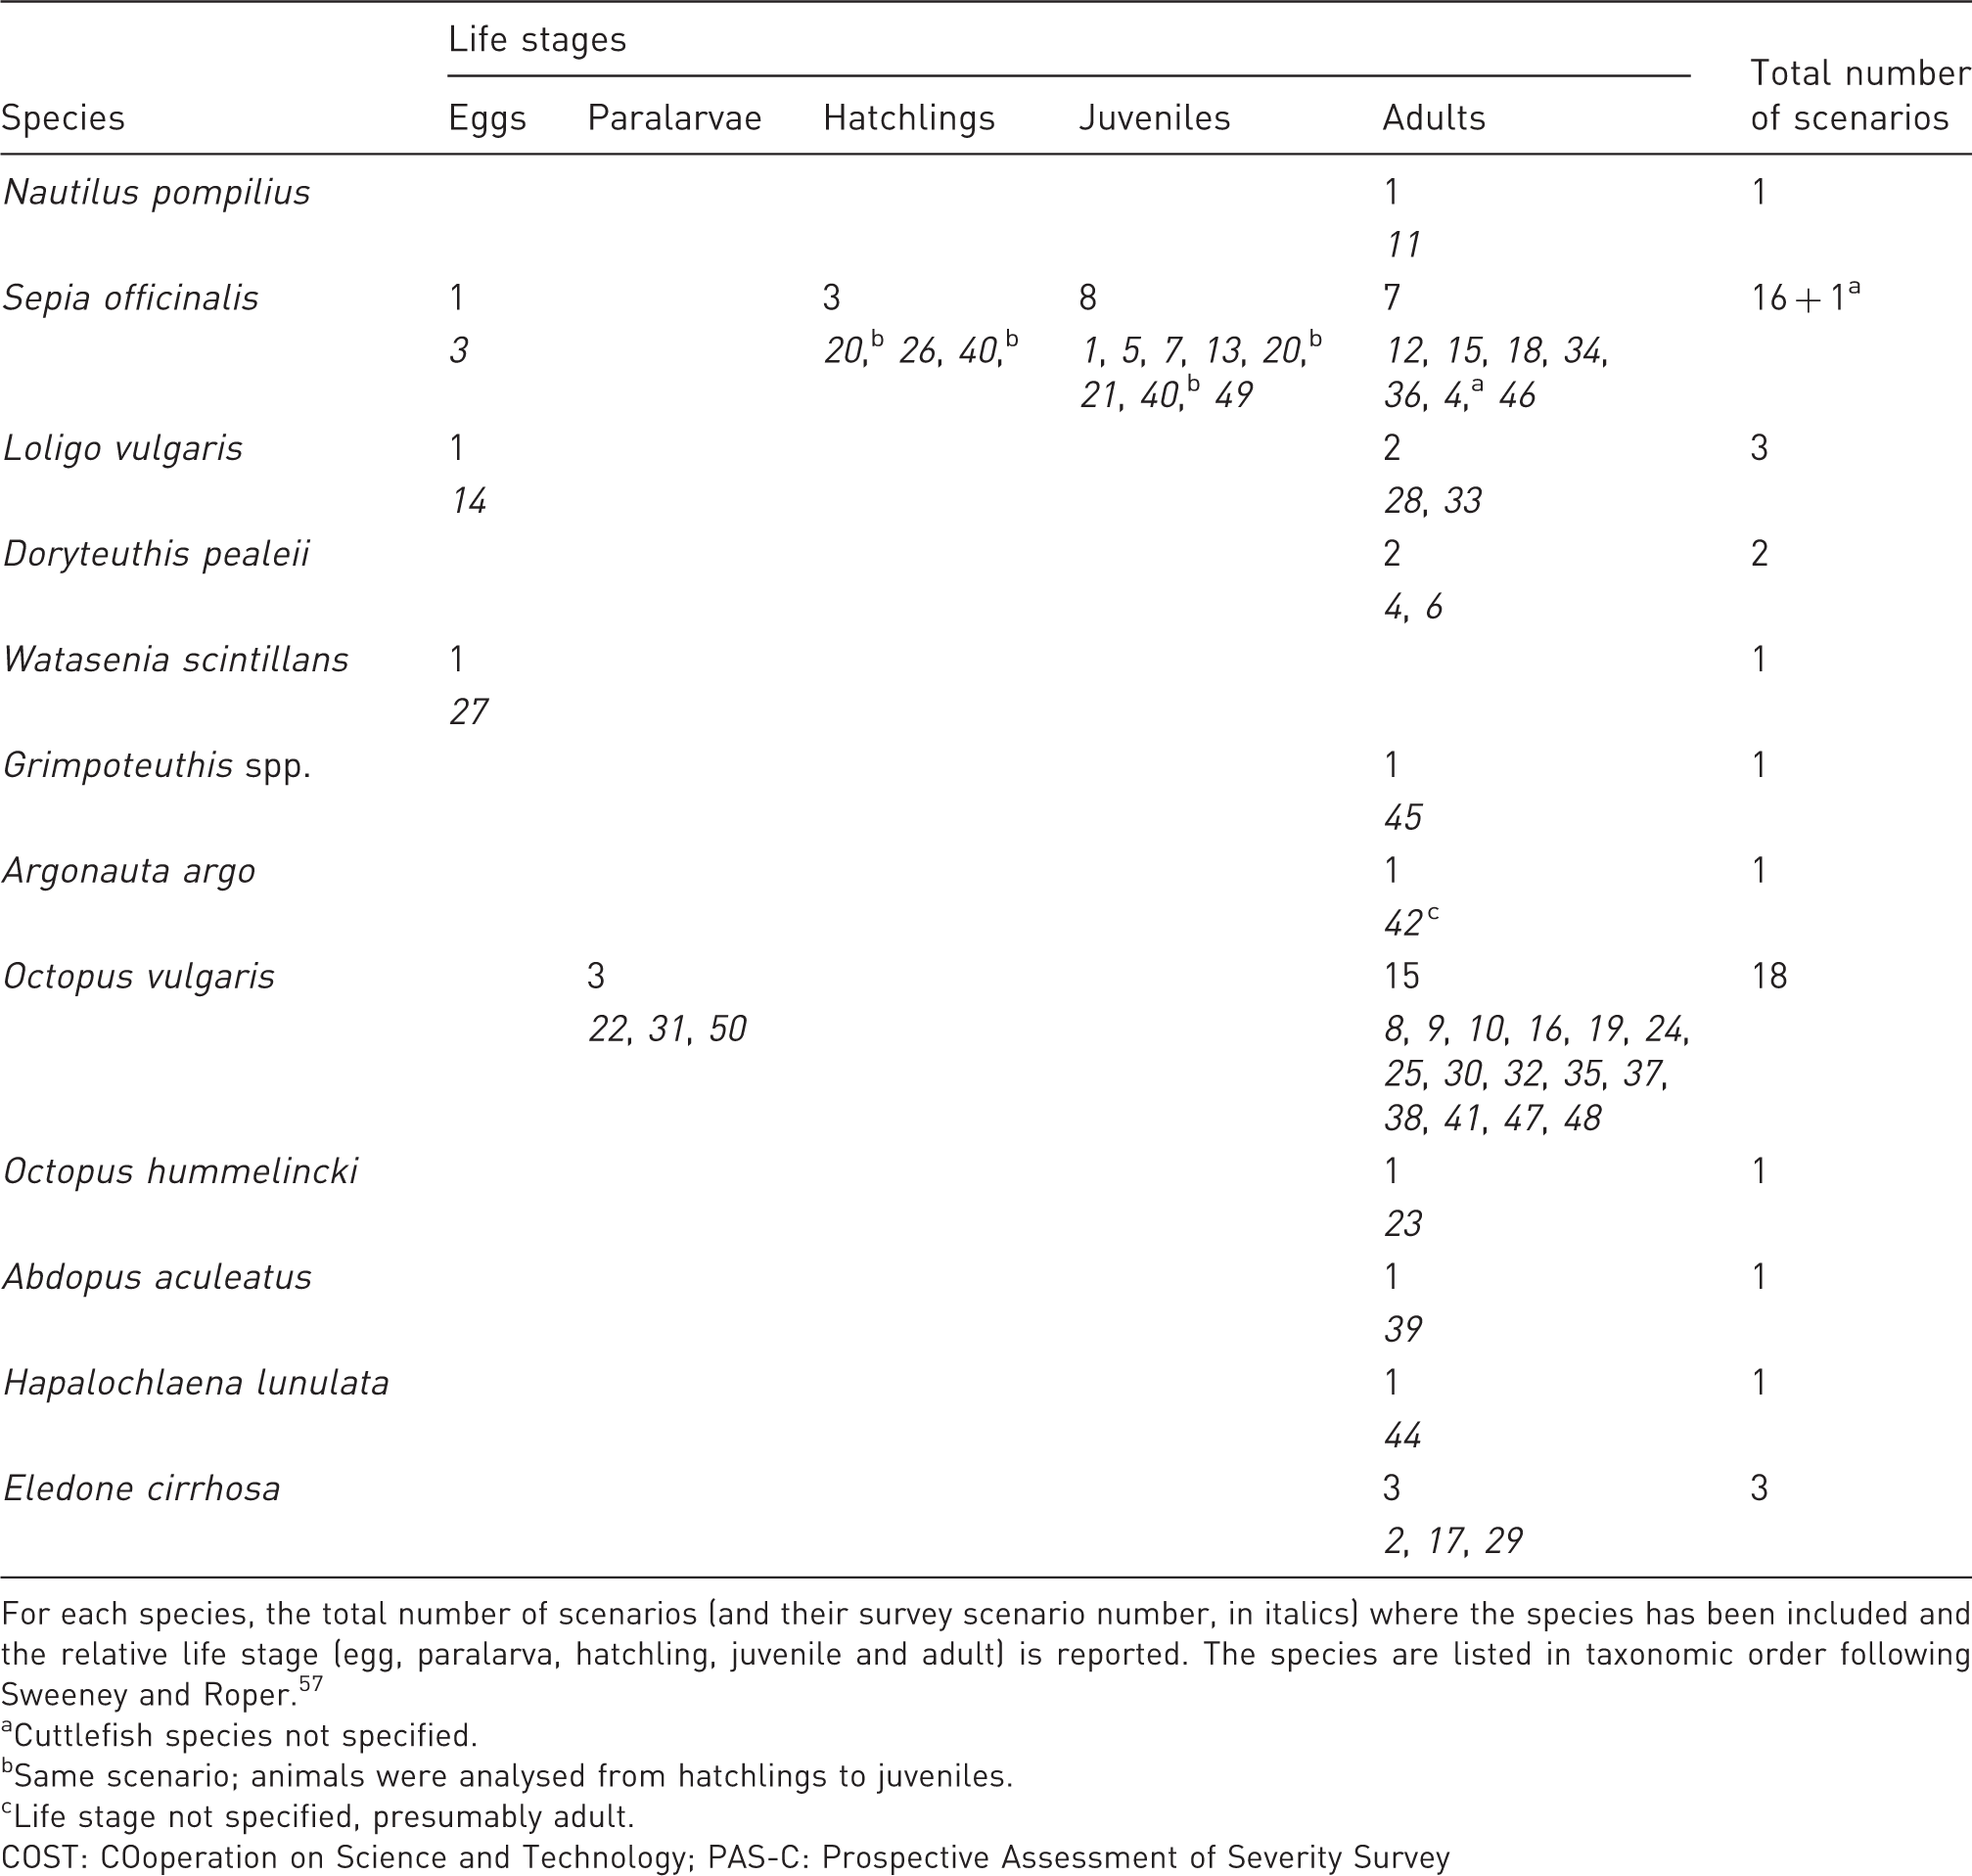
For each species, the total number of scenarios (and their survey scenario number, in italics) where the species has been included and the relative life stage (egg, paralarva, hatchling, juvenile and adult) is reported. The species are listed in taxonomic order following Sweeney and Roper. 57
Cuttlefish species not specified.
Same scenario; animals were analysed from hatchlings to juveniles.
Life stage not specified, presumably adult.
COST: COoperation on Science and Technology; PAS-C: Prospective Assessment of Severity Survey
Killing is not a regulated procedure under Directive 2010/63/EU provided that Article 6 and Annexe IV are followed. However, as Annexe IV does not specify any method for cephalopods, we included four examples of killing methods in the scenarios to obtain a view from the community about their likely severity and to inform discussions of amendments to Annexe IV.
All the scenarios were considered to contain sufficient information to make a judgement about the procedure described. Variations around the same scenario were used to obtain insights into the factors influencing severity classification and to check internal consistency.
Unable to decide category
This category was used to help identify scenarios where there was unintended ambiguity in the question or inadvertent omission of sufficient information to make a decision despite careful screening or where respondents felt that they were really unable to make a clear judgement.
Guidance notes
To help and inform recipients of the survey, guidance notes were provided (see Supplemental Material). These included:
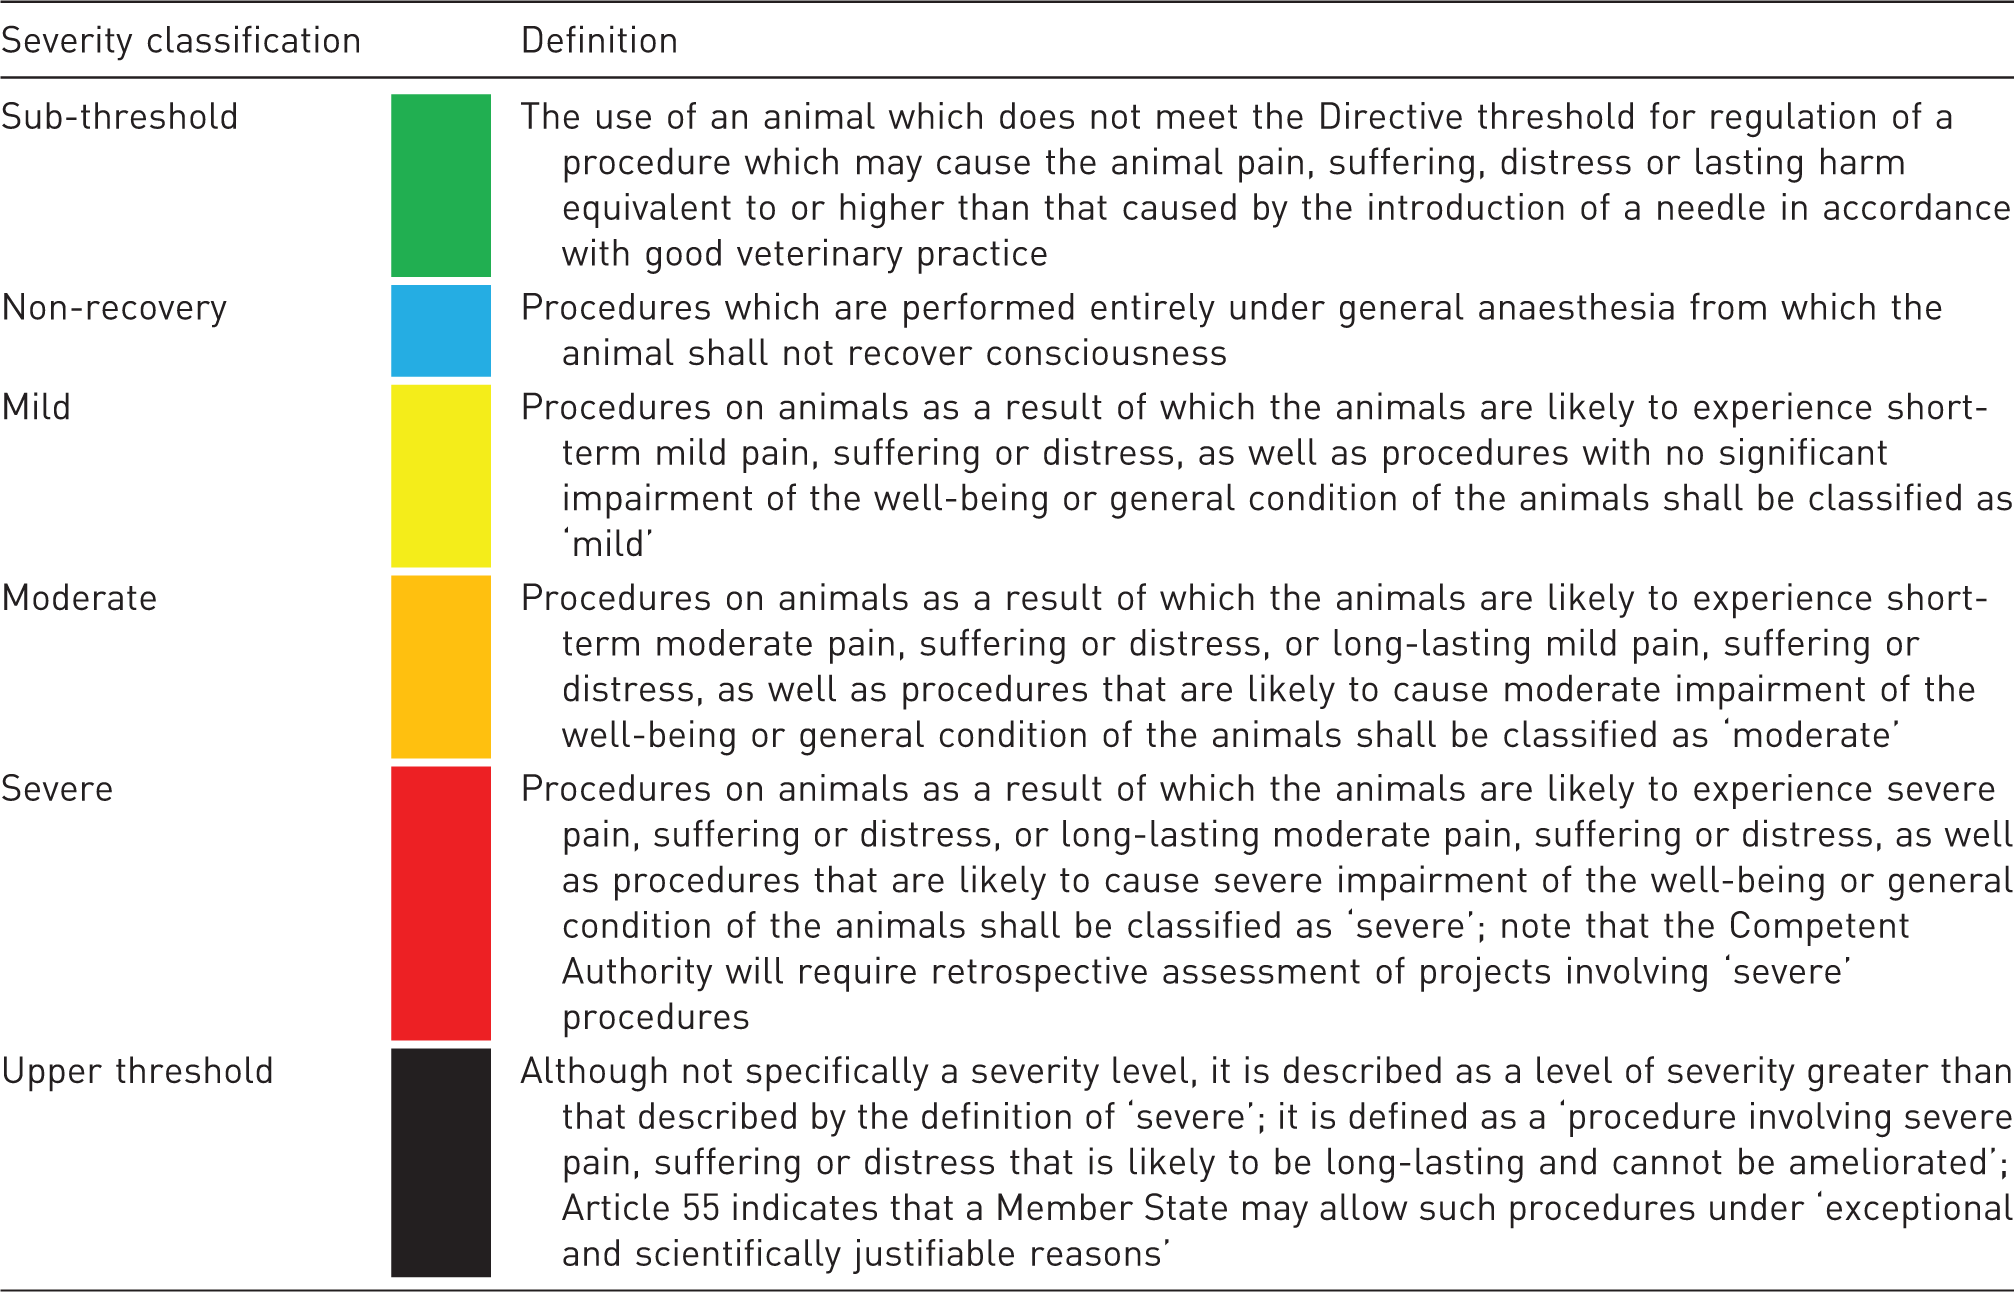
Instructions. These indicated that only one answer should be given and that if it was not possible to reach a clear decision about a category, then the ‘unable to decide’ (UTD) category should be used. Emphasis on making the prospective classification based upon the ‘highest severity anticipated for any animal’. Definitions of the severity classifications. Definitions of sub-threshold, non-recovery, mild, moderate and severe classifications were provided based on Annex VIII of Directive 2010/63/EU.4,13,14,18 The list of definitions provided as guidance is included in Table 2. An upper threshold category was included to provide an insight into procedures which the respondents considered to exceed the severe classification and hence may not be acceptable or justifiable (see Table 2). It should be noted that procedures with this classification would not normally be authorised (see Directive Article 55.3). The inclusion of an upper threshold aligns with the range of classifications used in the Norecopa report on severity assessment in fish.
15
Factors to take into account. This was based on Directive 2010/63/EU Annexe VIII and the EC Severity Assessment Framework.
14
A list of general assumptions. This broadly covers contingent suffering and includes handling of the animal, methods of anaesthesia and postoperative recovery. The assumed competence of all personnel caring for the animals or performing procedures was also noted.
Personal profile
Online PAS-C survey
Fifty scenarios, ranging in length from 18 to 292 words (median 108 words), were delivered online via the COST Action FA1301 website (www.cephsinaction.org/activities/projects/pas-c/; see Supplemental File 2). Scenarios were presented in 10 tabs, with five scenarios per screen page. The guidance and definitions pages were always accessible. Scenarios could be completed in any order and answers saved and modified at any time until submission.
The survey was accessible to all COST Action FA1301 CephsInAction participants who were emailed directly to inform them of the survey launch. This activity and the general principles included in the PAS-C survey were approved by the COST FA1301 management committee. Consent by the COST Action FA1301 CephsInAction participants was implied by responding to the survey.
The online platform including the survey was open for three months (July–September 2015) with several reminders sent. At the end of the time, the online survey was closed, and all responses and personal profile information were downloaded from the website and processed into a form suitable for numerical analysis. Any individual identifiers were not included in the download. Initial processing was by personnel not involved in the analysis of the data. The sorted anonymised raw data were then analysed.
Analysis of data
Demographics of respondents
The limited set of personal data (i.e. personal profile information) was used to investigate whether there was any relationship between the overall severity classification (see below) for scenarios and age, sex, possession of a PhD, number of publications or experience with cephalopods (as defined in the survey).
The subgroups for the dichotomous variables of sex, PhD and cephalopod experience were fortuitously reasonably balanced, with almost equal numbers in the subgroups. To generate balanced subgroups for the continuous variables of age and publication number, we used a median split. Seven respondents had a veterinary qualification, but this subgroup was too small for a meaningful subgroup analysis (seven respondents with veterinary qualification vs. 52 without; see Supplemental Data).
Population responses to individual questions
For each scenario, we initially analysed the percentage of respondents answering in each of the seven (UTD, sub-threshold, non-recovery, mild, moderate, severe and upper threshold) answer categories. The scores were used to classify a scenario using dendrogram analysis (see ‘Allocating procedures to severity categories’ below) and the scenario score profile (by bar and radar plots; see below).
Although non-recovery is in the list of prospective severity classifications, it is not part of a graded sequence of severity from sub-threshold (below the lower threshold for regulation) to the upper threshold. Therefore, we recalculated the percentage responses for all scenarios (except the three scenarios assessed as non-recovery) excluding the non-recovery scores for the 47 scenarios that were clearly not in this category. Subtraction of the non-recovery scores had no significant impact on the mean scores in each category over all 47 scenarios not in the non-recovery category (data not shown). The scores for 47 scenarios without the non-recovery scores were used in radar plots and also to calculate a single score for each scenario to enable comparison between subgroups and ranking of scenarios (see ‘Allocating procedures to severity categories’ and ‘Numerical scoring of scenarios for comparison of subgroups’ below).
Allocating procedures to severity categories
Three approaches were used to allocate scenarios to a particular severity classification. First, two authors (G.C. and P.A.) independently reviewed the radar plots and the score profiles for each scenario. This allowed classification of scenarios where this was clear from the dominant category score and distribution of scores in adjacent categories. In the case of ambiguity, intermediate classifications (e.g. sub-threshold/mild, mild/moderate, moderate/severe) were allocated initially. Any scenario where allocation was not possible was placed initially in an ambiguous category.
Second, the distribution of the percentage scores in each of the main and intermediate severity classes was averaged for each group of scenarios and the distribution of scores plotted.
Third, although the method above reflects the way in which a committee or project evaluator might arrive at a decision, it could be argued that it involves some degree of subjective judgement. So, dendrograms were constructed following an average linkage method19,20 by using PASW Statistics for Windows v18.0 (SPSS, Inc., Chicago, IL). The average linkage method was applied to the percentage scores in each of the categories for each scenario, and this allowed clustering of the data (i.e. scenarios).
Numerical scoring of scenarios for comparison of respondent subgroups
Comparison of the responses to each of the scenarios between the demographic subgroups requires a single numerical score for each scenario.
In brief, we recalculated the percentage responses, excluding the non-recovery scores for the 47 scenarios that were clearly not in this category. To derive the single numerical score for each scenario, we used the percentage score in each category and multiplied it by 1 for UTD (the impact of the UTD score is minimal for most scenarios), 3 for sub-threshold, 5 for mild, 7 for moderate, 9 for severe and 11 for upper threshold, and then we summed the scores. This transformation had no significant impact on the overall severity score for the scenario. Thus, if all (100%) respondents were UTD on a severity category, the score would be 100. Similarly, for complete agreement on a scenario describing a sub-threshold study, it would be 300, and for mild, it would be 500. The highest possible score for any scenario would be 1100 if all respondents agreed that the scenario was in the upper threshold category.
The summed scores ranged from 332 (scenario 2) to 940 (scenario 43; the maximum possible score being 1100). These single values for each scenario: (a) have been utilised exclusively for comparison of demographic subgroups and to rank scenarios and (b) have not been used to determine severity classifications, which are only allocated using the original percentage responses in the survey (see ‘Population responses to individual questions’ and ‘Allocating procedures to severity categories’ above).
Statistics and data analysis
Descriptive statistics were used to describe participants’ demographic characteristics and responses to scenarios. Further information on data processing and analysis are provided above and in particular for the analysis of (a) demographic data (see ‘Personal profile’ and ‘Demographics of respondents’) and (b) responses and their allocation to severity categories (see ‘Population responses to individual questions’, Allocating procedures to severity categories’ and ‘Numerical scoring of scenarios for comparison of subgroups’). Whenever appropriate, we reported the number of respondents to a particular scenario, personal profile question or number of scenarios (indicated as n), unless otherwise stated. In addition, the average responses are expressed as the mean ± standard error of the mean (SEM), unless otherwise indicated. For the non-dichotomous subgroups (i.e. age and number of publications), we utilised a median split to compare matched size groups above and below the median values (age and number of publications, respectively). Further subdivision of the population was not possible, as the subgroups became too small for meaningful analysis. The processing of the raw survey data (e.g. grouping, sorting) was carried out using Microsoft Excel (2016). Data are non-normally distributed (after Shapiro–Wilk test) and only non-parametric tests were used for any statistical comparisons. Graph plotting, descriptive statistics and correlations were carried out using GraphPad Prism v7 and 8 for Windows (GraphPad Software, Inc., La Jolla, CA). In particular, we calculated mean and median, SEM and standard deviation (SD). We also used the Mann–Whitney U-test to evaluate differences in overall severity scores, and Spearman’s rank correlation for the analysis of demographic subgroup correlations. PASW Statistics for Windows v18.0 (SPSS, Inc.) was used for cluster analysis (dendrogram construction) following an average linkage method.19,20 Statistical significance was set at p < 0.05.
Results
Fifty-nine people from 15 EU countries and participants of COST Action FA1301 responded to the PAS-C survey, giving an overall response rate of 33.5% (see Supplemental Tables S1 and S2 for details and demographics of respondents). Due to the biased distribution among EU countries of people either involved or potentially interested in cephalopod science, it is not surprising that responses primarily originated from five countries: Italy (21.2%), the UK (21.2%), France (13.5%), Portugal (11.5%) and Spain (5.8%).
Scores in the UTD category
For all 50 scenarios, the scores in the UTD category ranged from 3.4% to 25.9% of respondents, with a mean of 7.0 ± 0.6% (Supplemental Figure S1). Eighty-six percent of scenarios had UTD scores <10% (64% of scenarios: <5% UTD). There was no correlation between the overall severity score for each scenario and the UTD score.
Seven scenarios (i.e. scenarios 10, 22, 27, 30, 31, 41 and 48; see Supplemental Information) had UTD scores >1 standard deviation from the mean (i.e. >11%). Of these, three involved studies of O. vulgaris paralarvae (i.e. scenarios 22, 27 and 31), one studied an analgesic (i.e. scenario 10), one a chronic brain lesion (i.e. scenario 30), one a general anaesthetic (i.e. scenario 48) and one a killing method (i.e. scenario 41). Scenario 22 had the highest UTD score (25.9%) and the most diverse range of responses of all 50 scenarios (see below).
Identification of scenarios describing non-recovery procedures
Three scenarios (i.e. scenarios 5, 29 and 46) had a score in the non-recovery classification of 65.5 ± 3.1% with a UTD score of 5.7 ± 0.5%. Figure 1 illustrates the individual scores for these three scenarios and in each case shows the highest score in the non-recovery category compared to all other categories. As the sub-threshold score for these three scenarios was <2%, respondents clearly recognised that these scenarios all came within the scope of Directive 2010/63/EU and allocated them ‘correctly’ to the non-recovery classification.
Distribution of scores (% responses) for three individual scenarios (i.e. scenarios 5, 29 and 46), with the highest scores in the non-recovery category. UTD: unable to decide category. See text for definitions.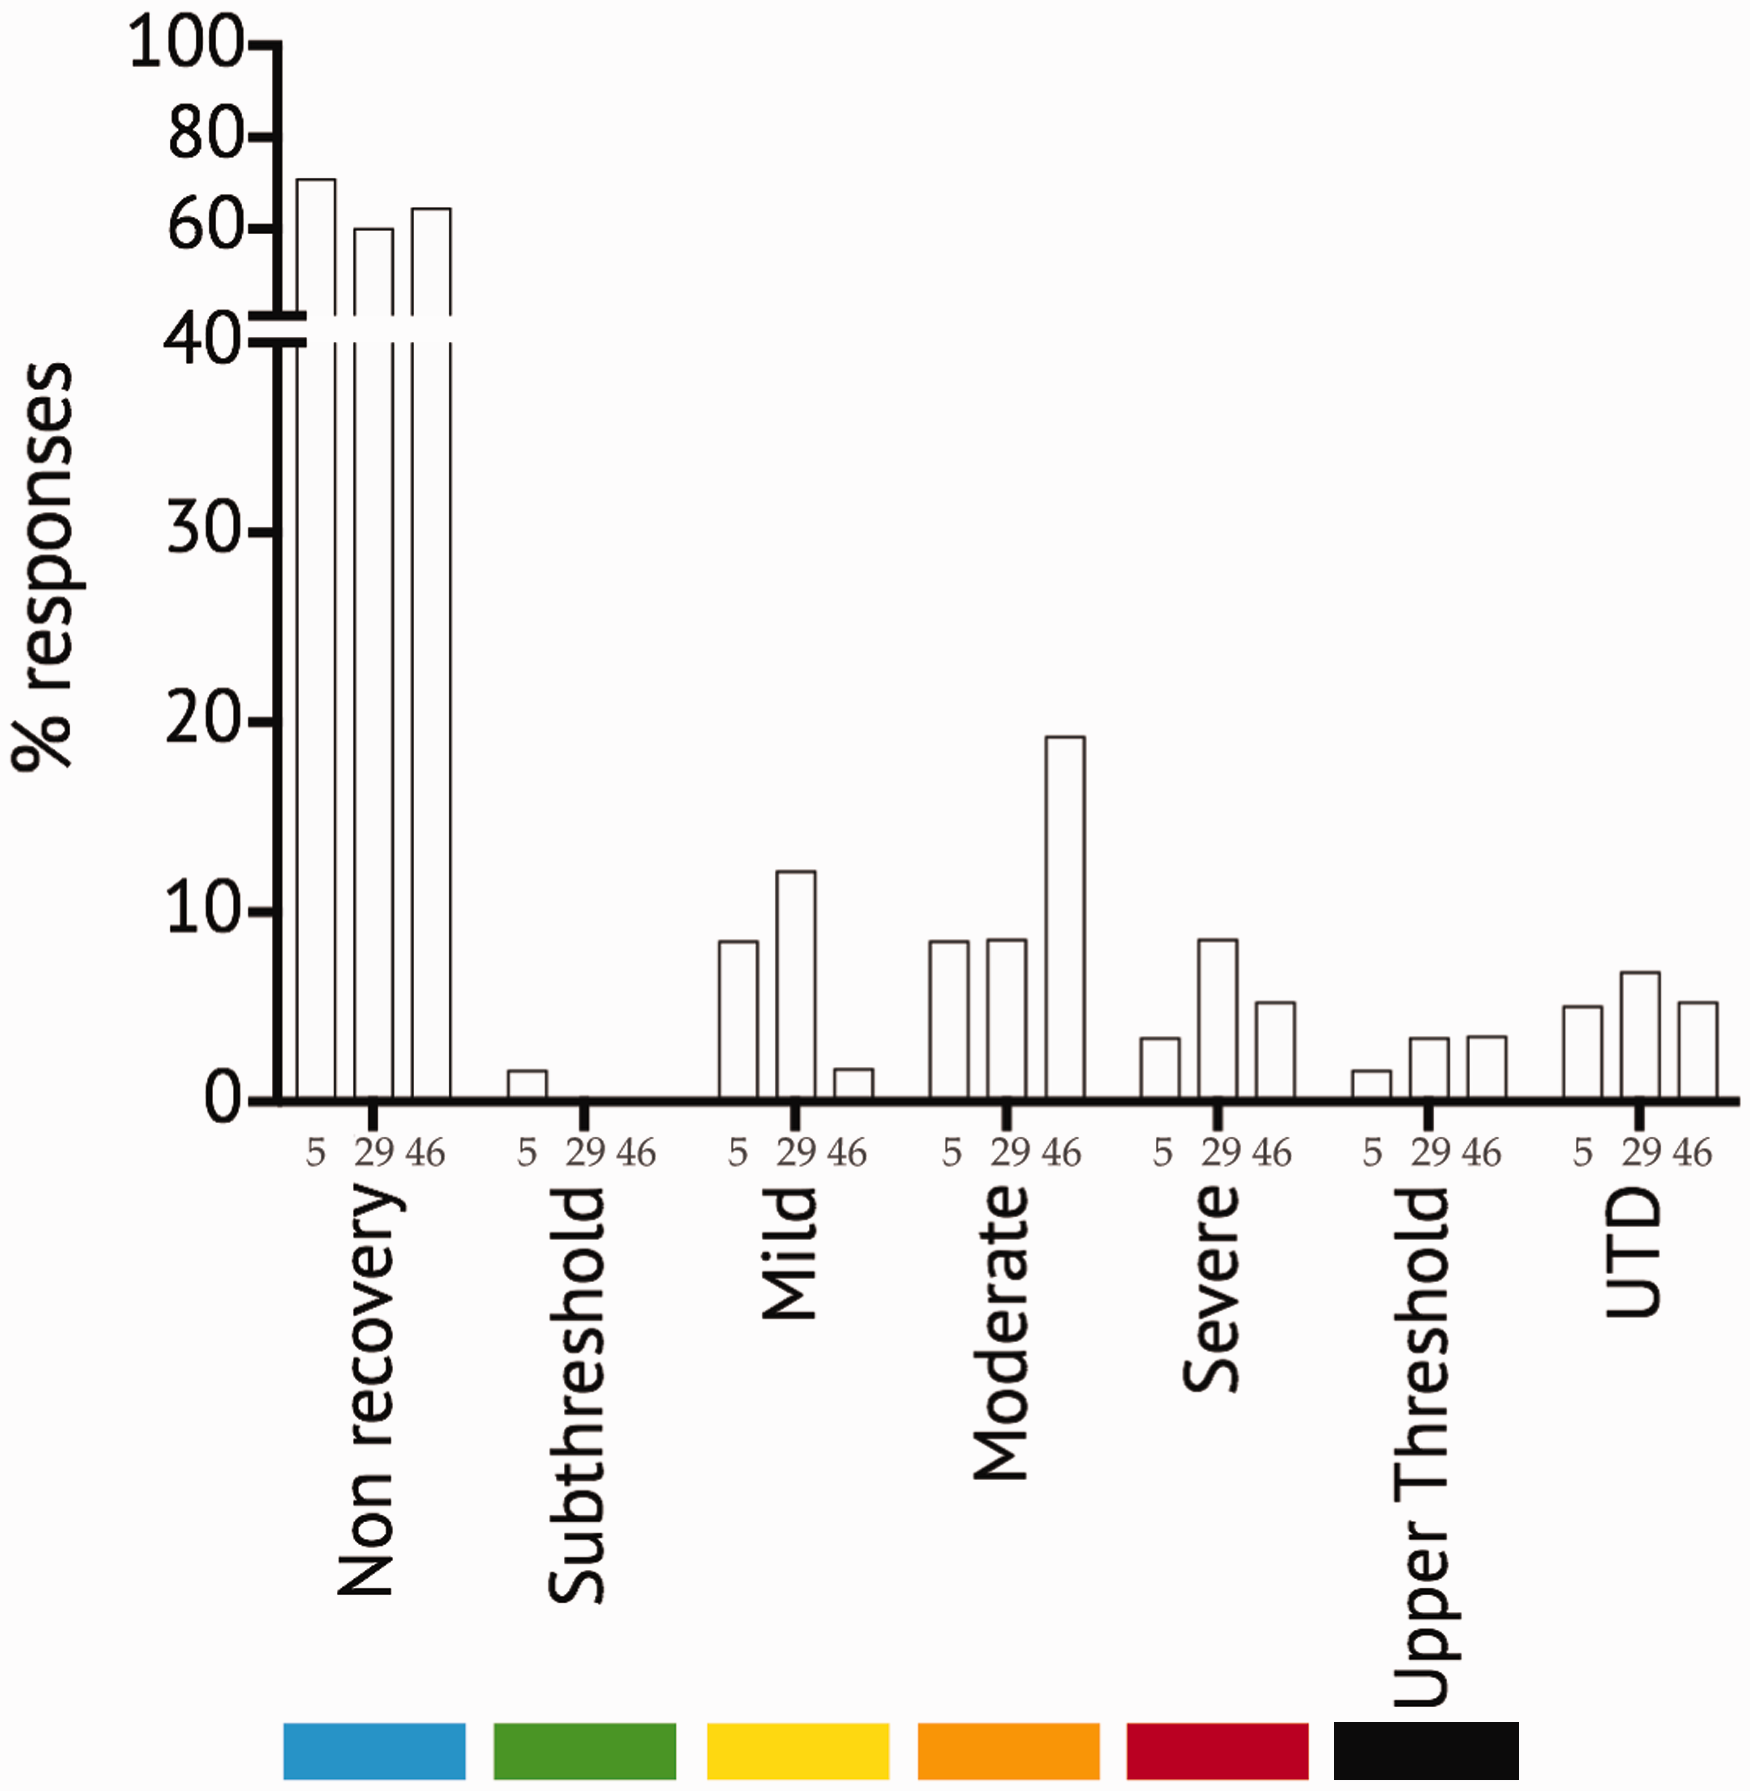
As an independent measure of the accuracy with which the non-recovery scenarios were assessed and also to identify factors that may lead to an erroneous classification, we analysed the non-recovery scores for the remaining 47 scenarios that clearly did not meet the Directive definition of non-recovery. The score in the non-recovery classification for scenarios that are clearly not in this category was 3.4 ± 0.6%, but for three scenarios (i.e. scenarios 22, 26 and 28), the score was > 10% (M ± SEM = 16.1 ± 2.3%; range 13–20%). These three scenarios, with erroneous high non-recovery scores, all described a method for killing a cephalopod with no other procedure involved; one involved an octopus paralarva (scenario 22), one a cuttlefish hatchling (scenario 26) and one an adult squid (scenario 28).
It is interesting to note that the final clustering of the overall percentage scores (Figure 2) indicated that the three non-recovery scenarios appeared in a single cluster (A in Figure 2). Additionally, three scenarios (i.e. scenarios 22, 26 and 28) with non-recovery scores >10% (see above) were outside the non-recovery cluster A and clustered in C2 (Figure 2).
Relationship between scenarios deduced after cluster analysis utilising the average linkage method. In the dendrogram, the distance between two clusters is defined as the average distance between all pairs of the two clusters’ members and is shown as rescaled distance (%). The clustering algorithm was applied to scores for all 50 scenarios (numbers refer to the scenario identifier in the original survey). For clarity, the groupings of scenarios clusters have been colour coded to indicate the severity category using the same colour coding as used in all figures: sub-threshold ( ), non-recovery (
 ), mild (
 ), moderate (
 ), severe (
 ) and upper threshold (
 ). Scenario 22 is an outlier in the dendrogram, reflecting that this was the only scenario for which it was not possible to assign a severity classification (see text for details). The final assigned severity classification derived from all data (see text) is indicated, although in the cluster some scenarios are on category borderlines. For example, B2 was assigned to mild but on the sub-threshold/mild border and so clusters close to sub-threshold, B1; C1A* was assigned to moderate but on the mild/moderate border and so clusters close to mild C1A**; C1B** was assigned to severe but on the mild/severe border and so clusters close to mild C1B*. Note that the two scenarios in the upper threshold category cluster together (C2B and C2A close to the severe scenario grouping). See also Figure 4 (and Supplemental Figures S2 and S3) for additional data used in making final severity classifications.
Identification of scenarios below and around the lower threshold for regulation
For four scenarios (i.e. scenarios 2, 32, 38 and 42), the sub-threshold score was >68% (range 68–79%; M ± SEM = 72.7 ± 2.4%), with a clear separation of the sub-threshold from scores in the mild category and higher classifications (Figure 3a). The radar plot for these four scenarios also supports the allocation to the sub-threshold classification (Supplemental Figure S2). For these four scenarios, the UTD score was 4.3 ± 0.5% and so had no impact on the overall classification. These four scenarios cluster together (sub-cluster B1) in the dendrogram (Figure 2).
(a) The distribution of scores (% respondents) in each severity category for four scenarios (i.e. scenarios 32, 42, 38 and 2) with dominant sub-threshold scores. (b) and (c) The change in the distribution of scores from scenarios with predominantly sub-threshold scores but increasing scores in severity categories above the regulatory threshold (i.e. scenarios 40, 3, 43, 12 and 23). The bars illustrate scenarios around the threshold for regulation to scenarios with dominant ‘mild’ scores (scenarios 8 and 20) and increasing moderate scores (scenario 11), indicating scenarios which should be considered supra-threshold. See text and Supplemental Information for definitions.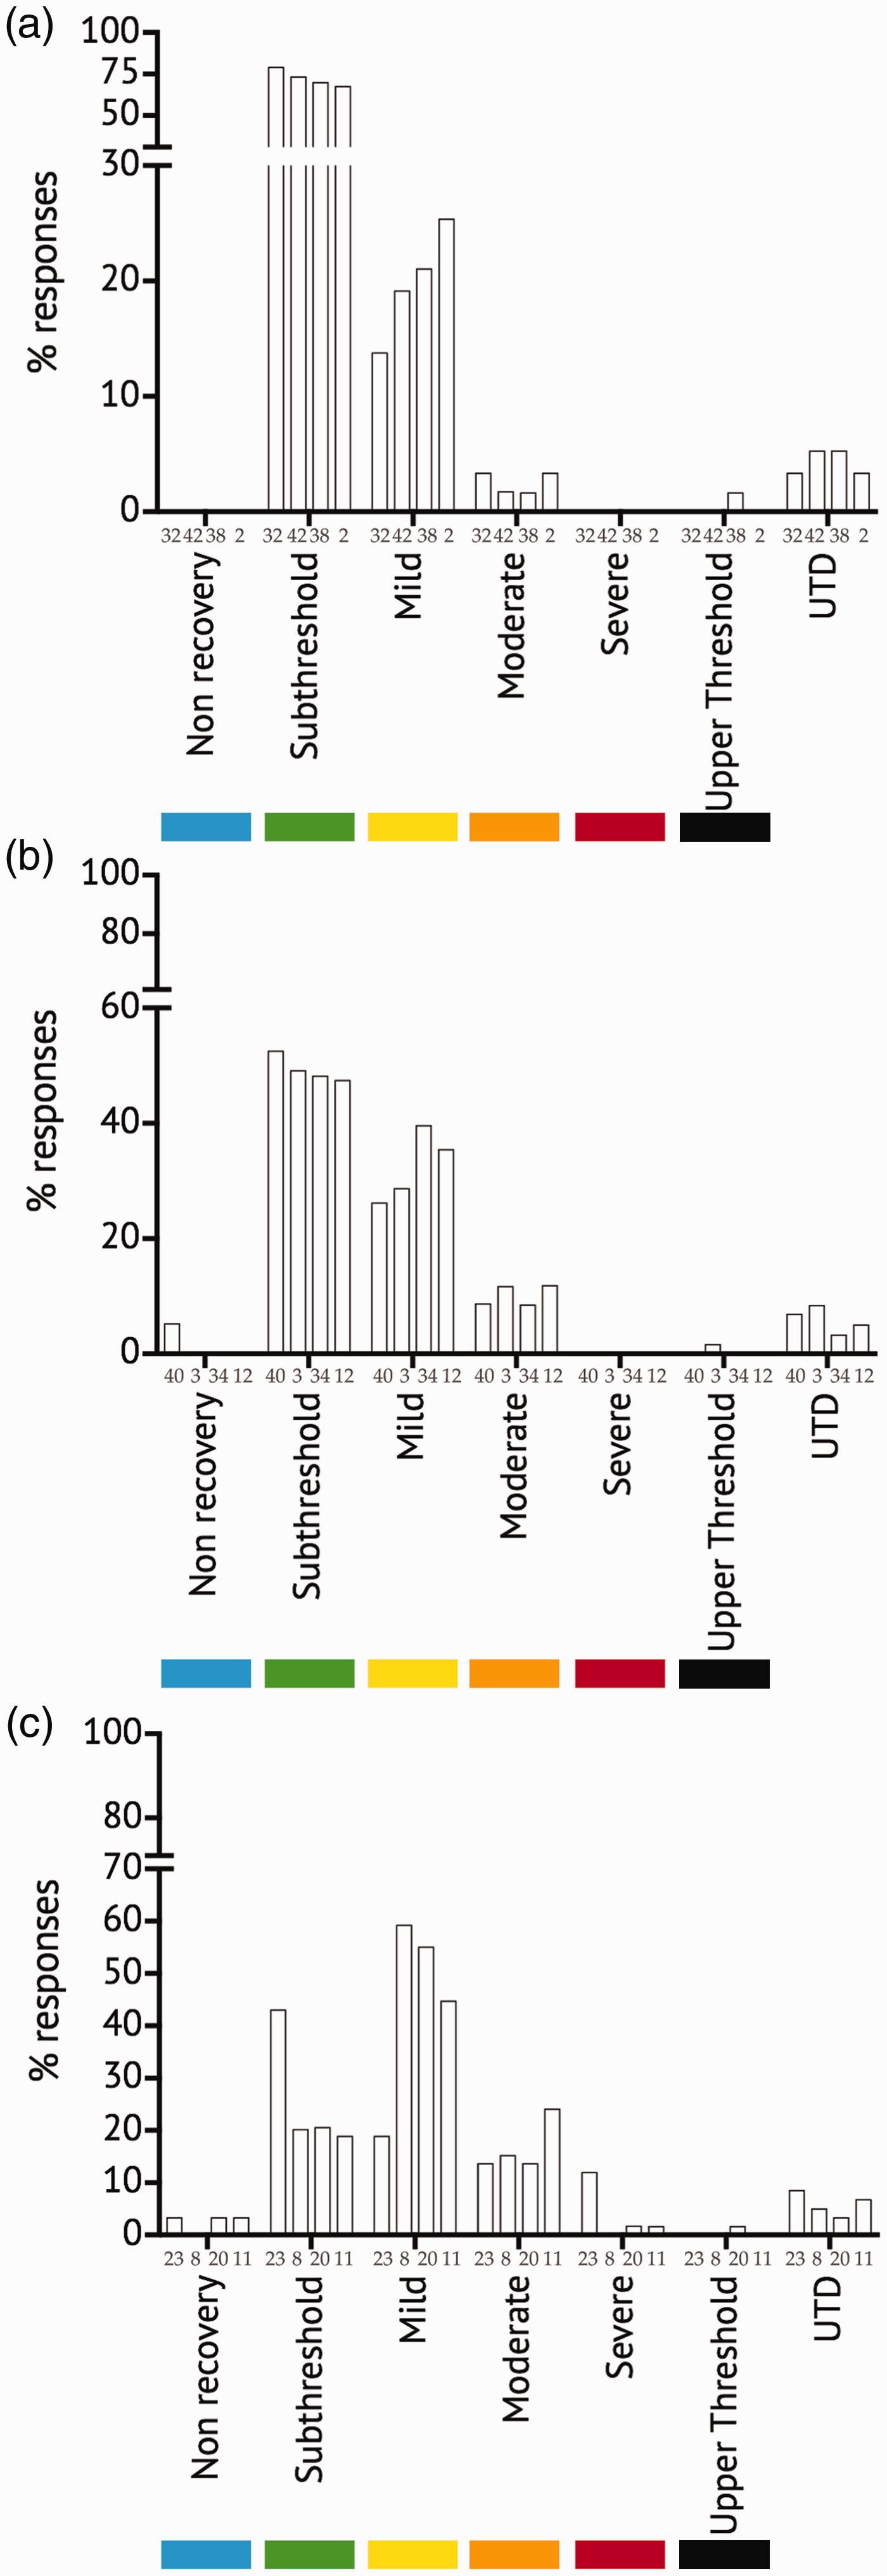
Whilst the survey population scored four scenarios predominantly below the threshold for regulation (sub-threshold), we also assessed how often the remaining 46 scenarios (i.e. all scenarios except sub-threshold scenarios 2, 32, 38 and 42) were also scored as sub-threshold.
The percentage of the survey population assessing the remaining scenarios as sub-threshold was 11.2 ± 2.4%, and for 16/46 (35%) scenarios, this value was <5% of the survey population. However, for 13 scenarios (i.e. scenarios 3, 8, 11, 12, 13, 16, 20, 22, 23, 27, 31, 34 and 40), >10% (range 10.3–52.6%) of the survey population considered each of these scenarios to describe procedures that were sub-threshold. Of these 13 scenarios, five involved behavioural studies (i.e. scenarios 3, 12, 13, 16 and 34), three involved growth/feeding in paralarvae/hatchlings (i.e. scenarios 20, 27 and 40), two involved killing paralarvae (i.e. scenarios 22 and 31), one involved a non-invasive procedure performed under general anaesthesia with recovery (i.e. scenario 8), one involved a digestive tract transit study (i.e. scenario 11) and one was a study of post-reproductive senescence (i.e. scenario 23). The individual scores for eight of these scenarios are plotted in Figure 3b–c together with the scores from the four sub-threshold scenarios (Figure 3a) to illustrate the gradual shift from high sub-threshold scores to reduced sub-threshold scores with increased scores in mild or more severe categories.
Five scenarios (i.e. scenarios 3, 12, 23, 34 and 40; Figure 3b–c have a distribution of scores indicating that they should be considered as describing procedures which are on the borderline for regulation (i.e. on the sub-threshold-‘lower’ mild borderline), whereas for the other eight scenarios, the balance shifts to scores in severity classes predominantly above the lower threshold for regulation (see Figure 3c for examples).
In Figure 2, scenario 23 (with a sub-threshold score of 43%) describing a non-invasive observational study of senescing octopuses is allocated to the same cluster (B2) as scenarios 3, 12, 34, and 40, therefore just within the mild category. Cluster B includes closely related sub-clusters (B1) with sub-threshold scenarios and B2 with scenarios assessed as around the regulatory threshold (sub-threshold/mild borderline). However, as the scores in the sub-threshold category and the sum of scores for all categories above the lower regulatory threshold (sub-threshold 48.1 ± 1.5% vs. above lower threshold 48.4 ± 1.8%, n = 5; see Figure 3b and Supplemental Figure S2 for radar plot profiles) in a prospective classification, it is appropriate to allocate these scenarios to the mild category applying the precautionary principle.
The above score profile of the scenarios considered to be around the lower regulatory threshold differs markedly from all other supra-threshold scenarios (sub-threshold score 5.9 ± 1.1% vs. sum of supra-threshold scores 87.7 ± 1.2%, n = 40; p < 0.0001).
The remaining scenarios identified above (i.e. scenarios 8, 20 and 27) cluster with scenarios in C1A** (Figure 2) which are clearly above the lower threshold for regulation, and are therefore considered to describe procedures which should also be regulated under the Directive.
Identification of scenarios in mild, moderate and severe classifications and around borderlines
As depicted in Figure 2, some scenarios have been allocated to the mild and higher severity classes (see also score profiles in Supplemental Figures S2 and S3). Below, we also identify scenarios attributed by respondents to borderline categories. These scenarios are allocated to the higher severity classification class according to the precautionary principle which should be applied to prospective assessment of severity.
Mild
Scenarios in this category are identified in the groupings B2 and C1A** in the clustering (Figure 2). The scenarios (i.e. scenarios 3, 12, 23, 34 and 40) on the sub-threshold/mild borderline in B2 (Figure 2 and Supplemental Figure S3) should ultimately be included with scenarios identified above in the mild category (C1A**; sub-cluster including scenarios 8, 11, 13, 20, 27) using the precautionary principle (see Figure 4 for a summary).
The distribution of scores (% respondents; mean ± standard error of the mean) in each severity category for scenarios allocated to the categories defined in Directive 2010/63/EU. Numbers in parentheses indicate the scenario number in the original survey. See text for details of method of allocation.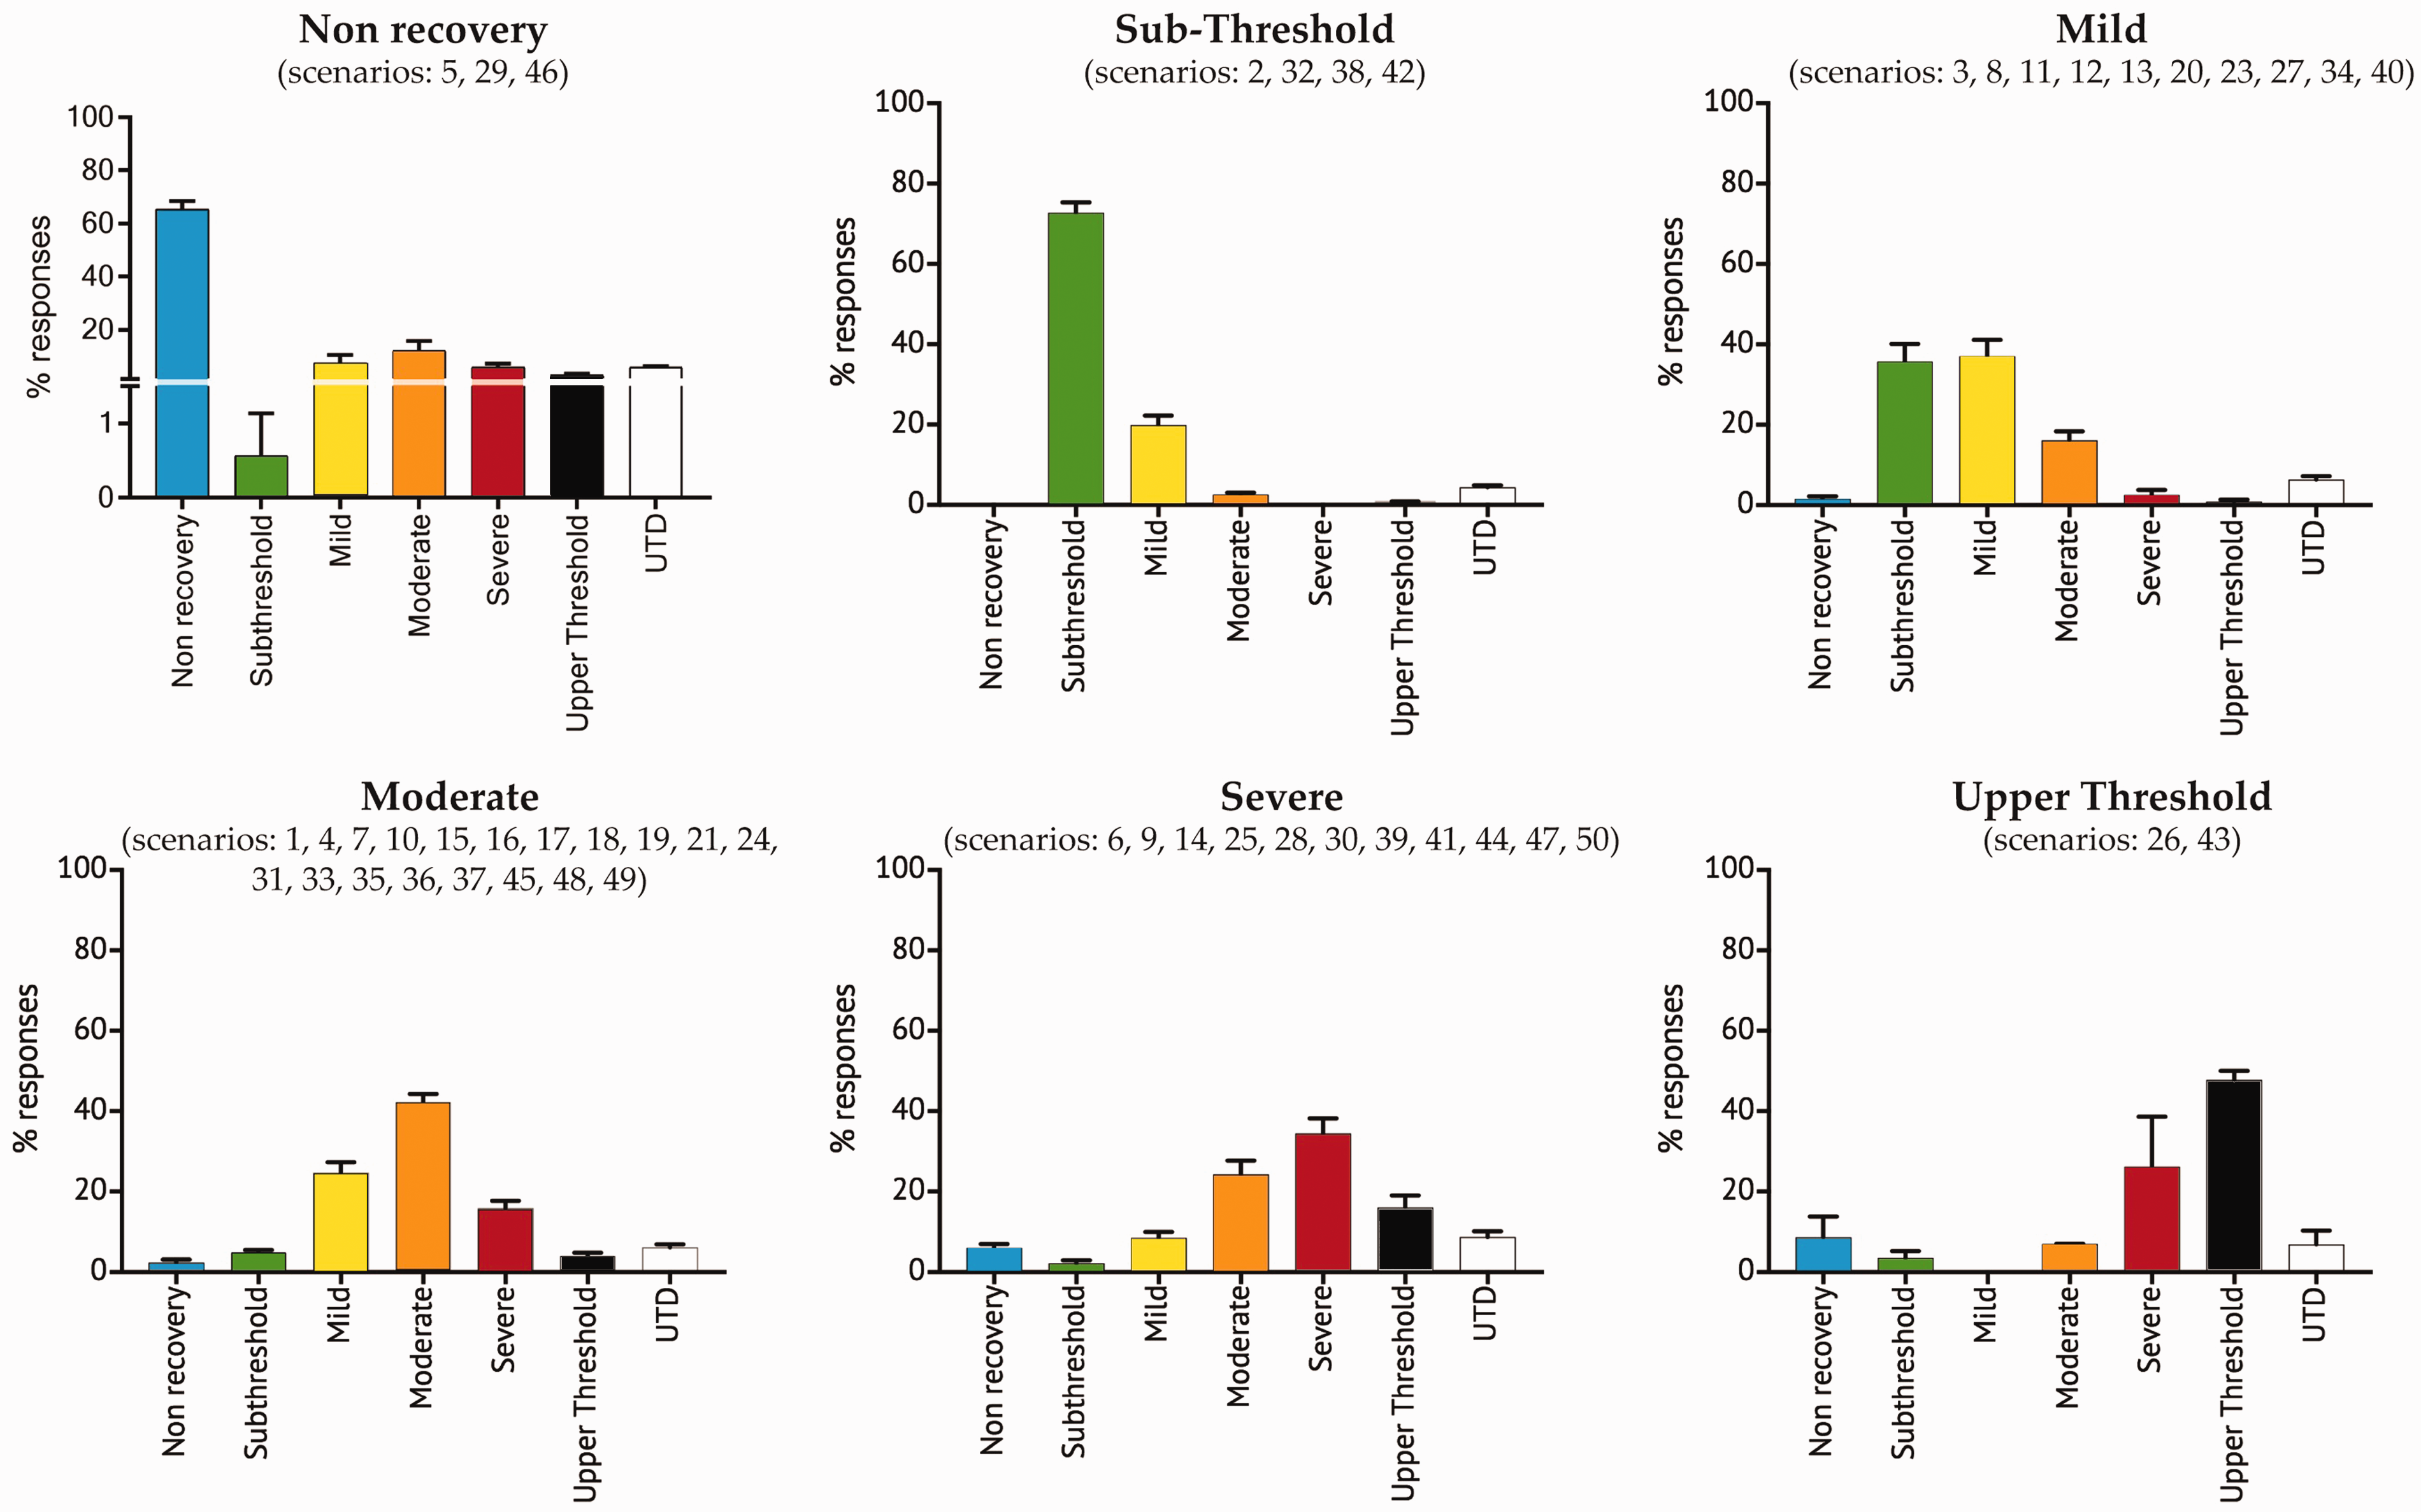
Sub-cluster C1A* adjacent to C1A**, both included in the main cluster C1A, identifies four scenarios (i.e. scenarios 1, 7, 17 and 48) with a predominant score in the mild category, but also with scores in higher, but not lower, severity categories. The overall scenario scores for the five scenarios in the C1A** sub-cluster (i.e. scenarios 8, 11, 13, 20 and 27) are lower than those in the C1A* cluster (i.e. scenarios 1, 7, 17 and 48; see also Appendix 3 for individual scores).
Scenarios 1, 7, 17 and 48 have relatively high mild scores and scores in higher severity categories, placing them on the mild/moderate borderline (Supplemental Figure S4). For these latter scenarios, the individual survey scores in the mild category are similar to those in the moderate and higher categories (mild 43.3 ± 2.2% vs. higher 44.7 ± 1.8%; see Supplemental Figure S3). So, using the principle outlined above, they should be allocated to the moderate category (Figure 4).
Moderate
Cluster C1B (Figure 2) identifies scenarios with high scores in the moderate category (C1B*) and scenarios with moderate but also higher severity scores (C1B**). The overall scores (see Methods) for the 15 scenarios in the C1B* sub-cluster (i.e. scenarios 4, 10, 15, 16, 18, 19, 21, 24, 31, 33, 35, 36, 37, 45 and 49) are lower than the six scenarios (i.e. scenarios 6, 25, 39, 44, 47 and 50) in the C1B** sub-cluster (662 ± 8.7 vs. 757 ± 12.8; p < 0.0001).
The percentage scores in each severity category for scenarios in the moderate category and for scenarios with high moderate scores, but also with scores in more severe categories, are shown in Supplemental Figure S3. Analysis of the individual percentage scores in the C1B** sub-cluster (i.e. scenarios 6, 25, 39, 44, 47 and 50) shows that these six scenarios are at the upper end of the moderate category. Hence, they are in cluster C1 as opposed to cluster C2 (severe and upper threshold). However, based upon the distribution of scores and adopting the precautionary principle, these should be classified as severe (see below).
Applying the precautionary principle, the scenarios identified above on the mild/moderate borderline (sub-cluster C1A*; i.e. scenarios 1, 7, 17 and 48) should be included with the scenarios identified above in the moderate category (C2B sub-cluster; i.e. scenarios 4, 10, 15, 16, 18, 19, 21, 24, 31, 33, 35, 36, 37, 45 and 49; see Figure 4 for a summary).
Severe and upper threshold
All remaining scenarios were allocated by cluster analysis to grouping C2 (Figure 2) with sub-clusters C2A (i.e. scenarios 9, 14, 28, 30, 41) and C2B (i.e. scenarios 26 and 43). Scenarios 26 and 43 (C2B) have high and comparable scores in the severe and upper threshold categories and so these are classified as upper threshold, while scenarios in sub-clusters C2A (i.e. scenarios 9 and 14) and C1B (i.e. scenarios 6, 25, 39, 44, 47 and 50; see ‘Moderate’ above) are classified as severe (Figure 4).
Overview of scenario allocation to severity categories
The cluster analysis (Figure 2) identified groupings and subgroupings of scenarios which were used to allocate them to sub-threshold (B1), mild (B2 and C1A**), moderate (C1A* and C1B*), severe (C2A and C1B**) and above upper threshold (C2B) categories. The original percentage severity scores for all scenarios allocated to the severity categories, as defined in Directive 2010/63/EU, are plotted in Figure 4 in which scenarios on borderlines between categories (see also Supplemental Figure S2) have been allocated to the higher severity category as described above and adopting the precautionary principle.
An unclassifiable scenario
Scenario 22 (‘Newly hatched paralarvae of O. vulgaris (<1 mm, DML) will be killed by immersion in liquid nitrogen for subsequent biochemical analysis’) falls into a category of its own based on two criteria. First, it had the highest score of any scenario in the UTD category (25.9%), with a sub-threshold score of 25.9%, a non-recovery score of 20.7% and an aggregate score of 26.6% in the supra-threshold severity categories. These values give it a unique profile (see Supplemental Figure S2). Second, it stands alone in the dendrogram (Figure 2). In contrast to all other scenarios, no predominant category could be identified.
Examples of procedures in cephalopods derived from the survey analysis
Outline examples of procedures utilising living cephalopods classified by severity (prospective) category: sub-threshold (green), mild (yellow), moderate (orange) and severe (red).
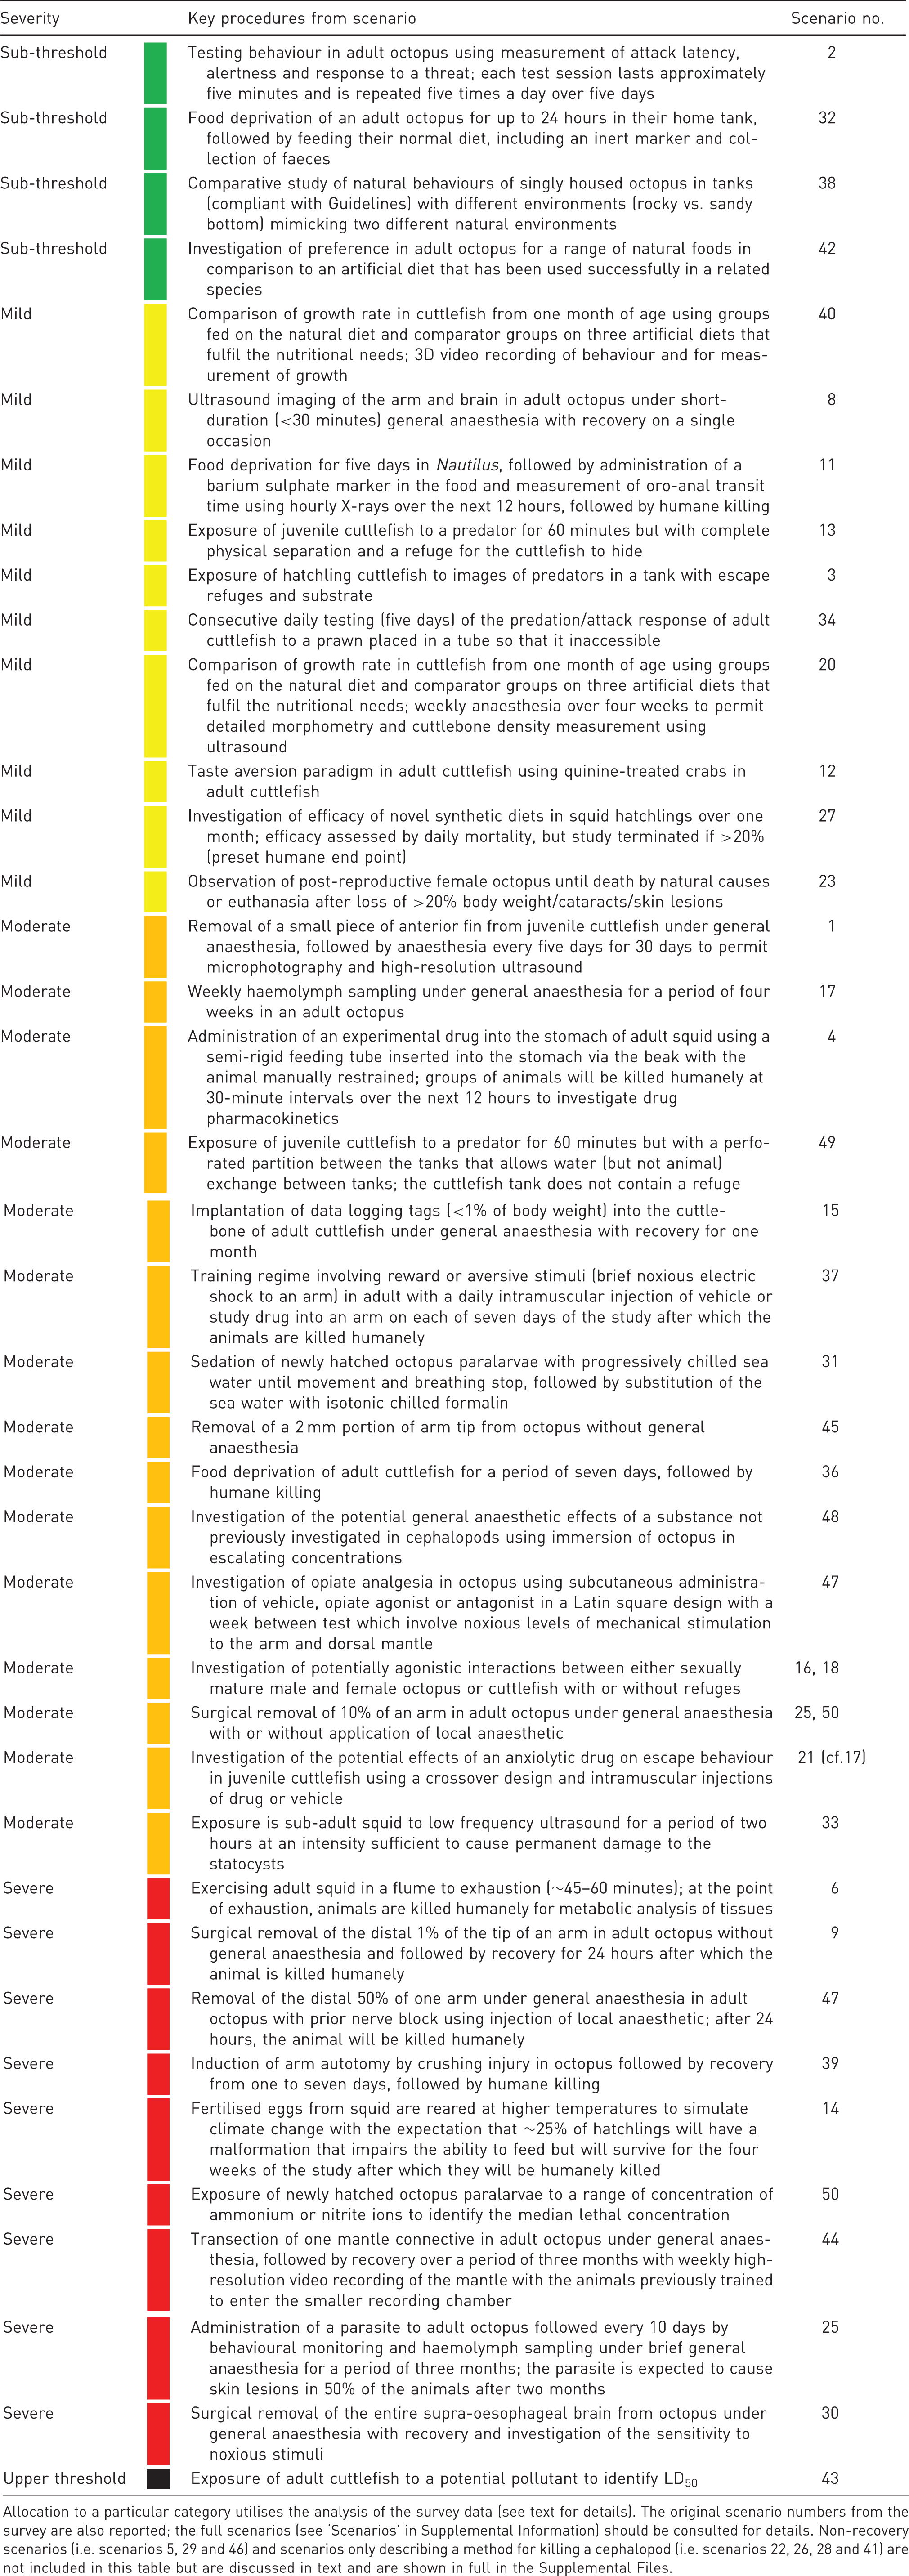
Allocation to a particular category utilises the analysis of the survey data (see text for details). The original scenario numbers from the survey are also reported; the full scenarios (see ‘Scenarios’ in Supplemental Information) should be consulted for details. Non-recovery scenarios (i.e. scenarios 5, 29 and 46) and scenarios only describing a method for killing a cephalopod (i.e. scenarios 22, 26, 28 and 41) are not included in this table but are discussed in text and are shown in full in the Supplemental Files.
Discussion
This paper reports the first attempt to allocate regulated procedures in cephalopods prospectively to severity categories. An integrated cephalopod community, with people working either directly or indirectly in cephalopod science, as represented by the participants in COST Action FA1301 CephsInAction, allocated consistently scenarios describing procedures (a) below and above the lower threshold for regulation defined by Directive 2010/63/EU, and (a) across the entire range of severity classifications. Furthermore, respondents recognised that severity classification applies to all cephalopod life stages post hatching and species.
Critique of methodology
A discussion of the limitations of the Delphi method is outside the scope of this paper, but here we overview some of the issues that may have influenced the outcomes of the survey.
Potentially, a survey can gather views from a larger and more diverse group than may be possible in a round-table discussion, and can include those either unable to attend or not invited to a ‘self-selected’ expert group meeting. The survey views are independent (assuming no collusion), equivalent and anonymous, minimising the impact of group dynamics and responses can readily be linked to personal profiles to assess variations between subgroups. In the survey, we included a UTD option, whereas in a round-table meeting of ‘experts’, peer pressure may make it be difficult for an individual to give this as their opinion. With an online survey, the time pressure to reach a decision is reduced compared to a meeting, and modification of response is possible until submission.
In our case, the PAS-C survey facilitates engagement of the cephalopod community in responding to Directive 2010/63/EU, as the opinions are representative of the community rather than views imposed by those more familiar with this type of assessment in vertebrates. This is of particular relevance, since it has been suggested that the Directive attempted to apply a ‘mammalocentric’ approach to cephalopods. 21
However, there are also negative factors to consider.
The PAS-C Survey was based on a selected series of short scenarios to focus attention on the procedures used and avoided including any justification. So, the judgement was based on the scenario procedures and not the scientific or other justification. Scenarios included in the survey were based on data derived from a non-systematic review of published works spanning from 1940 to 2014 that utilised cephalopods in studies including biochemistry, physiology, immunology, neuroscience, eco-toxicology and behavioural sciences. The use of methods sections from published works publications was not considered practical for our aims because of (a) the need for extensive copyright clearance, (b) respondents recognising the original paper and hence being influenced by the authorship, (c) the length of many methods sections, which would make the time required to complete the survey impractical. We are aware that the amount of information given in the scenarios is limited. However, the outcomes indicate that this was sufficient to reach a decision, as overall scores in the UTD category were low.
The survey outcomes are obviously dependent on the respondents. However, the respondents were a self-selecting sample of a population (the COST Action FA1301 participants) whom it is assumed are a representative sample of the EU cephalopod research community. We recognise that the respondents comprise a number of subgroups (Supplemental Tables S1 and S2) which it was not possible to analyse separately because of the subgroup sizes. However, we used a median split for the main subgroups (age, sex, PhD, cephalopod experience and publications), and this did not reveal any major differences in overall assessment of the scenarios, but this analysis may not have sufficient resolution to identify more subtle differences. The answers given by the respondents assume diligence (e.g. reading the Guidance notes) and honesty (e.g. giving an independent view), with participants needing to be sufficiently altruistic to spend about a couple of hours to complete the survey. By not selecting just ‘experts’ to participate, the responses will depend on the respondents’ knowledge and understanding of the Directive, knowledge of some basic biology relevant to each cephalopod species, comprehending the experimental methods in scenarios, their level of relevant expertise and possibly their ‘emotional’ response to the scenario (e.g. descriptions of surgical procedures may be challenging for researchers who may only be involved in behavioural studies). In deriving the overall severity assignments, objective criteria have been used based on the survey responses, but the process by which individual respondents reached their assessments is likely to include both objective and subjective elements.
Whatever the approach used by the respondents, there is a high degree of consensus for many scenarios. In addition, we were unable to identify any major systematic differences in the overall assessments between the demographic subgroups.
Finally, we should highlight that the survey was only delivered in English, but COST Action FA1301 has participants from many EU states, and English is not the first language for many, although meetings were conducted in English. We are unable to assess the impact of language on the results, but it may have reduced the number of respondents.
Overall classification and comparison of scenarios: internal validity
To identify the major factors influencing the responses, we have focused on the scenarios involving either S. officinalis (12 scenarios) or O. vulgaris (16 scenarios), as they provide the largest number of scenarios for direct comparison.
General anaesthesia and/or surgery
All scenarios involving anaesthesia with recovery, irrespective of any other intervention, were assessed as above the lower threshold for regulation in both species. This was also the case for comparable scenarios involving the less studied species such as E. cirrhosa and Hapalochlaena lunata. For example, scenario 40 described a feeding/growth study over the first month of life in cuttlefish which was assessed at the lower end of the mild category and considered by a high percentage of respondents to be sub-threshold (see Figure 3b). However, addition of weekly, brief, general anaesthesia to this scenario (scenario 20) moved the assessment to the upper end of the mild category (see Figure 3c) and increased the overall scenario score (378 vs. 489). Similarly, scenario 8, involving brief general anaesthesia combined with non-invasive ultrasound, is in the middle of the mild category, but a similar procedure (scenario 1) involving surgery with recovery and multiple periods of anaesthesia for ultrasound increased the overall scenario score (470 vs. 581) and placed the scenario in the lower half of the moderate category.
When scenarios included more major surgical procedures, they were allocated to moderate (e.g. data logger implantation, scenario 15) and higher categories (e.g. partial arm amputation, scenario 24; supra-oesophageal brain removal, scenario 30).
We deliberately included four scenarios in O. vulgaris describing arm amputation because of the resurgence of interest in regeneration studies.22–24 Although there was little difference in the overall severity classification between the scenarios describing amputation carried out under general anaesthesia, with or without local anaesthesia, the scenario describing 10% amputation without anaesthesia (scenario 9) was clearly in the severe category, with an overall severity score in the upper decile. Interestingly, a comparable scenario (scenario 45) involving removal of 2 mm of the arm from the Dumbo octopus for molecular profiling (analogous to rodent tail tip sampling) was clearly assigned to the moderate category, whereas induction of arm autotomy in the octopus Abdopus aculeatus by crushing without anaesthesia was assigned to the severe category (scenario 39).
Substance administration or haemolymph sampling
Repeated sampling of haemolymph under general anaesthesia over four weeks (scenario 17) in octopus was scored in the mild/moderate borderline and so was finally allocated to the moderate category. Multiple drug injections (subcutaneous or intramuscular) to investigate analgesic (scenario 37) and anxiolytic (scenario 21) effects in cuttlefish were placed directly in the moderate category. The latter scenario (21) is identical to scenario 7, with the exception that scenario 21 involves multiple drug injections; scenario 7 is in the mild/moderate sub-cluster (C1A* in Figure 2), whereas scenario 21 is in the moderate sub-cluster (C1B* in Figure 2), and the overall scenario scores differ by 85 points (564 vs. 649). Gavage for drug administration in squid (scenario 4) was judged to be moderate probably because of the risk of brain damage during the passage of the tube.25,26
Behavioural interventions
Behavioural studies that may potentially cause distress above the threshold for regulation were recognised as falling within the Directive. Scenarios 13 and 49 are identical in describing exposure of juvenile cuttlefish to a predator in a divided tank. However, the scenario in which the cuttlefish are able to hide and where there is no water exchange was categorised in the sub-threshold/mild group, whereas if there was no refuge and the partition perforated to allow water exchange, the scenario was assessed as moderate. Interestingly, scenario 3, describing exposure of newly hatched S. officinalis to images of predators, was also considered to be on the sub-threshold/mild borderline.
We propose that if the cephalopod is able to hide from the predator and there is no physical or chemical contact with the predator, then the procedure should be considered to be sub-threshold. However, if such studies are undertaken, the actual severity should be monitored to provide objective data to support this prospective assessment.
In cuttlefish, experimental induction of escape reactions (scenario 7) and investigation of agonistic social interactions in a small tank (scenario 18) were assessed as mild and moderate, respectively. The latter is consistent with a classification of moderate severity for an agonistic social interaction study in O. vulgaris (scenario 16).
Scenarios 19 and 37 describing a training paradigm of O. vulgaris involving brief electric shocks as negative reinforcements were assessed as moderate, but the scenario which additionally involved daily injections (scenario 37) was also assessed as moderate, although at the upper end of the score range. A recently published study of serial visual reversal learning in octopus using only positive reinforcement reported that the study was classified as ‘mild’, 27 although it is unclear whether this was prospective or actual severity.
Food deprivation
Deprivation of food in a juvenile/adult animal within the duration likely to be normally encountered in the wild was not considered to fall within regulation (e.g. scenario 32), but extended food deprivation was. For example, seven days of food deprivation in adult S. officinalis was considered to fall within the moderate category (scenario 36), and this aligns with recent proposals for the severity classification of different periods of food deprivation in cephalopods. 25
A comment about scenarios allocated to the upper threshold classification
Two scenarios (i.e. scenarios 26 and 43) were allocated to the upper threshold category (i.e. higher than severe, and hence should not be authorised except under ‘exceptional and scientifically justifiable reasons’; Article 55; see also Table 2). These scenarios were clustered (C2B in Figure 2) with scenarios allocated directly to the severe category (C2A in Figure 2), suggesting that it may be more accurate to view these scenarios at the upper end of the severe category. It is notable that one of the scenarios (26) describes a method for killing cephalopods which does not comply with the general principles outlined in Annexe IV of Directive 2010/63/EU, and this is discussed in more detail in a specific section below.
An LD50 study in adult cuttlefish (scenario 43) was also considered to be upper threshold (i.e. above the upper limit defined in Article 15) and had the highest overall scenario score. As described, such a study should not be authorised, but with appropriate refinement and well-defined humane end points, the prospective assessment could change to severe – the classification allocated by 35.6% of respondents.
Prospective severity classification of procedures in cephalopods
Scenarios around the regulatory threshold
The decision regarding whether a procedure is likely to exceed the threshold for regulation is a critical one, but the regulatory boundary may not be obvious. The progressive shift in the score profile from sub-threshold to mild categories is illustrated in Figure 3 (see also Supplemental Figure S3). Applying the precautionary principle, we allocated scenarios on the borderline to the mild category. For example, scenario 40, describing the effect of artificial diets on growth of hatchling cuttlefish, was considered to be mild. However, it is likely that assessment of actual severity would show that the study described was sub-threshold.
This precautionary approach is further supported by the Annual Statistics of Scientific Procedures on Living Animals for the Great Britain 28 which reported in 2016 that 12% of procedures performed in the UK were sub-threshold, although the prospective classification and application to the NCA must have indicated that they were considered above the regulatory threshold.
Scenarios most likely to be considered below the lower threshold for regulation (sub-threshold) by a significant minority of the respondents involved either behavioural or dietary manipulation/growth studies. As behaviour is among the most studied aspects of cephalopod biology29–32 and metabolic studies are also important for research informing cephalopod aquaculture,25,26,33,34 we recommend that specific guidance is developed to assist researchers in assessing severity in such studies. However, it should be emphasised that if there is any doubt about whether a proposed procedure is below or above the lower threshold for regulation, the default position is that the procedure should be regulated and evidence gathered on its actual severity to inform future applications.
Non-recovery scenarios
Three scenarios fitting the Directive definition of non-recovery were readily identified. However, three other scenarios had relatively high scores (13–20%) in the non-recovery category, although not fitting the definition. These scenarios described a method for killing a cephalopod with no other intervention. This observation suggests that although the Directive 2010/63/EU definition of non-recovery 4 is precise (see Table 2), some additional guidance notes to avoid confusion with killing methods may be required.
Scenarios describing methods for killing cephalopods
Killing an animal is not a regulated procedure under Directive 2010/63/EU provided that the general principles outlined in Article 6 and Annexe IV §§1 and 2 are followed and a method described in the table in Annexe IV §3 is employed. Alternatively, under Article 6 §§4a and b, the NCA may grant an exemption based on an assessment that the proposed method is at least as humane as those in Annexe IV §3 or that based on a scientific justification the purpose of the procedure cannot be achieved by methods given in Annexe IV. However, the table in Annexe IV §3 does not give any method for killing cephalopods, and in the recent European Commission review of the objectives, fitness for purpose and currency of Directive 2010/63/EU (https://eur-lex.europa.eu/legal-content/EN/TXT/HTML/?uri=CELEX:52017DC0631&from=EN), the lack of standardised appropriate methods for killing cephalopods was recognised as an omission. The only information relevant to killing cephalopods is in Annexe IV §§1a and 2 which specifies that methods other than those in the table in Annexe IV may be used only if the animal is unconscious and killing is completed by one of five methods; proposals for methods compliant with these principles have been published.2,35
However, unconsciousness, particularly if induced by a general anaesthetic or cranial trauma, may not be compatible with the scientific objectives of a project, and an inspection of the cephalopod literature identified several methods which would not be compliant with the principles in Annexe IV §1a if used now. Four scenarios describing a killing method were included in the survey to obtain the views of the COST FA1301 community on the prospective severity of these methods should a researcher apply for authorisation (or if an exemption under Article 6 §§4a and b is sought) to use them. Scenarios describing decapitation of an adult squid (scenario 28) and mechanical destruction of the brain using a miniature captive-bolt in a 1.5 kg octopus (scenario 41) were classified as ‘severe’. It is interesting to note that the table in Annexe IV §3 identifies decapitation as acceptable for birds (<250 g) and rodents (if other methods not possible) and captive bolt as acceptable for larger reptiles (size not specified), rabbits and large mammals.
The scenario describing killing a hatchling cuttlefish by immersion in formalin without prior anaesthesia was considered to be upper threshold and hence should not be authorised (see above and Table 2 for definition) – a view consistent with previous recommendations.2,35
A final scenario describing killing newly hatched octopus paralarvae (<1 mm, DML) by immersion in liquid nitrogen was the only one of the 50 scenarios to be impossible to classify. Of particular note is that ∼25% of respondents considered this to be sub-threshold, but this scenario also had the highest UTD score.
The results of the survey show that amending Annexe IV to give appropriate methods, not involving prior loss of consciousness,2,35 for killing cephalopods represents an urgent challenge for both legislators and the EU-based cephalopod community.
Special considerations for the classification of severity of procedures when using cephalopods
There are more than 800 living cephalopod species,5–7,36 all marine, living in a wide range of habitats from coastal waters to deep sea. Despite being limited in number, when compared to the very populous phylum Mollusca 37 to which they belong, cephalopods are an astonishing example of diversity of forms and functions. Cephalopods have a molluscan Bauplan but illustrate how evolution can generate great complexity, including sophisticated behavioural repertoire and neural plasticity and organisation.29,38,39 Thus, as Hawkins et al. noted for fish, 15 considering cephalopods as a single ‘unit’ has little meaning, as would also be the case if one attempted to produce severity guidance for all mammals. The impact of a given procedure on an animal may differ, depending on the species to which it belongs. So, prospective assessment of severity should take full account of species-specific characteristics. For example, the impact of restraint may vary widely between the shelled Nautilus, cuttlefish, squid and octopus because of their markedly different levels of locomotor activity. Removal of a cephalopod from water may induce stress responses40,41 and therefore may increase the severity of a procedure, but the response to hypoxia differs considerably between species (e.g. Nautilus, 42 cuttlefish, 43 squid 44 and octopus 45 ). So, the impact of a period in air (e.g. during weighing, injection or gavage) needs to be assessed for each species. An additional example is provided by the effects of food deprivation on welfare (reviewed by Sykes et al. 25 ) where assessment of the impact requires an understanding of the diverse nature of the natural diets and feeding habits of cephalopods. 46
For cephalopods, as with other regulated species, when assessing severity classification, the duration of a procedure or its repetition must also be considered in the context of the biology of the species under study. This may move a given procedure from one severity classification to another. 4
In addition to the large interspecific diversity, many cephalopods are known for significant changes in their physiology as part of their life history. 47 Currently, species-specific guidelines on care and use of cephalopods for experimental purposes are missing. However, for example, Fiorito et al., 2 under the aegis of FELASA, the Boyd Group and the COST Action FA1301, provided the first general guidelines on the care and welfare of these animals when used for scientific research. In the guidelines, a series of indicators are recommended to assess animals’ health and welfare regularly and identify factors that may cause deviations from optimal status. 2 Key parameters are proposed to evaluate animal behaviour and appearance, and these are recommended to be supplemented by measurement of a number of physiological ‘biomarkers’. Fiorito et al. 2 also identified possible signs, proposing a gradation as an indication of an escalation from mild to moderate and severe responses/conditions. These include: (a) appearance (physical state, seven indicators), including skin colour, texture and its integrity, abnormal body appearance (e.g. arms unaligned or dangling); (b) behaviour (psychological state, 12 indicators), including unprovoked behaviours (e.g. withdrawal, abnormal motor or locomotor coordination, grooming, wound-directed behaviour), responses to food and provoked behaviours (defaecation, inking, etc.); and (c) clinical (physiological/biochemical state, eight indicators), including reduction in body weight and changes in the rates of ventilation or heart-beat frequency. As recommended, these indicators should be observed and recorded daily. 2
Evidence is emerging for interspecific differences in the response to noxious stimuli which, if confirmed and extended, will impact severity assessment across cephalopod species.48–53 Techniques to manage pain in cephalopods, apart from local and general anaesthesia,2,40–41 are not established, and therefore there is an urgent need to develop methods to both assess and alleviate pain for the commonly used species (about 30 according to Smith et al. 11 ). Finally, there is evidence that cephalopod species may differ in their reaction to the same anaesthetic agent,2,54,55 further emphasising the need to assess the impact of procedures on a species-by-species basis.
The further development and validation of welfare indicators will ensure accurate assessment of actual severity of procedures and objective measurement of the impact of interventions to alleviate pain, suffering and lasting harm. Data on actual assessment of procedures will in turn enable more accurate assessment of the prospective severity of procedures.
A final special consideration for cephalopods is that animals for research may be taken from the wild (e.g. Nautilus pompilius, L. vulgaris, O. vulgaris) as described in Article 10 of Directive 2010/63/EU. In all the survey scenarios, capture and transport were not considered as part of the project. So, their impact does not contribute to the overall severity assessment. However, if a study was undertaken in which capture and transport were part of the scientific objectives of the project, then their impact would need to be included in the overall assessment of any procedure performed on arrival in the laboratory. 4 For example, if a study compared different methods of capture from the wild on the response to a battery of behavioural tests in the laboratory, then the overall severity assessment would be based on the methods of capture, transport and the behavioural tests.
Concluding comments
The results of this COST Action FA1301 PAS-C Survey provide a framework to assist cephalopod researchers in assessing the prospective severity of procedures used in research and in guiding their application to the NCA.
List of possible procedures using live cephalopods (not an exhaustive list) as deduced from the set of scenarios included in the COST Action FA1301 PAS-Survey.
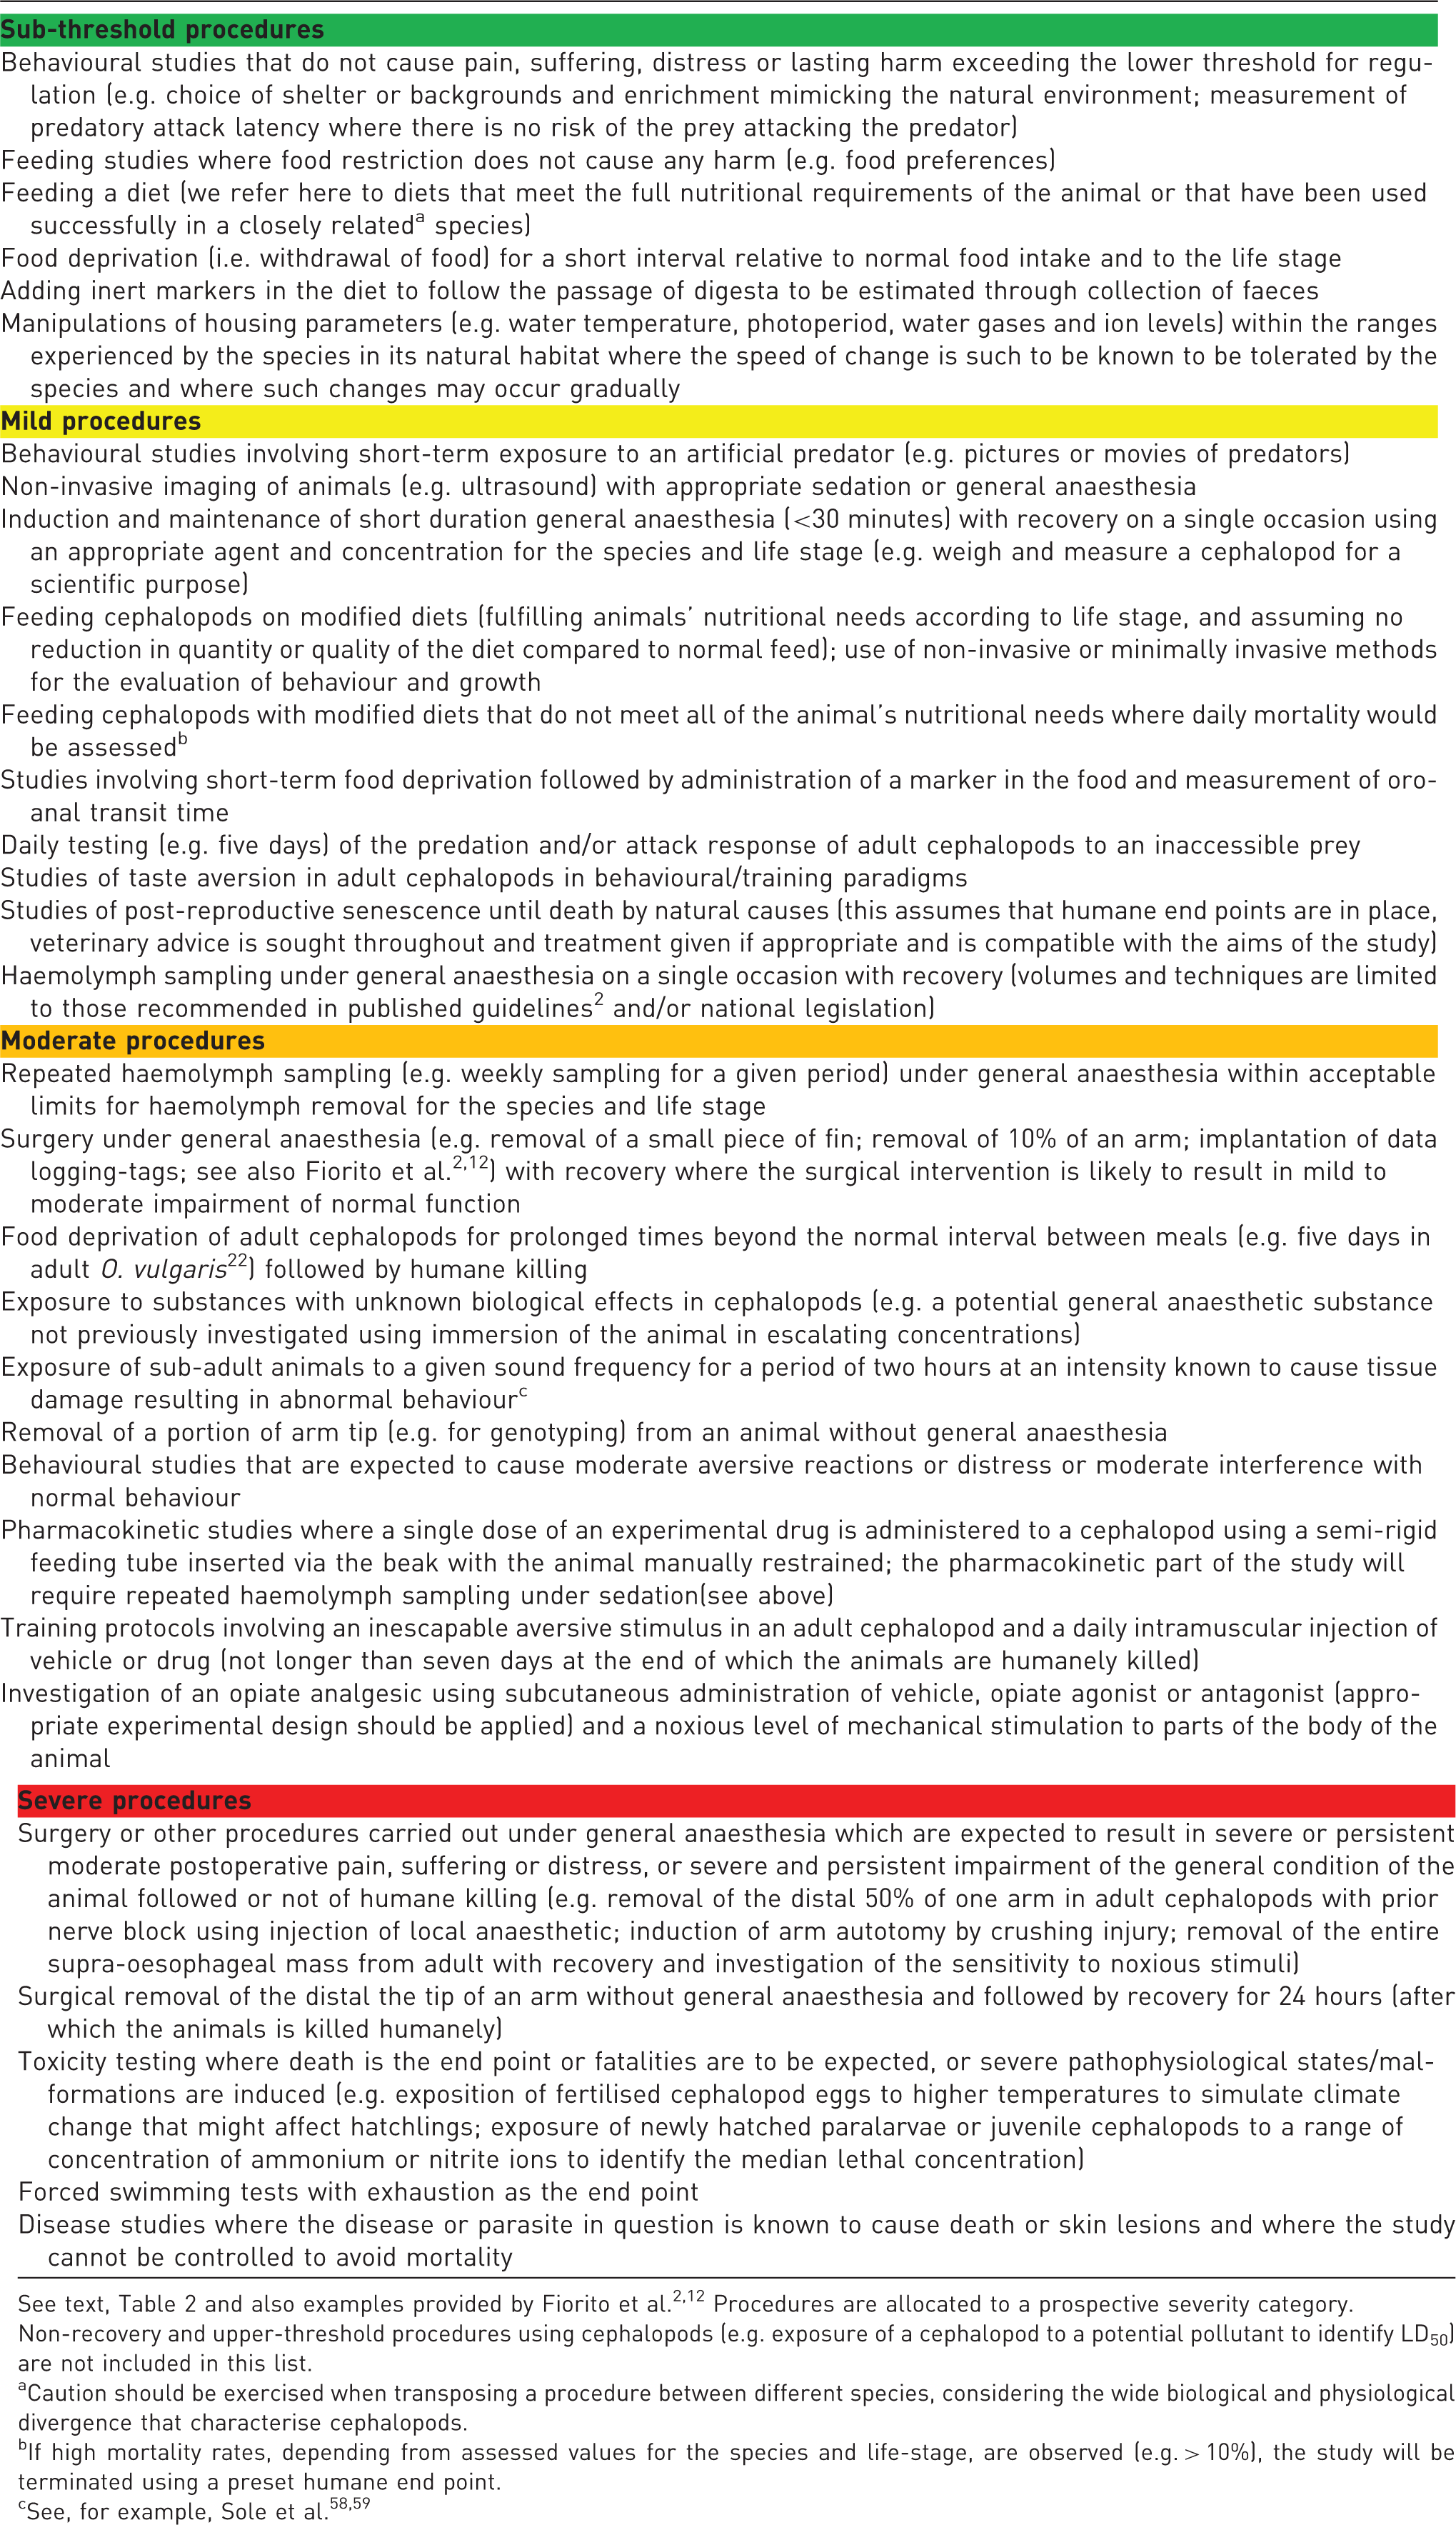
See text, Table 2 and also examples provided by Fiorito et al.2,12 Procedures are allocated to a prospective severity category.
Non-recovery and upper-threshold procedures using cephalopods (e.g. exposure of a cephalopod to a potential pollutant to identify LD50) are not included in this list.
Caution should be exercised when transposing a procedure between different species, considering the wide biological and physiological divergence that characterise cephalopods.
If high mortality rates, depending from assessed values for the species and life-stage, are observed (e.g. > 10%), the study will be terminated using a preset humane end point.
The experience of the cephalopod community in responding over the last five years to the multiple challenges resulting from the EU-wide regulation of an entire invertebrate class provides a model, should regulation be extended to other invertebrates (e.g. decapod crustacea; see Norwegian Regulation on the use of animals in research that is currently protecting living vertebrates, decapod crustaceans and cephalopods https://lovdata.no/dokument/SF/forskrift/2015-06-18-761).2,12,56 The EU-wide research community approach using web-based assessment of scenarios that we have taken here has wider applicability to obtaining views about severity assessment in other research areas.
Supplemental Material
Supplemental Material1 - Supplemental material for Prospective severity classification of scientific procedures in cephalopods: Report of a COST FA1301 Working Group survey
Supplemental material, Supplemental Material1 for Prospective severity classification of scientific procedures in cephalopods: Report of a COST FA1301 Working Group survey by Gavan M Cooke, David B Anderson, Marie-Laure Begout, Ngaire Dennison, Daniel Osorio, Belinda Tonkins, Tore Kristiansen, Graziano Fiorito, Viola Galligioni, Giovanna Ponte and Paul LR Andrews in Laboratory Animals
Supplemental Material
Supplemental Material2 - Supplemental material for Prospective severity classification of scientific procedures in cephalopods: Report of a COST FA1301 Working Group survey
Supplemental material, Supplemental Material2 for Prospective severity classification of scientific procedures in cephalopods: Report of a COST FA1301 Working Group survey by Gavan M Cooke, David B Anderson, Marie-Laure Begout, Ngaire Dennison, Daniel Osorio, Belinda Tonkins, Tore Kristiansen, Graziano Fiorito, Viola Galligioni, Giovanna Ponte and Paul LR Andrews in Laboratory Animals
Supplemental Material
Supplemental Material3 - Supplemental material for Prospective severity classification of scientific procedures in cephalopods: Report of a COST FA1301 Working Group survey
Supplemental material, Supplemental Material3 for Prospective severity classification of scientific procedures in cephalopods: Report of a COST FA1301 Working Group survey by Gavan M Cooke, David B Anderson, Marie-Laure Begout, Ngaire Dennison, Daniel Osorio, Belinda Tonkins, Tore Kristiansen, Graziano Fiorito, Viola Galligioni, Giovanna Ponte and Paul LR Andrews in Laboratory Animals
Supplemental Material
Supplemental Material4 - Supplemental material for Prospective severity classification of scientific procedures in cephalopods: Report of a COST FA1301 Working Group survey
Supplemental material, Supplemental Material4 for Prospective severity classification of scientific procedures in cephalopods: Report of a COST FA1301 Working Group survey by Gavan M Cooke, David B Anderson, Marie-Laure Begout, Ngaire Dennison, Daniel Osorio, Belinda Tonkins, Tore Kristiansen, Graziano Fiorito, Viola Galligioni, Giovanna Ponte and Paul LR Andrews in Laboratory Animals
Footnotes
Acknowledgements
We thank all respondents and colleagues who provided comments in the pilot stage of the survey, particularly Professor A. Olsson (Portugal), Dr J. Lenehan (Irish Republic) and Dr A. O’Keeffe (Irish Republic).
This study was performed under the auspices of COST Action FA1301, benefited from its networking activities and is considered a contribution to the European COoperation on Science and Technology (COST) Action FA1301 ‘A network for improvement of cephalopod welfare and husbandry in research, aquaculture and fisheries’ (![]() ). The authors wish to thank Stefania Grella for assistance in web enabling the survey and preliminary extraction of data from the survey responses. We also wish to thank all those who responded to the survey and sent comments, as well as colleagues who asked insightful questions at various preliminary presentations of the data and which were considered in drafting the manuscript. Dr T. Shaw is thanked for assistance with the initial dendrogram analysis.
). The authors wish to thank Stefania Grella for assistance in web enabling the survey and preliminary extraction of data from the survey responses. We also wish to thank all those who responded to the survey and sent comments, as well as colleagues who asked insightful questions at various preliminary presentations of the data and which were considered in drafting the manuscript. Dr T. Shaw is thanked for assistance with the initial dendrogram analysis.
Declaration of Conflicting Interests
The author(s) declared no potential conflicts of interest with respect to the research, authorship and/or publication of this article.
Funding
The author(s) received no financial support for the research, authorship and/or publication of this article.
Supplemental Material
Supplemental material for this article is available online.
References
Supplementary Material
Please find the following supplemental material available below.
For Open Access articles published under a Creative Commons License, all supplemental material carries the same license as the article it is associated with.
For non-Open Access articles published, all supplemental material carries a non-exclusive license, and permission requests for re-use of supplemental material or any part of supplemental material shall be sent directly to the copyright owner as specified in the copyright notice associated with the article.