
Abstract
Concerning standardization of laboratory animal husbandry, only exiguous changes of habitat can potentially influence animal physiology or results of behavioral tests. Routinely, mice chow is dyed when different types of diets are dispensed. Given the fact that the dye itself has no effects on food odor or flavor, we wanted to test the hypothesis that the color of chow has an impact on food uptake in mice.
Twelve-week-old male mice of different strains (C57BL/6J, DBA/2J, C3H/HeJ, BALB/cJ; n = 12/strain) were single-housed in PhenoMaster® cages. After acclimatization standard mice chow in different colors was administered. Food intake was monitored as a two-alternative choice test of different color combinations.
All animals had an average food intake of 3 g/d and no preferences were observed when a combination of identically colored food was offered. Preference tests yielded significant aversion to blue food and significant attraction to yellow and green food in C57BL/6 and DBA/2J mice. In C3H/HeJ and BALB/cJ mice no color-related pattern occurred.
Selected mice strains have known differences concerning functionality of their visual sense. C57BL/6 and DBA/2 mice are considered to be normal sighted at testing age, BALB/c is representative for albino strains and C3H mice carry mutations resulting in retinal alterations. Results suggesting that normal-sighted mice would be selective concerning food color when given the choice. Nevertheless, this does not influence overall quantity of food intake when animals were provided solely with food colored with a single dye. Moreover, visually impaired mice showed no color-related food preferences.
Introduction
In the second half of the last century much effort was spent on standardizing experimental animal husbandry aiming to create a robust rationale, as it became increasingly obvious, that animal care and housing itself has potential impact on in vivo studies.1,2 For example, in animal facilities the implementation of an artificial 12-hour-light and 12-hour-dark regimen is acknowledged worldwide. The idea of installing this circadian light rhythm is based on the observation that most organisms on earth feature a biological clock running a 24-hour cycle.3,4
Despite providing experimental animals with a controlled light system, not much is known about the impact of colors in this setting. As mice and rats are regarded as crepuscular creatures in general exhibiting activity peaks at the beginning and at the end of the 12-hour nocturnal phase, colors simply were neglected, as the spectral composition of light is not sufficient enough for adequate visual discrimination. 5
The ability to discriminate colors is due to the individual’s biological endowments of the visual system, thereby recording changes in the spectral composition. We know that vertebrates exhibit different color vision systems depending on the evolutionary configuration of their class of cone receptors. 6 As diurnal creatures like humans and primates belong to the class of trichromates harboring three cone pigments, in contrast rodents commonly have only two.7,8 Like most mammals, mice therefore belong to the dichromates whose retina contains two classes of cone photopigments with absorption maxima at approximately 360 nm (ultraviolet sensitive) and 510 nm (green sensitive), red cones being absent.9,10
Thus, normal-sighted laboratory mouse strains like C57BL/6 are expected to detect short-wave light, even in ultraviolet ranges, but are unable to see colors with long wavelengths, like red. Moreover, there are several mouse strains (e.g. DBA/2, C3H) that develop visual impairments with time or are albinotic (like BALB/c). DBA/2 mice develop progressive eye abnormalities that closely mimic human hereditary glaucoma, having its onset between 3 and 4 months of age. Clinical signs include iris pigment dispersion, associated with iris atrophy, synechia, and elevated intraocular pressure.11,12 C3H mice are homozygous for the Pde6b rd1 allele. Retinal degeneration 1 (Pde6brd1) is a spontaneous mutation that is present in multiple inbred strains, including the C3H substrains. Strains that carry rd1 lack rod cells, becoming blind by weaning age.13,14 BALB/c mice, comparable to other albinotic animals of other species, have a significantly lower visual performance than C57BL/6 mice, due to albinism. 15 Albinism is a mutation in the tyronase gene, the rate-limiting enzyme in melanin synthesis (brown-black eumelanin, red-yellow pheomelanin), resulting in hypopigmentation of the retinal pigment epithelium. 16 Interestingly, in mice, a correlation exists between the levels of melanin and rod numbers, so that entirely pigment-deficient mice have the lowest number of rods. 17
In addition to normal-sighted mouse strains, albinotic animals and others with visual impairment are implemented in scientific animal research. It can be hypothesized that the sensation of color is eminently different in varying mice strains, thereby accounting for a possible variability in in vivo experiments.
Routinely, in biomedical research special diets are administered to mice, as this enables researchers to provide (or undersupply) animals with elected components, featuring low stress, compared to application methods like oral gavage or injections. These diets are strictly controlled under the aspects of fulfilling the nutritional needs of the animals, palatability and stability in order to prevent random variations concerning the phenotypic expressions. There is strong evidence that nutritional factors can implicate behavioral development in mice, even comparable to genotypic manipulations. To facilitate the discrimination for the user between different diets administered to different experimental groups, diets are dyed, presupposing that the color of the provided chow is without impact on food intake. The dyes belong to the class of food dyes and are expected to fulfil the requirements of being neutral in taste, non-toxic and having no effects on metabolism. Whether the color has a possible impact on behavior associated with preferences or aversions resulting in alterations of chow consumption has not been investigated before. Therefore, the aim of this study was to solely investigate the impact of color on the feeding habits of different strains of laboratory mice depending on their eyesight.
Material and methods
Animals
All mice were bred in house in the animal facility of the German Institute for Human Nutrition (Nuthetal, Germany). Mice were reared in individually ventilated cages (SealSafe-IVC blue line, Tecniplast, Hohenpeißenberg, Germany) under specific, pathogen-free conditions and housed in groups (three to five animals per cage) under standard laboratory housing conditions (temperature: 22 ± 0.5℃, humidity: 50 ± 10%) with a diurnal 12-hour light and dark cycle (lights on at 6:30 a.m.). Animals had free access to fresh tap water and food. Cages were equipped with aspen wood chips (LTE E-001; ABEDD Vertrieb GmbH, Wien, Austria), a paper towel and cotton fiber (Alpha-Nest; LBS Serving Biotechnology, Horley, UK) as nesting material and cardboard houses (Des.Res™; LBS Serving Biotechnology, Horley, UK) as shelter. For this study, surplus animals from in-house breeding were used. Since only male mice of the mouse strains of interest were available in sufficient quantity, female mice were excluded.
All animal experiments were performed in compliance with the German animal protection law (TierSchG). Mice were housed and handled in accordance with good animal practice as defined by Federation of European Laboratory Animal Science Associations (FELASA) (www.felasa.eu/guidelines.php) and the national animal welfare body GV-SOLAS (www.gv-solas.de/index.html). The local authorities approved all animal experiments (LAGV Brandenburg, Germany; permit number: V3-2347-03-2011).
Diets and study design
At the age of 12 weeks male mice of four different strains (C57BL/6J, DBA/2J, C3H/HeJ, BALB/cJ; n = 12/strain) were randomized into different study groups. For assessment of detailed food intake animals were transferred for single-housing into PhenoMaster® cages (TSE-Systems, Bad Homburg, Germany). Housing conditions, equipment and level of enrichment in PhenoMaster® cages were equivalent to rearing cages. Animals were allowed to acclimatize for one week on standard mice chow (SC 1320; Altromin, Lage, Germany) and food consumption was assessed dependent on time of day. PhenoMaster® cages are equipped with two measuring stations for monitoring food intake and a single station for water. Food containers are placed oppositely in the short corners of the cage and were changed daily in order to exclude side preferences of the animals. After acclimatization and performance of visual placing response (see below) chow of different colors was administered at the age of 13 weeks. The food color green (g) corresponds to the “natural” color of the SC 1320. Red (r), blue (b) and yellow (y) food was dyed on the basis of the SC 1320. Chow was prepared by the manufacturer Altromin, Lage, Germany) simultaneously from one charge in the mill and was stored at –20℃ afterward in the animal facility until usage. Before feeding portions of food were defrosted at room temperature. This regimen was performed in order to prevent time-dependent effects on the food ingredients due to storage. Food intake was monitored as a two-alternative choice test of different color combinations (g/b; g/r; g/y; y/r; y/b; r/b; y/y; r/r; b/b; g/g); measuring period: seven days per combination). Color combinations were provided in randomized order between animals of each mouse strain to exclude age-related color preferences. Before a new combination was applied, animals were allowed to equilibrate on SC for one day.
Visual placing response
To assess the function of the visual system before beginning the two-alternative choice test, a visual placing response modified from Metz and Schwab 18 and Pinto and Enroth-Cugell 19 was performed. At the age of 13 weeks each mouse was suspended by holding its tail and then lowered toward a solid object (a fixed external cage grid) for one to two seconds without any contact with the vibrissae. Normally, when the head of the mouse was moved near the grid, it raised its head and extended the forelimbs to place them onto the grid. The procedure was conducted three times per animal and averaged. Reaction was rated with a scoring system: 0 represents no observable placing response, 1 indicates a weak and 2 a clear visual placing reaction.
Statistical analysis
All statistical analyses were performed using IBM SPSS 23 (IBM Deutschland GmbH, Germany). All data were checked for normal distribution (Shapiro–Wilk test) and for homogeneity of variances (Levene’s test for equality of variances) and the appropriate statistical test was performed. To reveal differences of three or more independent samples (comparison of mouse strains), one-way analysis of variance (ANOVA) was used for interval-scaled data, which are normally distributed, and the Kruskal–Wallis test for non-normally distributed data. Since all according data were normally distributed, for comparison of food consumption per mouse strain (e.g. left compared to right food rack) unpaired T test was applied. P values below 0.05 were considered significant for all analyses (*p ≤ 0.05, **p ≤ 0.01, ***p ≤ 0.005). All data are presented as mean ± standard deviation (SD).
Results
Visual placing response
Performance in visual placing response differed significantly between mouse strains (Kruskal–Wallis test; p ≤ 0.005). Approaching the cage grid, C57BL/6J (reaction score: 1.45 ± 0.51) and DBA/2J (1.30 ± 0.47) mice responded immediately to the visual stimulus. Mouse strains being potentially blind at testing age, C3H/HeJ (0.10 ± 0.31) and BALB/cJ (0.10 ± 0.31), failed significantly to react appropriately (Figure 1).
Performance in visual placing response. Graph shows reaction scores in the performance of visual placing response of C57BL/6J, DBA/2J, C3H/HeJ and BALB/cJ mice (n = 12 per group): Asterisks indicate significances: *p ≤ 0.05, **p ≤ 0.01, ***p ≤ 0.005; Kruskal–Wallis test. Data presented as means (±SD).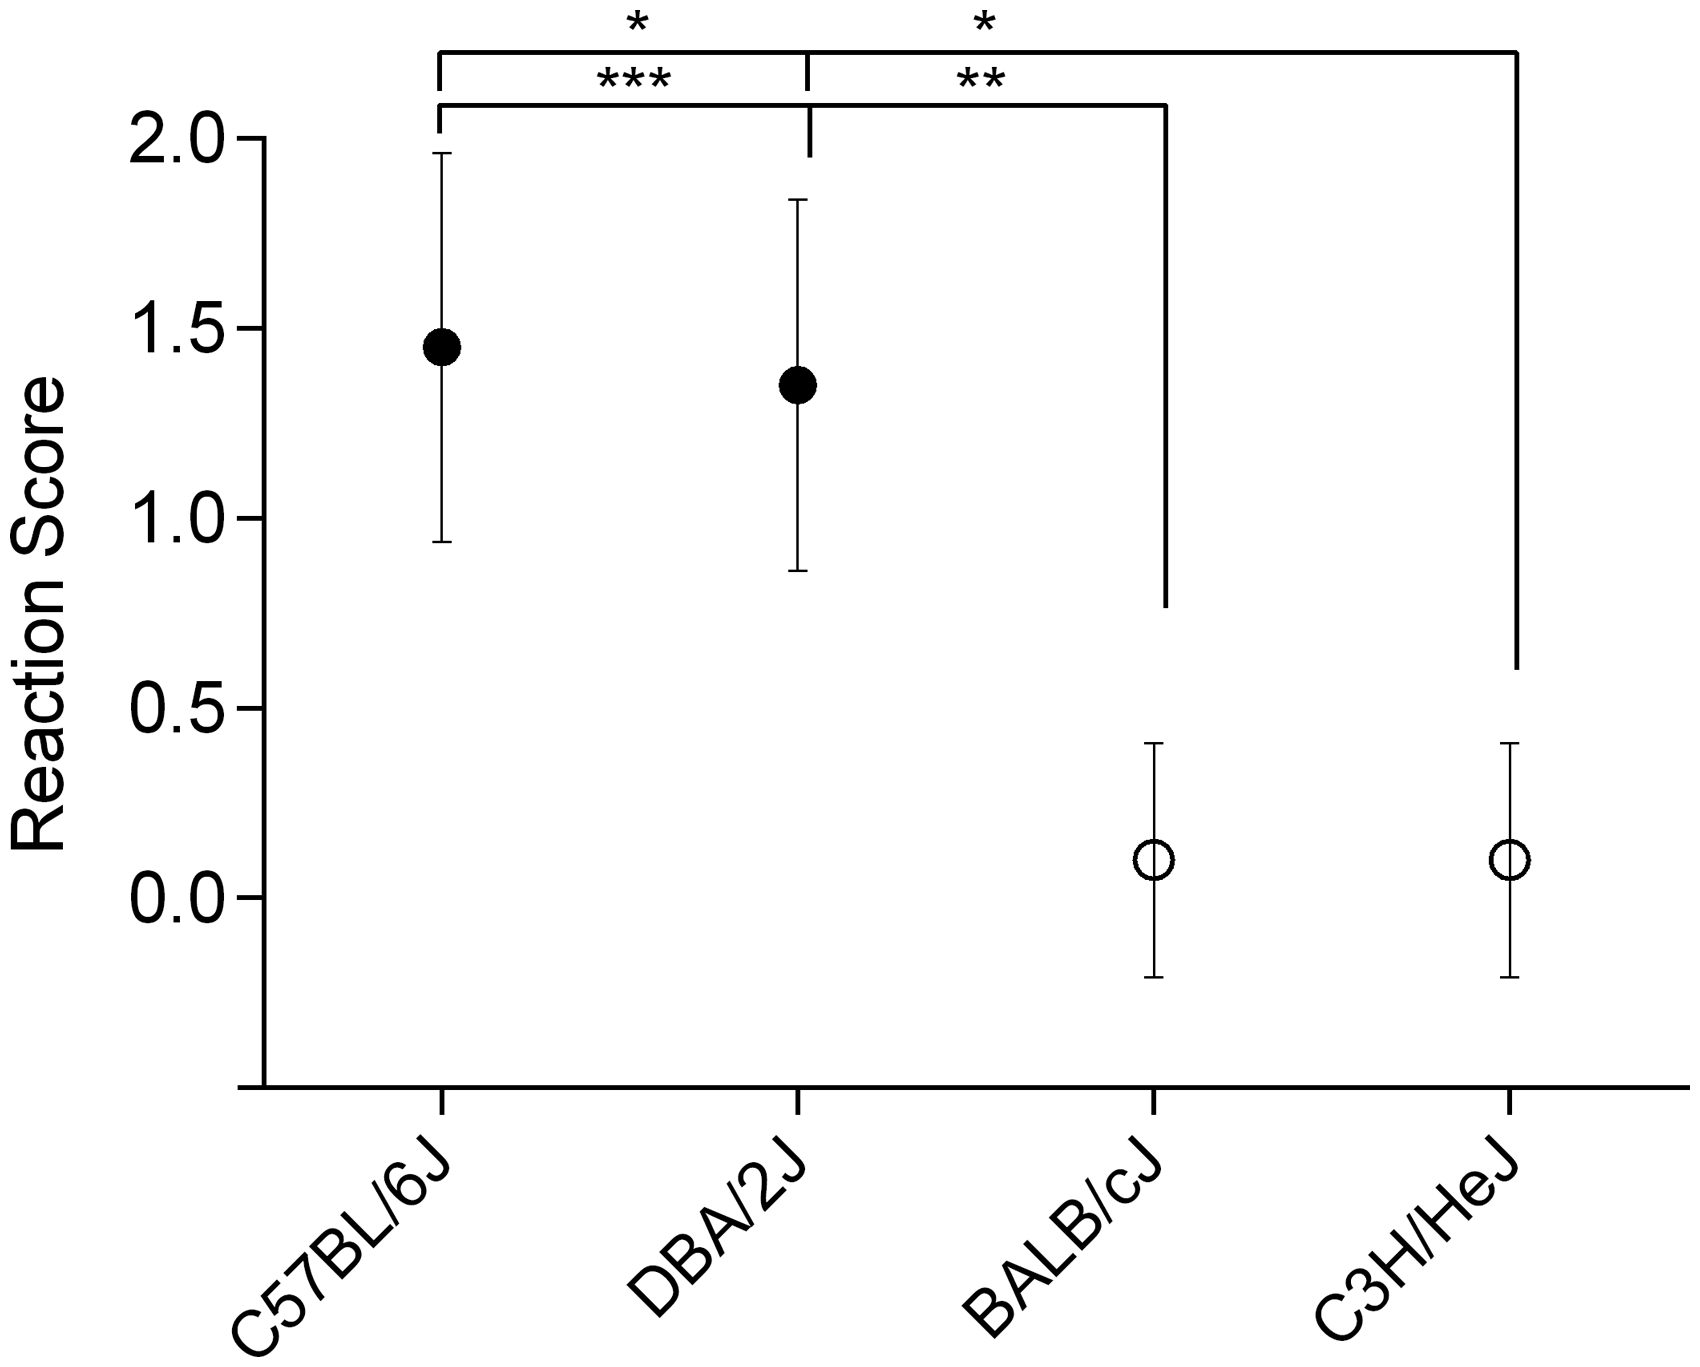
Average food consumption
Average food consumption was assessed by monitoring intake of SC at the beginning of the experiment. The different mice strains showed some individualities concerning the quantity (C57BL/6J 18.2 ± 1.36, DBA/2J 20.5 ± 2.43, C3H/HeJ 22.1 ± 1.84 and BALB/cJ 18.2 ± 1.82 g/week; one-way ANOVA; no significance), but had in common that most food was eaten in the dark phase (D) compared to the light phase (L) (C57BL/6J L:4.9 ± 0.17, D:13.3 ± 1.29 g/week; DBA/2J L:3.8 ± 0.24, D:16.6 ± 2.30 g/week; C3H/HeJ L:7.5 ±0.36, D:14.6 ± 1.78 g/week; BALB/cJ L:4.8 ± 0.31, D:13.4 ± 1.73 g/week; unpaired T test; p ≤ 0.05; Figure 2).
Average food intake per animal per week (standard chow). Graph shows the average food intake (standard chow) per animal per week (g/week) monitored depending on the light and dark phase during husbandry of C57BL/6J, DBA/2J, C3H/HeJ and BALB/cJ mice (n = 12 per group) at the beginning of the experiment. One-way analysis of variance revealed no significant differences in overall food consumption. Unpaired T test revealed significant differences depending on light or dark phase for all mouse strains; ***p ≤ 0.005. Data presented as means (±SD).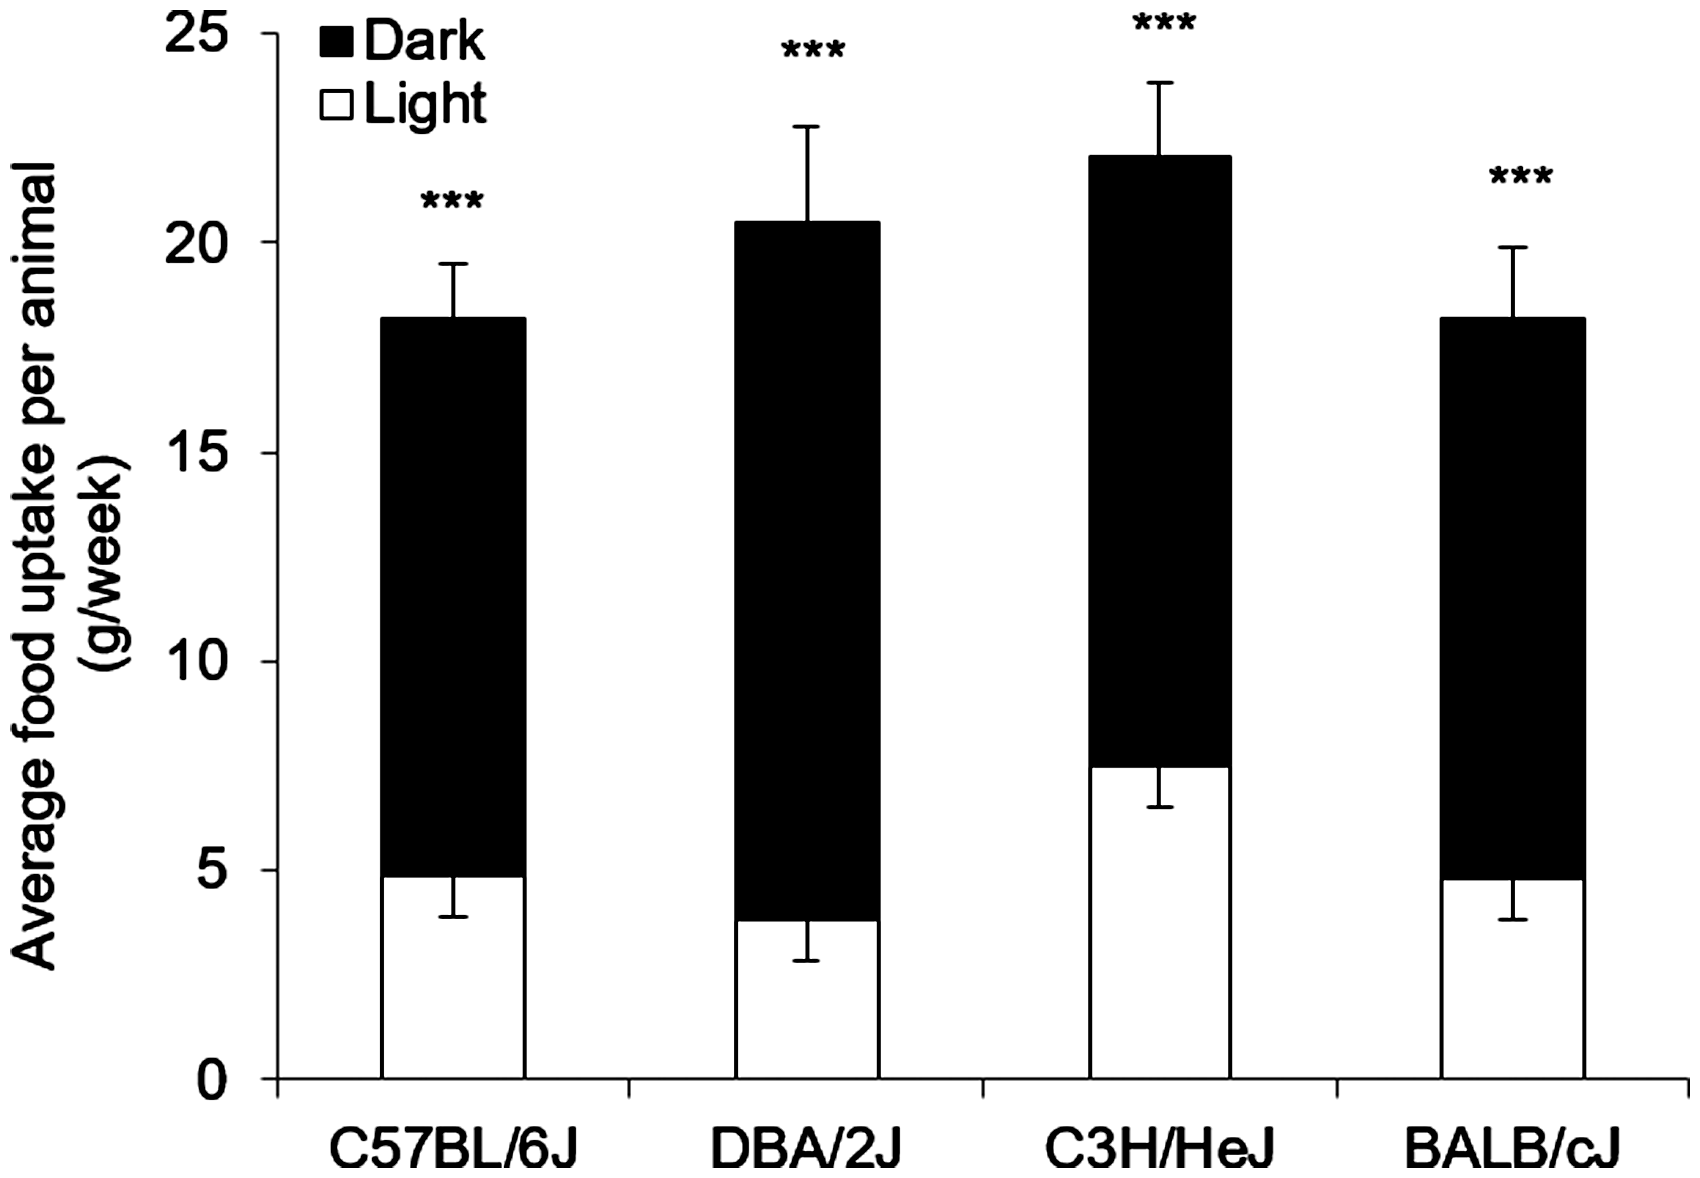
Relative food consumption of C57BL/6J
Concerning the two-alternative choice test, normal-sighted C57BL/6J mice discriminated significantly between offered food options (one-way ANOVA; p ≤ 0.005). They always preferred yellow to green, red and blue and preferred green to red and blue. Blue was the color that they preferred less. In total the consumption of yellow food dominated with 36 ± 2.3%, followed by green with 25 ± 3.6%, red with 24 ± 7.4% and blue with 15 ± 3.4% (one-way ANOVA; p ≤ 0.005; Figure 3).
Average food intake of C57BL/6J and DBA/2J mice per week (experimental chow). Graphs show the average food intake of green- (dashed), blue- (horizontal lines), yellow- (uniform) and red- (vertical lines) stained food for each combination (E1–E6) of (a) C57BL/6J mice (n = 12) and (b) DBA/2J mice (n = 12); per animal per week (g/week) assessed with a two-choice preference test; unpaired T test; ***p ≤ 0.005 and relative intake of administered stained food (%) averaged per color over all time points for (c) C57BL/6J and (d) DBA/2J mice.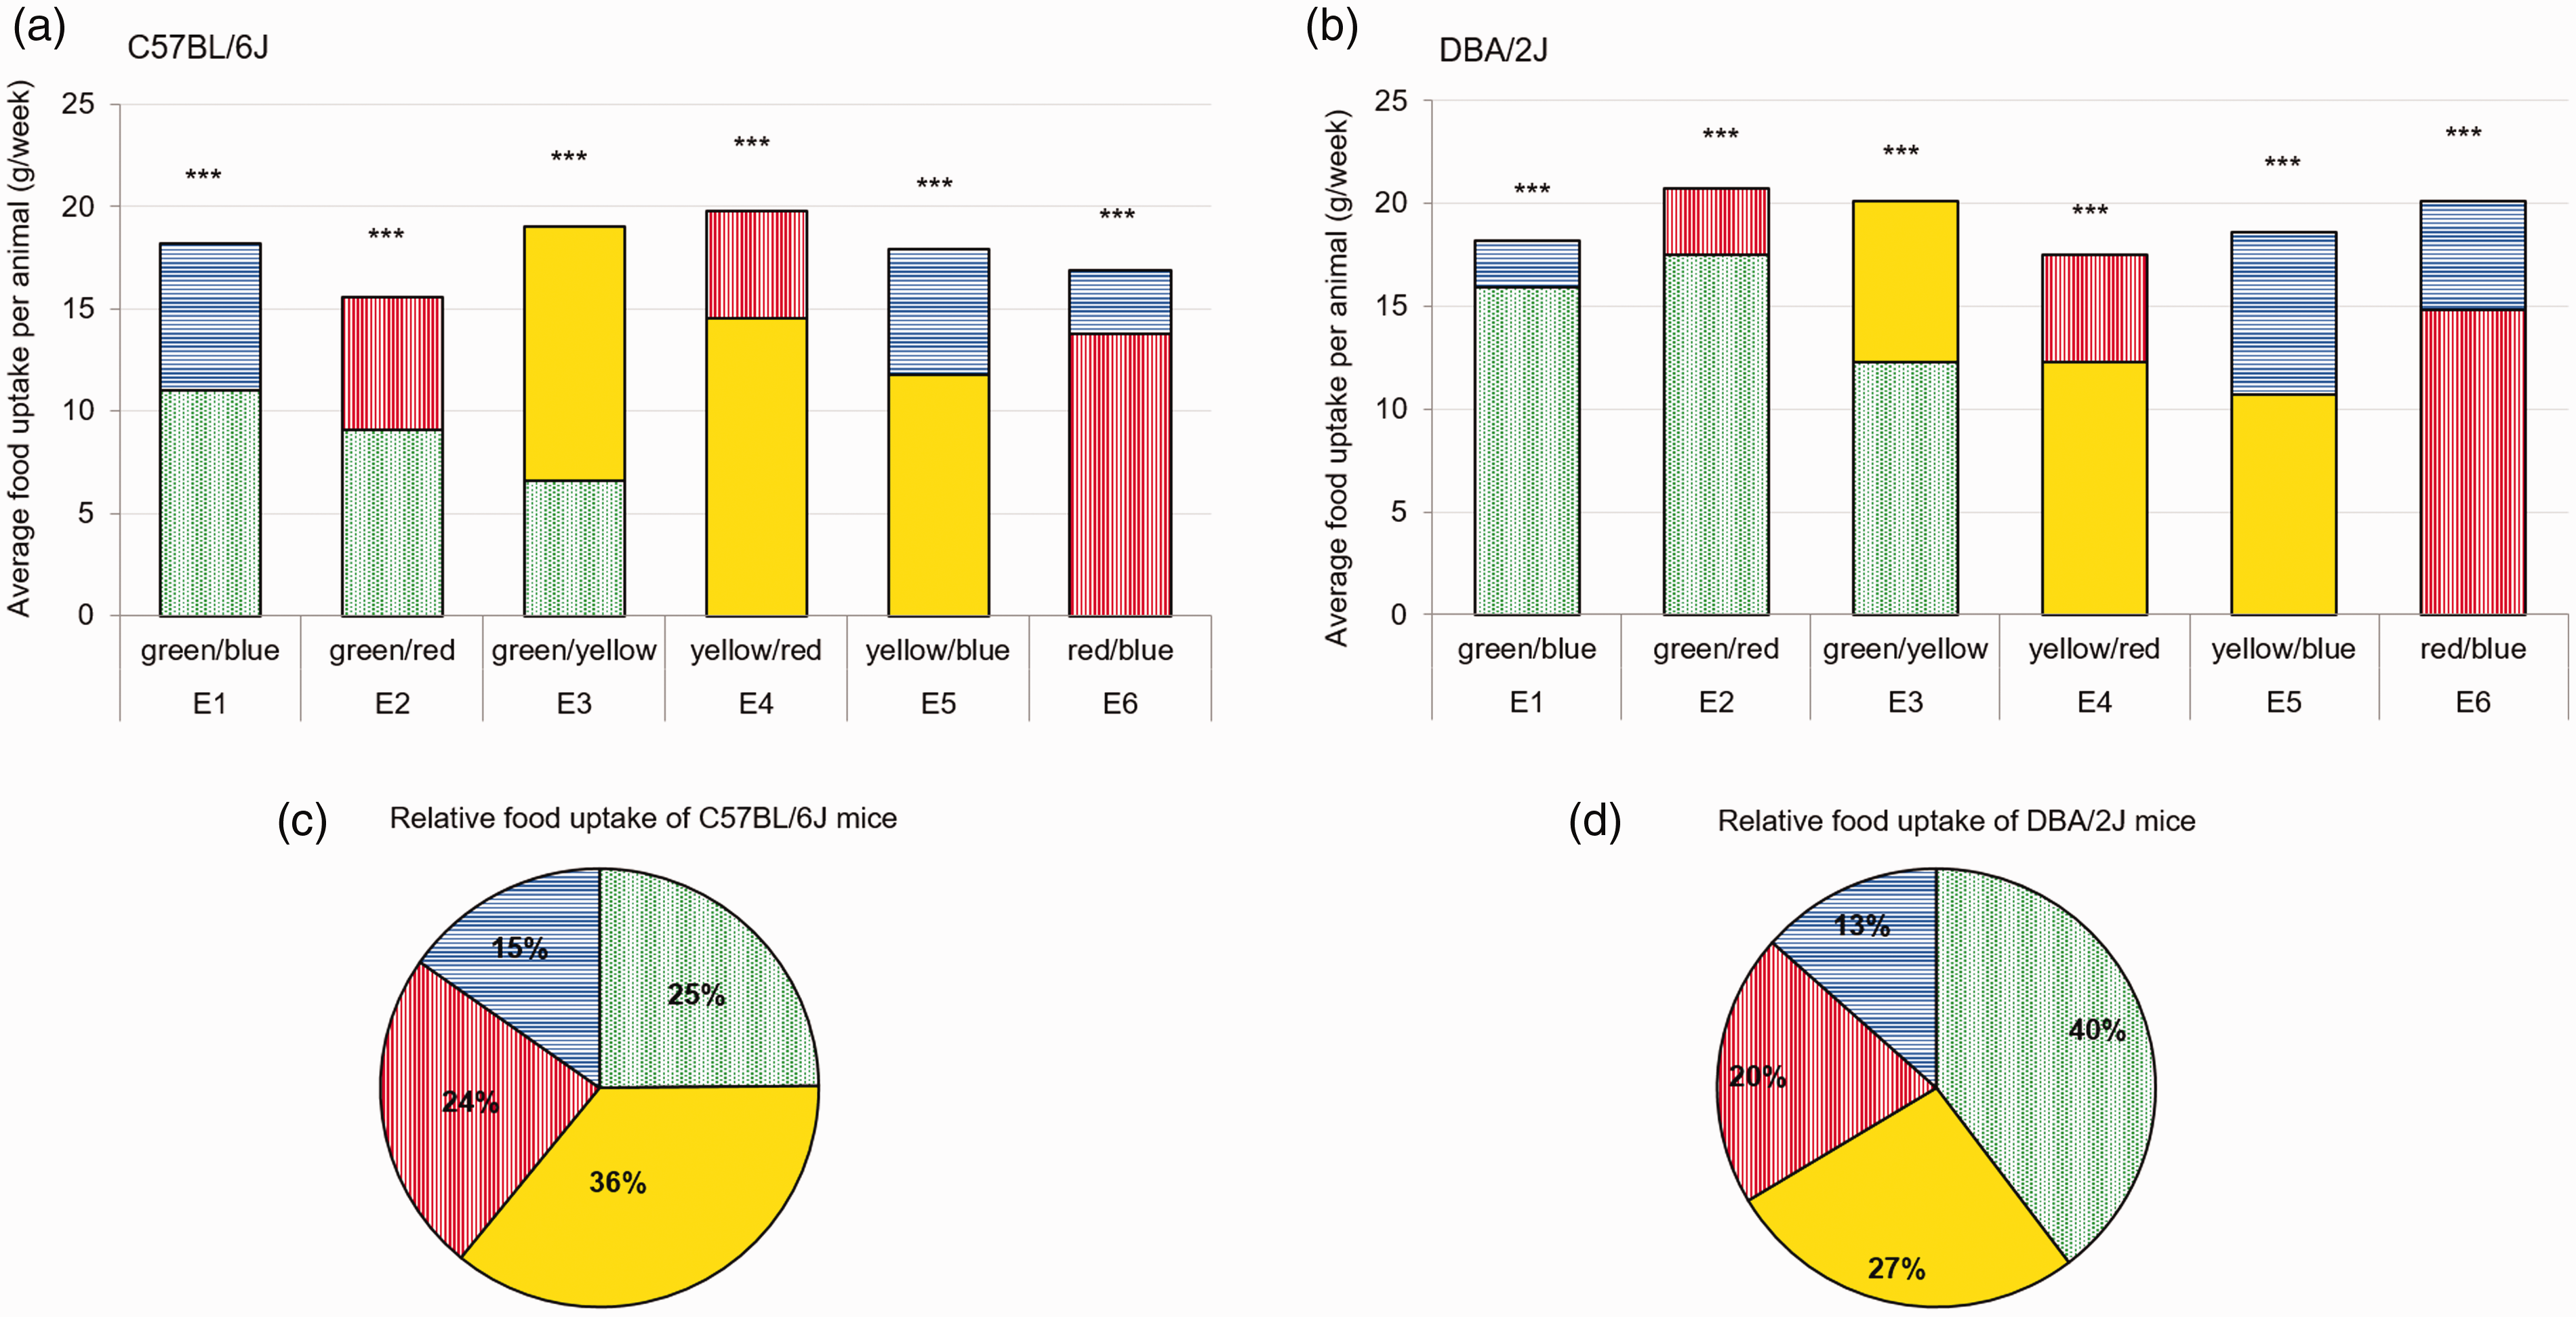
Relative food consumption of DBA/2J
Comparable to the C57BL/6J mice, DBA/2J discriminated significantly between offered food options (one-way ANOVA; p ≤ 0.005), but showed a strong preference for green food. Thereby, they always preferred green to yellow, red and blue and preferred yellow to red and blue. Again blue was the color that was preferred less. In total the consumption of green food dominated with 40 ± 4.0%, followed by yellow with 27 ± 3.4%, red with 20 ± 9.4% and blue with 13 ± 4.2% (one-way ANOVA; p ≤ 0.005; Figure 3).
Relative food consumption of C3H/HeJ
In contrast to C57BL/6J and DBA/2J, no specific preference pattern could be observed in the C3H/HeJ mice, even if a significantly higher consumption of green food directly compared to yellow (unpaired T test; p ≤ 0.005) and yellow food directly compared to red (unpaired T test; p ≤ 0.05) could be detected. Nevertheless, concerning the overall consumption, no significance could be detected and the intake of green food preferences were 26 ± 6.3%, yellow at 24 ± 5.0%, red at 22 ± 4.0% and blue at 28 ± 2.6% (Figure 4).
Average food intake of C3H/HeJ and BALB/cJ mice per week (experimental chow). Graphs show the average food intake of green- (dashed), blue- (horizontal lines), yellow- (uniform) and red- (vertical lines) stained food for each combination (E1–E6) of (a) C3H/HeJ mice (n = 12) and (b) BALB/cJ mice (n = 12); per animal per week (g/week) assessed with a two-choice preference test; unpaired T test; *p ≤ 0.05; ***p ≤ 0.005 and relative uptake of administered stained food (%) averaged per color over all time points for (c) C3H/HeJ and (d) BALB/cJ mice.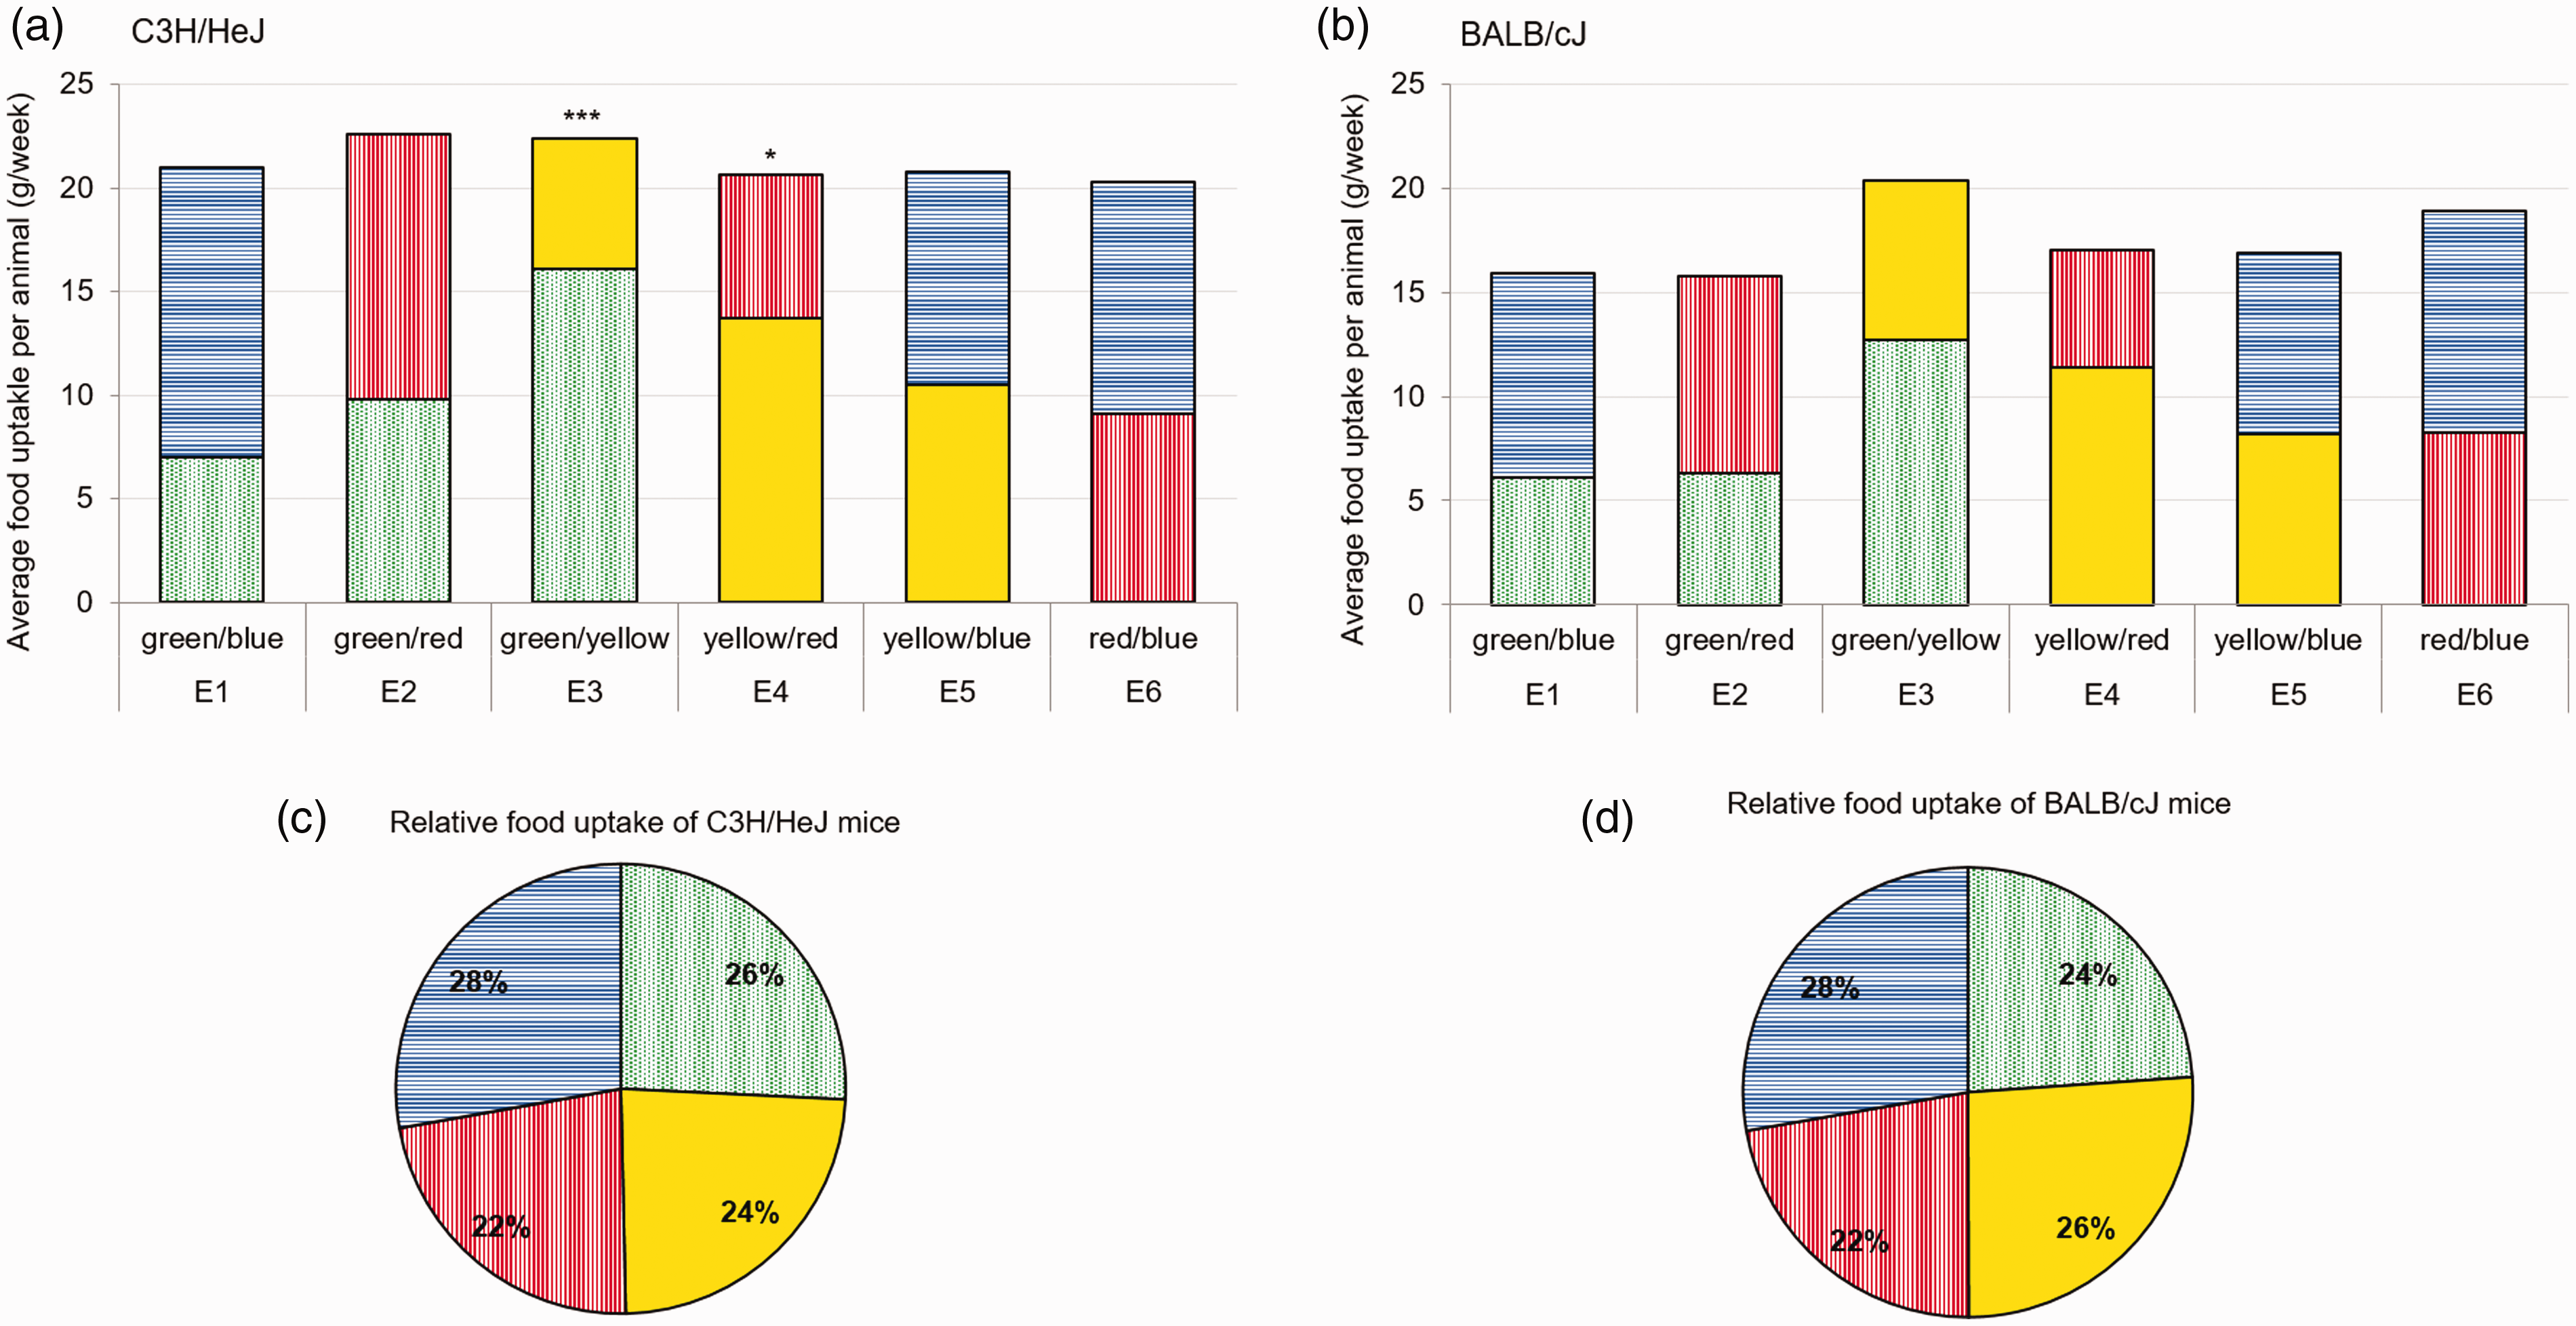
Relative food consumption of BALB/cJ
As the albinotic mouse strain BALB/cJ is considered to be visually impaired, as expected no specific attraction concerning food color could be observed. In total BALB/cJ mice consumed 24 ± 6.2% of green food, 26 ± 3.3% of yellow food, 22 ± 3.3% of red food and 28 ± 1.6% of blue food (Figure 4).
Cumulated food consumption
At the end of the experiment an additional side-by-side comparison was performed in order to exclude side preferences. Therefore, food of the same color was provided in the two-alternative choice test, whereas the choice that had to be made was not the color of food, as it was identical, but the side of offered food in the cage. For all mice strains no side preferences could be detected (Figure 5).
Assessment of possible side preferences for food consumption. Graphs show (a) average food uptake of food of the same color: green (dashed), blue (horizontal lines), yellow (uniform) and red (vertical lines) of C57BL/6J, DBA/2J, C3H/HeJ and BALB/cJ mice (n = 12 per group) per animal per week (%/week) assessed with a two-choice preference test (line between same-colored bar indicates left or right food rack) and (b) relative overall intake of administered stained food (%).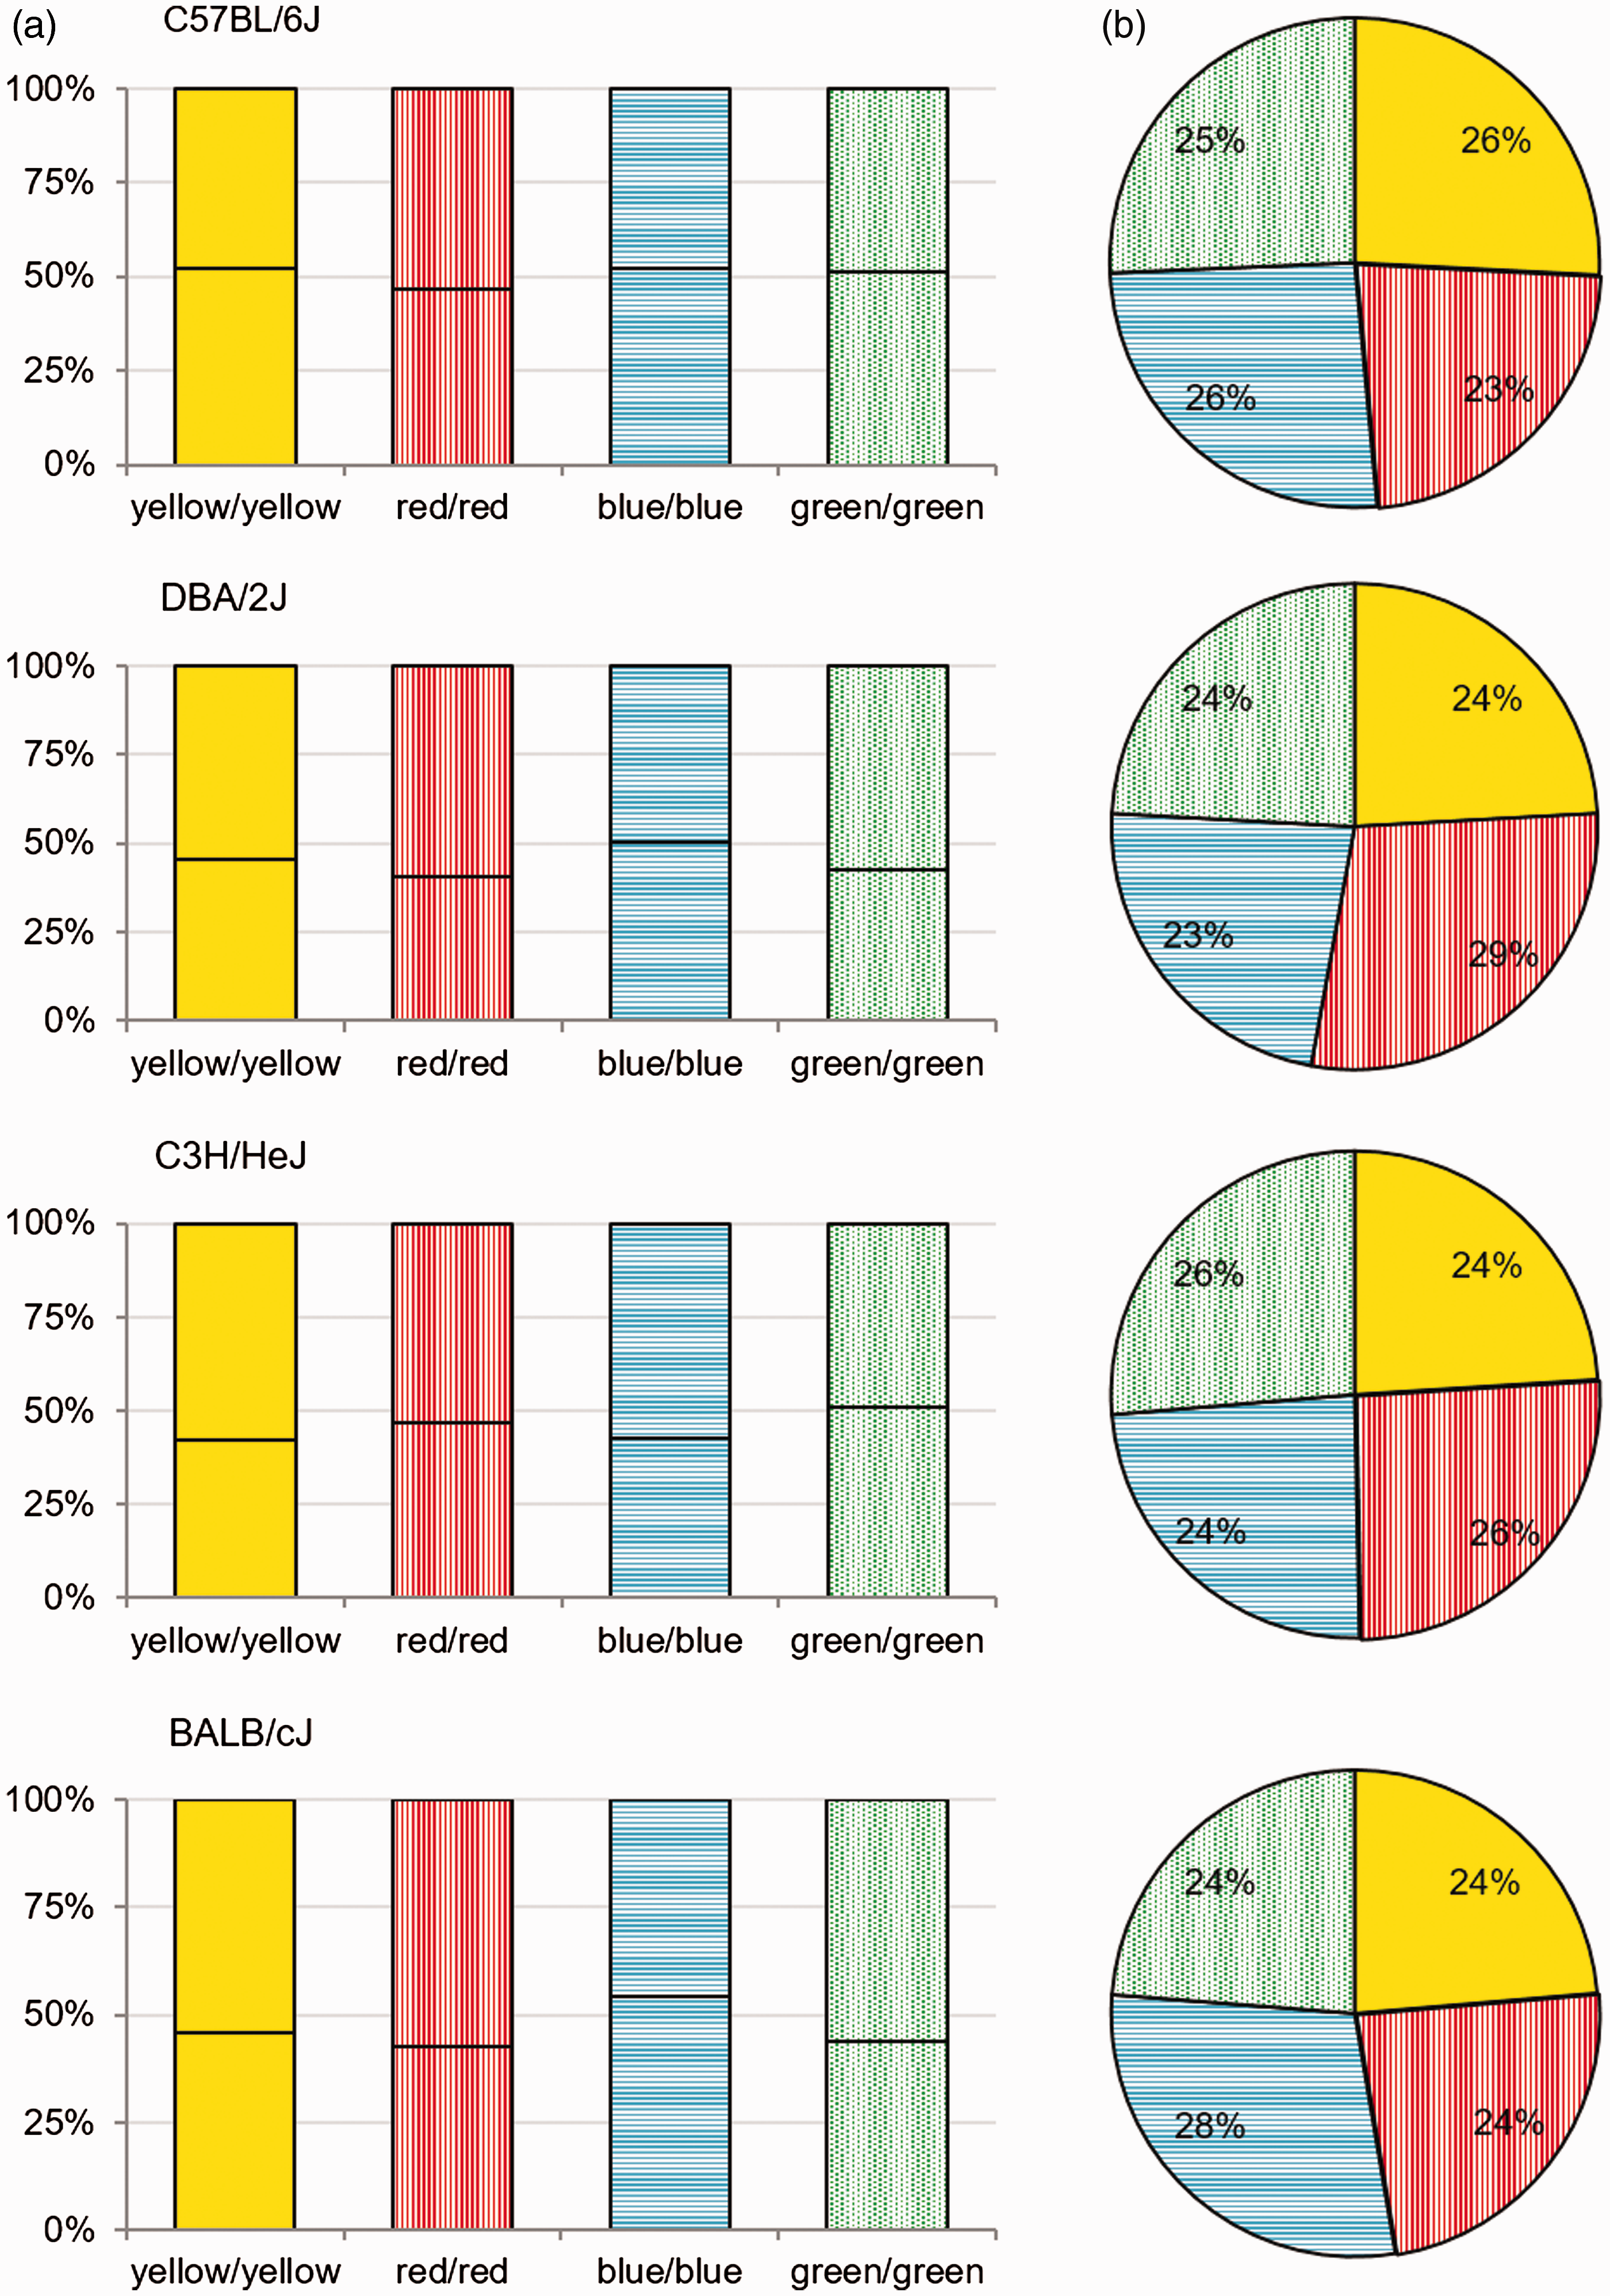
Two-alternative-choice-test for assessment of side preferences and average food uptake.
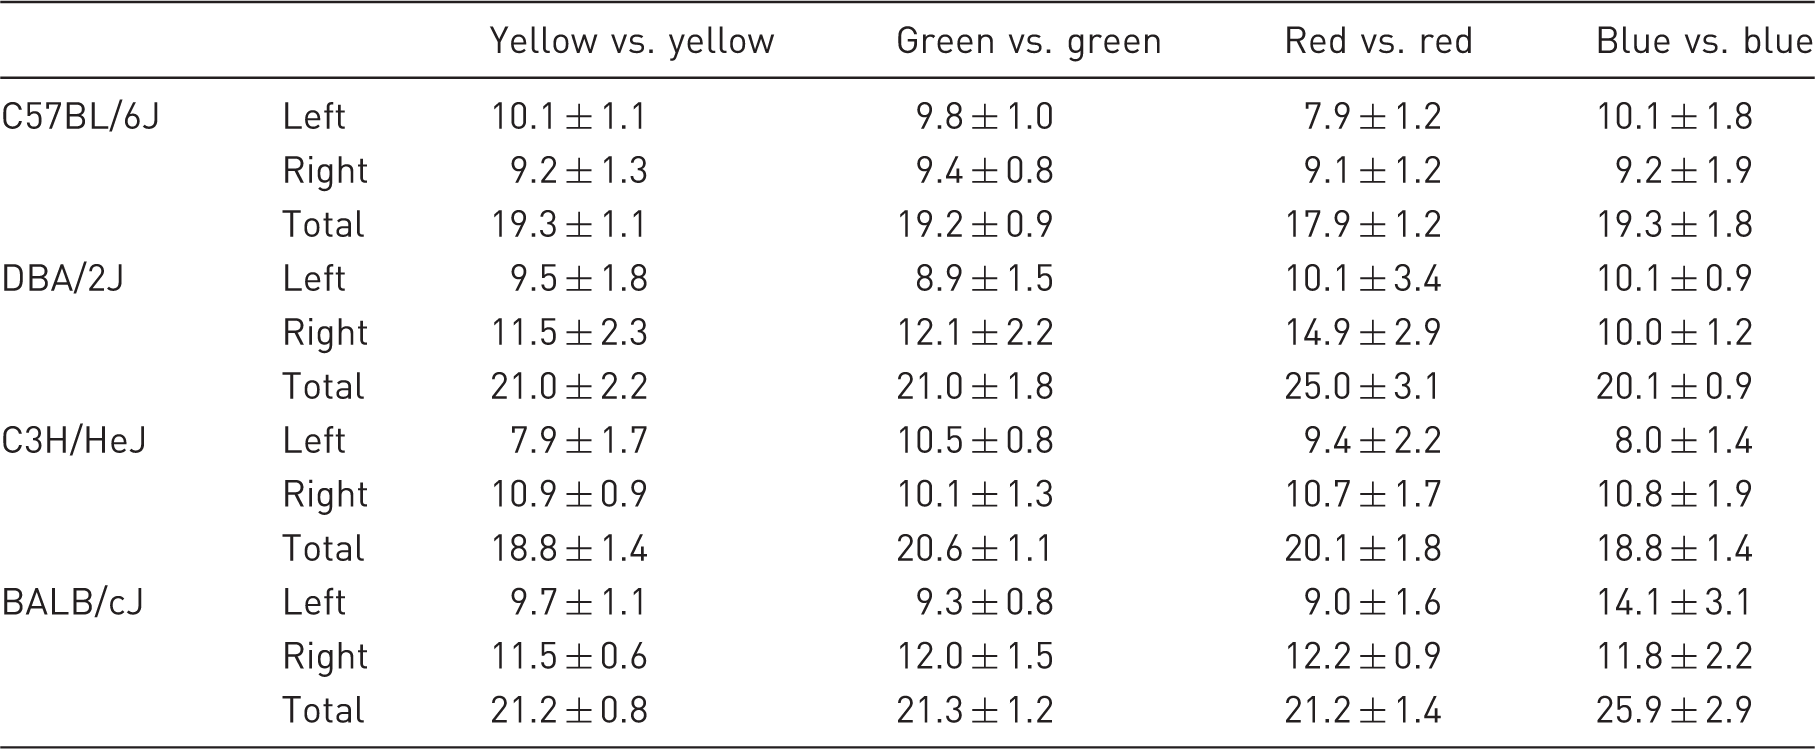
Food of the same color was provided in two feeding tubes located on the left and right corner of the PhenoMaster® cage. Food consumption was monitored for one week (g/week) after equilibration on standard diet for one day. Data presented as means ± SD. Unpaired T test revealed no significant differences depending on position of food rack.
Discussion
In many animal studies food choice is correlated to chemosensory or cognitive aspects, but not toward the appearance of food. However, there are mouse models that are inevitably based on high food intake in a short time, such as models of diet-induced obesity. 20 Colored foods could probably enhance or inhibit food intake, potentially influencing the development of the model and thus affect the results obtained.
In this study, we documented that mice of different strains, providing variations in their genetic ability of eyesight, indeed showed preferences for distinct food colors. In general, mice are accepted as animal models for investigating the visual sense, as they show major congruity, sharing similar cell types and structural features.10,21 For our study we selected the C57BL/6J mouse, as being representative for a normal-sighted mouse (close to its wild living relatives), the DBA/2J mouse, as a representative for being born normal sighted, but developing impaired visual capacity with age, the C3H/HeJ mouse, which becomes visually impaired at an early age, and the BALB/cJ mouse, a classic albinotic mouse strain. 10
Visual orienting tests of all tested mice verified the assumptions concerning the visual capacities and accuracy of being designated into the testing groups. At the age of 13 weeks DBA/2J mice performed well in visual placing response, so it can be assumed that they were normal sighted at the beginning of the two-choice alternative tests. Mice of this strain develop retinal degeneration at the cellular level at the age of 4 months, becoming worse with time and leading to complete blindness approximately at the age of 9 to 12 months. 22 It has to be mentioned that the visual placing response is classifiable as an orientation test and allows the analysis of whether an animal is able to recognize more- or less-tangible objects. 23 Indeed, no statement can be made about possible deviations in terms of the animals’ color perception.
Our results show that the normal-sighted C57BL/6J mice preferred chow tinted yellow or as an alternative, green. These colors are obviously close to the natural situation. In a study conducted in wild house mice the favored food was found to be whole canary seeds, which are a yellowish-greenish color. Also, pinhead oatmeal and wheat were well accepted. 24 Comparably, DBA/2J mice tested at an age of visual competence, preferred food that was green, followed by yellow compared to red and blue food pellets. In both sighted mice strains blue was the color preferred less. This might be explained by the rare occurrence of blue food in nature, except for some berries, potatoes, eggplant or cabbage.
As we expected, the visual sense at the testing time point of C3H/HeJ mice and BALB/cJ was strongly impaired. For that reason, it is valid that no pattern pointing at attraction or dislike could be detected. Both mice strains took in physiological amounts of food without any preference for yellow, green, red, or blue. This fact is important as it documents that the chosen food colors or the process of manufacturing and storage had no effect on taste perception, or an olfactory impact, respectively.
Furthermore, when not given the choice, mice of all mouse strains (independent of visual capacity) took in a physiological amount of colored food, comparable to the food intake on SC at the beginning of the study. As a retrospective consideration, these findings are of great relevance as the outcome of many studies using differently dyed diets must not be doubted. Our research supports the assumption that the net quantity of food intake seems to be primarily dependent on metabolic influencing factors (e.g. caloric intake).25,26
In recent years the implementation of the replacement, reduction and refinement (the 3Rs) concept has been enforced intensively. Within that, numerous investigations concerning influences of enrichment materials, cage conditions, embedding material and others have been performed. So we know, for example, that the selection of a home cage is not only due to the cage color, but also to the structure and color of the supplied embedding material. If mice are given a choice, they would prefer embedding material similar to their own fur coat color. 27 Noteworthy, this behavior might implicate a kind of self-reflection in addition to color preferences and leads to the assumption that colors play a key role in the well-being of mice. Focusing on refinement aspects, using dyed diets in a preferred color might be of importance under pathological conditions. Further studies have to be conducted in order to analyze whether food color preferences in combination with enhanced palatability can help to prevent excessive weight loss and thereby support animal well-being.
With respect to conducting experiments associated with the administration of differently dyed diets, it is important to mention that, given a choice, normal-sighted mice prefer one color over another, but if there is no such option, the intake of preferred colored food to disliked colored food is comparable. In sum, whenever the purpose of a study is to directly compare the intake of different foods, diets should not be colored with various dyes because (at least normal-sighted) mice obviously choose when given a choice.
In conclusion, the results of this study point out that standardization is still of high importance concerning conducting experimental studies in mice and helps us to fill in another stone into the big mosaic “mouse.” In order to fulfil the requirements of the 3Rs, all researchers in this field are summoned to contribute, in order to enhance the comfort for the used animals and within that to satisfy not only the needs but also the demands of experimental animals. To fundamentally contribute to refinement of laboratory animal experimentation, the characterization of laboratory rodents with specific relations to experimental applications should be pursued and in light of “good scientific practice,” future protocols (such as Animal Research: Reporting of In Vivo Experiments checklists) should integrate methodological aspects like the food color provided.
Footnotes
Acknowledgment
The authors are thankful to Prof A. Schürmann, Department of Experimental Diabetology, German Institute of Human Nutrition, for providing the necessary support and measuring devices for this project.
Declaration of Conflicting Interest
The author(s) declared no potential conflicts of interest with respect to the research, authorship, and/or publication of this article.
Funding
The author(s) received no financial support for the research, authorship, and/or publication of this article.