
Abstract
Fasting of mice is a common procedure, which can affect the outcome of the study as well as animal welfare. In this study, we assess the effects of fasting, fasting duration and fasting initiation time in relation to light schedule and present suggestions for optimization of fasting. Male C57BL/6NCrl mice were fasted for 0, 3, 6, 12, 18 and 24 hours initiated either in the light period (photophase) or the dark period (scotophase). Body weight, gastric content, body temperature, corticosterone and 19 routine clinical chemistry parameters were evaluated.
Fasting caused significant changes in most of the measured parameters. Increasing duration of fasting resulted in increasing physiological changes. Fasting initiated in the scotophase caused more significant changes than fasting initiated in the photophase. To cause the least physiological changes in mice and increase animal welfare, mice should preferably be fasted in the photophase and for the shortest possible period allowed by the experimental purpose of fasting.
Keywords
Introduction
Fasting is a topic of on-going interest as research in metabolic diseases such as obesity and diabetes is increasing. 1 Measuring fasting blood glucose is a method used in, for example, diabetes research using mouse models 2 as well as when diagnosing the disease in patients. In humans an overnight fast is typically required, and this has also been used for mice. 3 Moreover, knowing when the stomach is empty of any food content is interesting, as the presence of food in the gastrointestinal tract potentially alters the absorption of orally dosed drugs, for example by direct binding or poor gastrointestinal mixing. 4 Hence, overnight fasting is often used prior to measuring blood glucose to reduce variability in basal blood glucose or to ensure uniform drug absorption as an empty stomach will prevent mixing a test drug with food. 5
Whether the purpose is to lower and stabilize the blood glucose, empty the gastrointestinal system or to investigate the metabolism of fasting, fasting animals experience a number of physiological changes as they adapt to the prolonged postabsorptive phase, 6 and the animals’ welfare should continuously be considered. To comply with the 3R principles (replacement, reduction and refinement), an optimized fasting procedure resulting in the desired physiological changes with the least possible reduction in animal welfare should be used. Fasting of mice may also be employed to reduce biological variability, but it is just as important to be aware of biological variability caused by fasting. Hence extensive knowledge of the effects of fasting is needed to minimize variability in study results and thereby gain stronger scientific evidence without jeopardizing animal welfare.
Reports on the effects of fasting of mice conclude that several changes such as body weight loss, 7 metabolic changes, 8 the induction of torpor 9 and cardiovascular changes 10 occur during fasting. However, often the duration of fasting in these studies has been longer than 16–18 hours. These results are therefore of little value to studies for which mice are fasted for a shorter period. Clinical chemistry parameters are generally used for screening biomarkers, 11 and hence it is important to recognize changes in clinical chemistry parameters caused by fasting.
Time for blood sampling and euthanasia after the preset period of fasting.
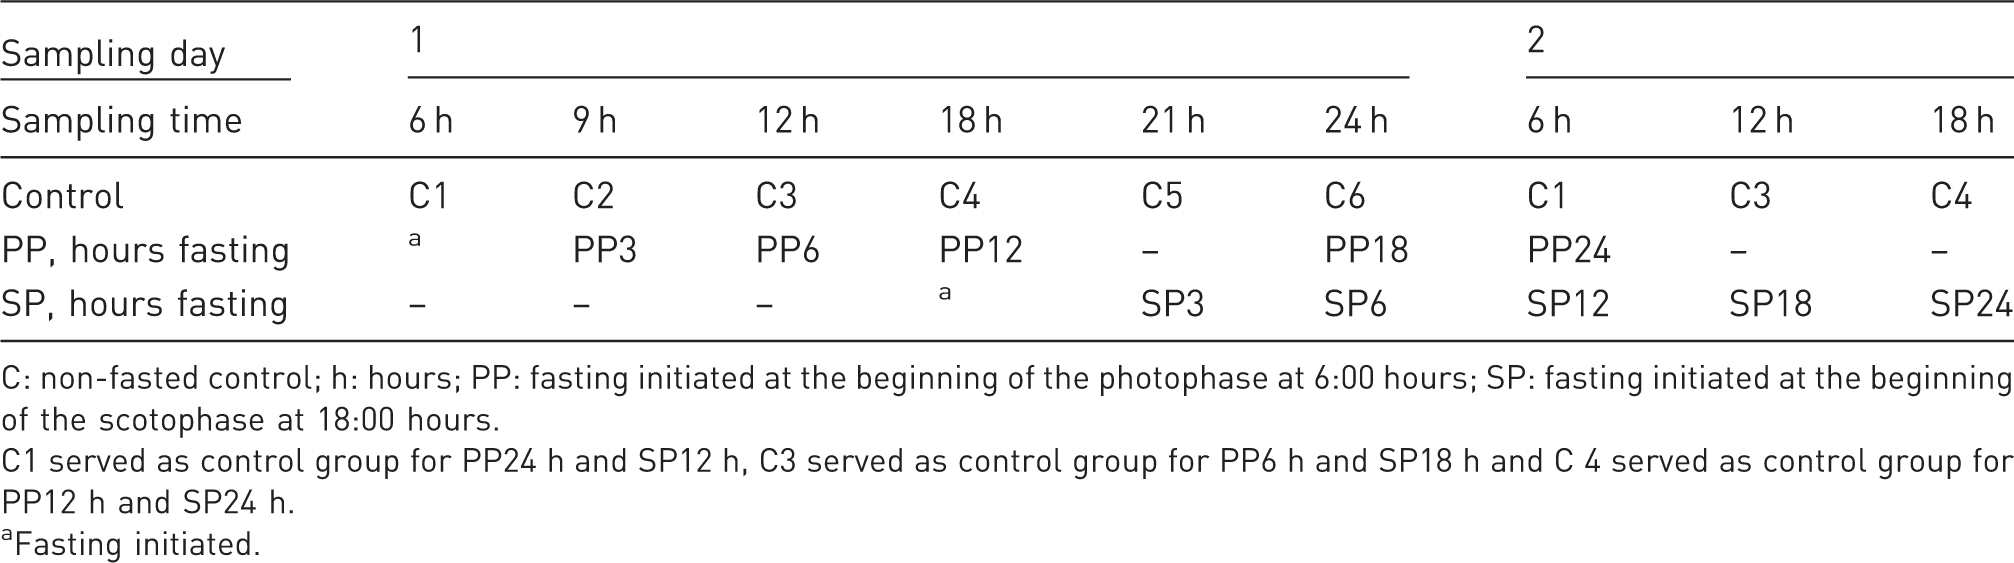
C: non-fasted control; h: hours; PP: fasting initiated at the beginning of the photophase at 6:00 hours; SP: fasting initiated at the beginning of the scotophase at 18:00 hours.
C1 served as control group for PP24 h and SP12 h, C3 served as control group for PP6 h and SP18 h and C 4 served as control group for PP12 h and SP24 h.
Fasting initiated.
Animals
A total of 128 male, C57BL/6NCrl mice (Charles River, Germany) aged eight weeks on arrival were used in the study. All mice were raised in the barrier production colonies at Charles River, Germany, and health monitored according to the Charles River standard, Routine Health Monitoring of Mice and Rats, European Barrier Production Colonies. All mice were examined on arrival and found fit and healthy. The mice were socially housed with eight animals per cage. The mice were housed under standardised housing conditions in a standard Type IV Makrolon® cage (595 × 380 × 200 mm high; Scanbur A/S, Karlslunde, Denmark) with aspen bedding (Tapvei, Kortteinen, Finland), paper-based nesting material (Enviro-Dri®, Lillico, Surrey, UK), a 20 × 14 cm dark-transparent shelter (Repsol, Brønderslev, Denmark) and an aspen brick, size M (100 × 20 × 20 mm high) (Tapvei, Kortteinen, Finland).
Twice a week, all mice and their nesting material, shelter and biting stick were transferred to clean cages. The mice were housed in a climate-controlled room at 20℃ (±2℃), 35% to 55% relative humidity, 8–15 air changes per hour and 12 hours of light from 06:00 to 18:00 (photophase).
The mice were fed ad libitum with a commercial rodent standard diet (Altromin, Type 1320, Maintenance Diet Rats/Mice, Brogaarden, Gentofte, Denmark) and had ad libitum access to tap water from an automated watering system (Edstrom Industries, Hereford, UK).
Ethical approval
The Danish Animal Experimentation Board under the Ministry of Environment and Food of Denmark approved this study. The experimental procedures employed conform with the principles specified in the Directive 2010/63/EU of the European Parliament and of the council of 22 September 2010 on The Protection of Animals used for Scientific Purposes.
Materials and methods
On the day of arrival, the mice were randomly divided into 16 groups of eight mice, using a calculator with a random number generator. The cages were randomly placed in the cage racks. The next day the mice were earmarked with a pair of ear nippers. The mice were acclimatized for 10 days. In the group to be fasted for 18 hours from the beginning of the photophase, three mice were euthanized on the day prior to the experiment because of injuries caused by aggression in the group. None of the other groups were found to be affected by inter-male aggression.
Fasting experiment
The mice were 10 weeks of age at test start. Fasting was initiated either in the PP (starting at 6:00 h) or in the scotophase (SP; starting at 18:00 h) (Table 1) simply by removing the food pellets from the food hopper of the home cage. Four groups of eight mice and one group of five mice were fasted starting in the PP at 6 h and fasted for 3, 6, 12, 18 and 24 hours, respectively (PP3 h, PP6 h, PP12 h, PP18 h and PP24 h). Another five groups of eight mice were fasted in the SP starting at 18 h for 3, 6, 12, 18 and 24 hours (SP3 h, SP6 h, SP12 h, SP18 h and SP24 h). The samples were collected within an hour before or after the set time for fasting duration. The six control groups (C1–C6) were not fasted. Samples from control groups were collected at 6, 9, 12, 18 21 and 24 h. Four control groups (C6, C1, C3 and C4) thus served as controls for two test groups (Table 1). After the pre-set fasting period, the mice were anaesthetised with isoflurane using an induction chamber followed by transfer to an anaesthetic mask for mice. Body temperature was measured using a probe rectal thermometer. The mice were weighed and blood samples from the periorbital venous plexus collected under isoflurane anaesthesia. Immediately after blood sampling, the anesthetised mice were euthanised using cervical dislocation.
Clinical chemistry
Full blood, 520 µl, was collected in lithium heparin-prepared Eppendorf tubes. Within one hour after blood sampling, the blood was centrifuged at 2000 g for 10 minutes at approximately 4℃. Subsequently the plasma was pipetted and stored at –20℃. Plasma concentrations of aspartate aminotransferase (AST), alanine transaminase (ALT), lactate dehydrogenase (LDH), alkaline phosphatase (ALP), carbamide (UREA), creatinine (CREA), glucose (GLUC), calcium (CA), cholesterol (CHOL), triglyceride (TRIG), total protein (TP), creatine kinase (CK), inorganic phosphate (PHOS), albumin (ALB), globulin (GLOB), potassium (K), sodium (NA) and chloride (CL) were analysed using an ABX Pentra 400 (Horiba, Northampton, UK).
CORT
Full blood, 200 µl, was sampled in ethylenediaminetetraacetic acid-prepared Eppendorf tubes and turned 7–10 times. The samples were stored at 8℃ for up to 20 minutes. The samples were then centrifuged at 5000 g for 5–10 minutes and the plasma was pipetted and stored at (–20℃) for one or two days before being analysed using ELISA for CORT in plasma.
Gastric content
After euthanasia, the stomach was removed via a ventral laparotomy by ligating and cutting the gastrointestinal tract carefully at the cardia and pylorus and removing ligaments and pancreas by blunt dissection. The stomach was washed with tap water, gently dried on paper and weighed on an electronic balance (AUW220D from Shimadzu Corporation, Kyoto, Japan). Subsequently the stomach was cut open at the great curvature and rinsed with tap water. Once again, the stomach was gently dried and weighed. 13 The gastric content was calculated as the difference between the two measured weights.
Statistical analyses
Statistical analyses were performed in SAS JMP, 9.0.0 Statistics software using a three-way analysis of variance (ANOVA) model. The factors in the three-way ANOVA were treatment (C, SP, PP), duration of fasting and sample time. An alpha level of 0.05 was defined for all analyses. Subsequent pairwise tests were performed by t test. When statistical comparisons between fasted groups were completed, the difference from the control was used instead of the total value, to avoid possible differences caused by the circadian rhythm. Some parameters ended up having a lower sample size than others because of the limited amount of blood collected. The sample sizes were based on known standard variations and standard sample sizes of the measures parameters. Owing to the available funding, only male mice were used for this study.
Results
(a) Mean ± SD of fasting and control groups. Table cells with significant findings are shaded grey to enhance readability.
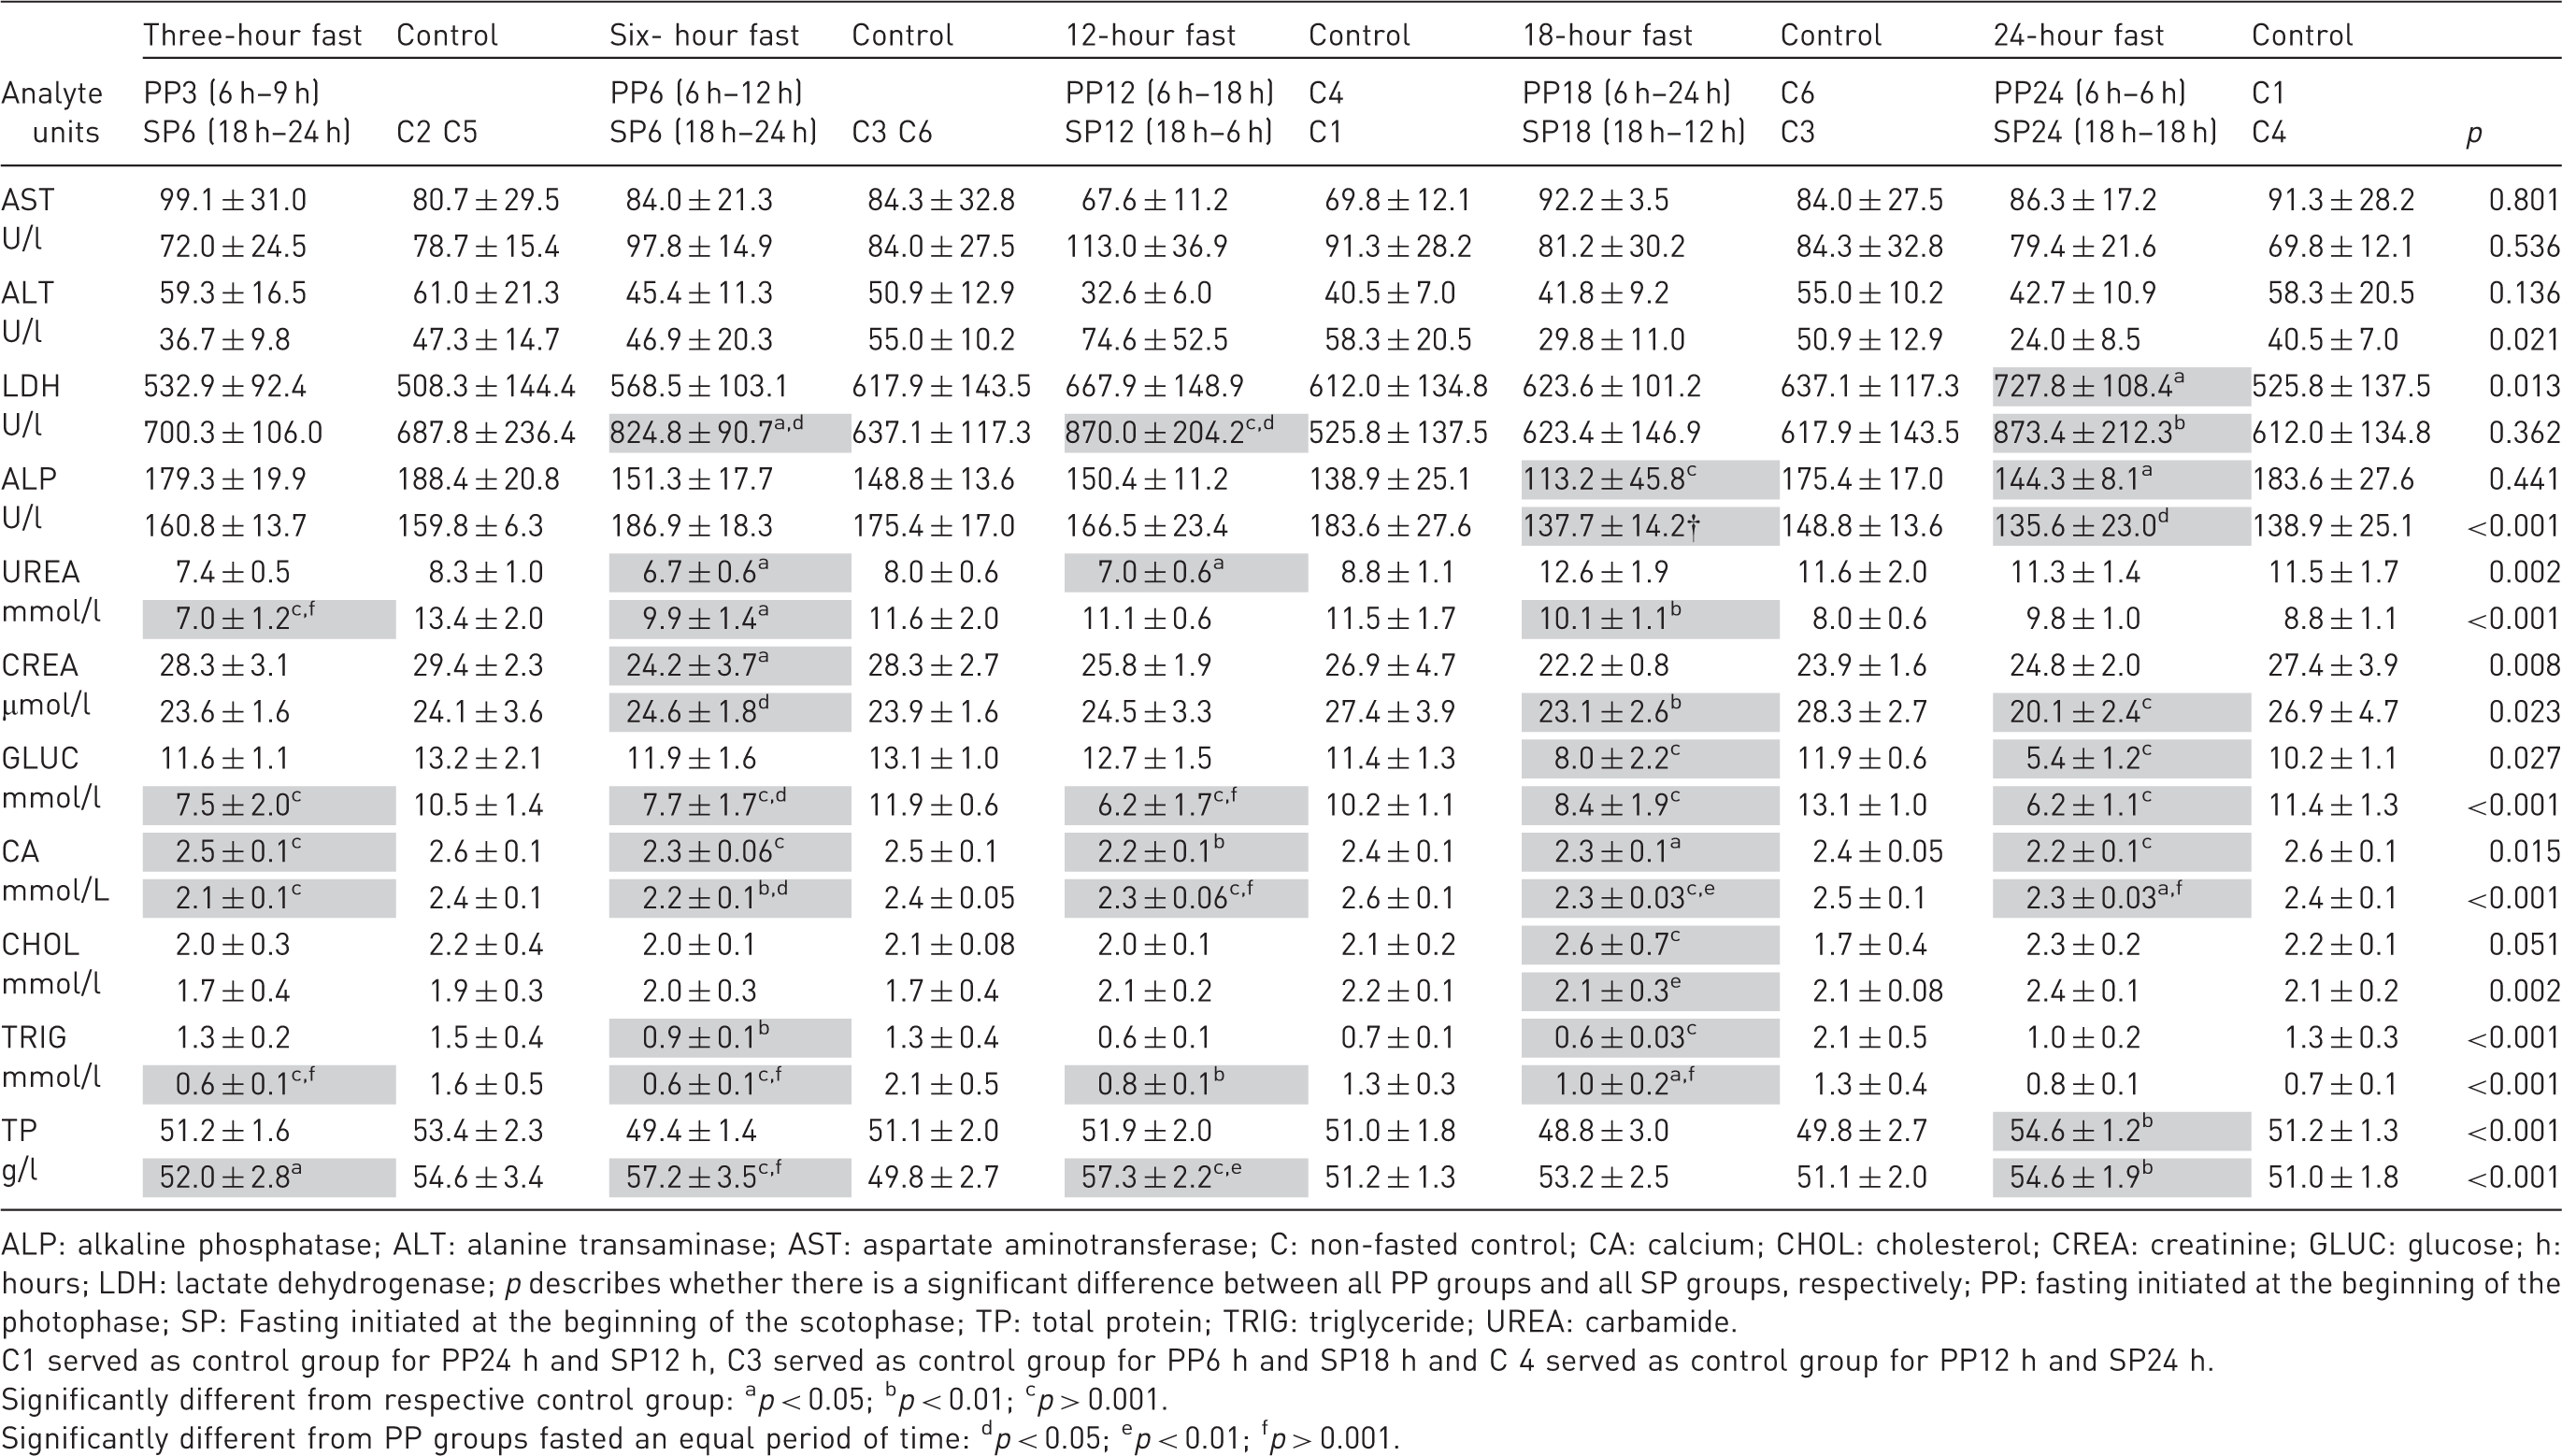
ALP: alkaline phosphatase; ALT: alanine transaminase; AST: aspartate aminotransferase; C: non-fasted control; CA: calcium; CHOL: cholesterol; CREA: creatinine; GLUC: glucose; h: hours; LDH: lactate dehydrogenase; p describes whether there is a significant difference between all PP groups and all SP groups, respectively; PP: fasting initiated at the beginning of the photophase; SP: Fasting initiated at the beginning of the scotophase; TP: total protein; TRIG: triglyceride; UREA: carbamide.
C1 served as control group for PP24 h and SP12 h, C3 served as control group for PP6 h and SP18 h and C 4 served as control group for PP12 h and SP24 h.
Significantly different from respective control group: ap < 0.05; bp < 0.01; cp > 0.001.
Significantly different from PP groups fasted an equal period of time: dp < 0.05; ep < 0.01; fp > 0.001.
(b) Mean ± SD of fasting and control groups. Table cells with significant findings are shaded grey to enhance readability.
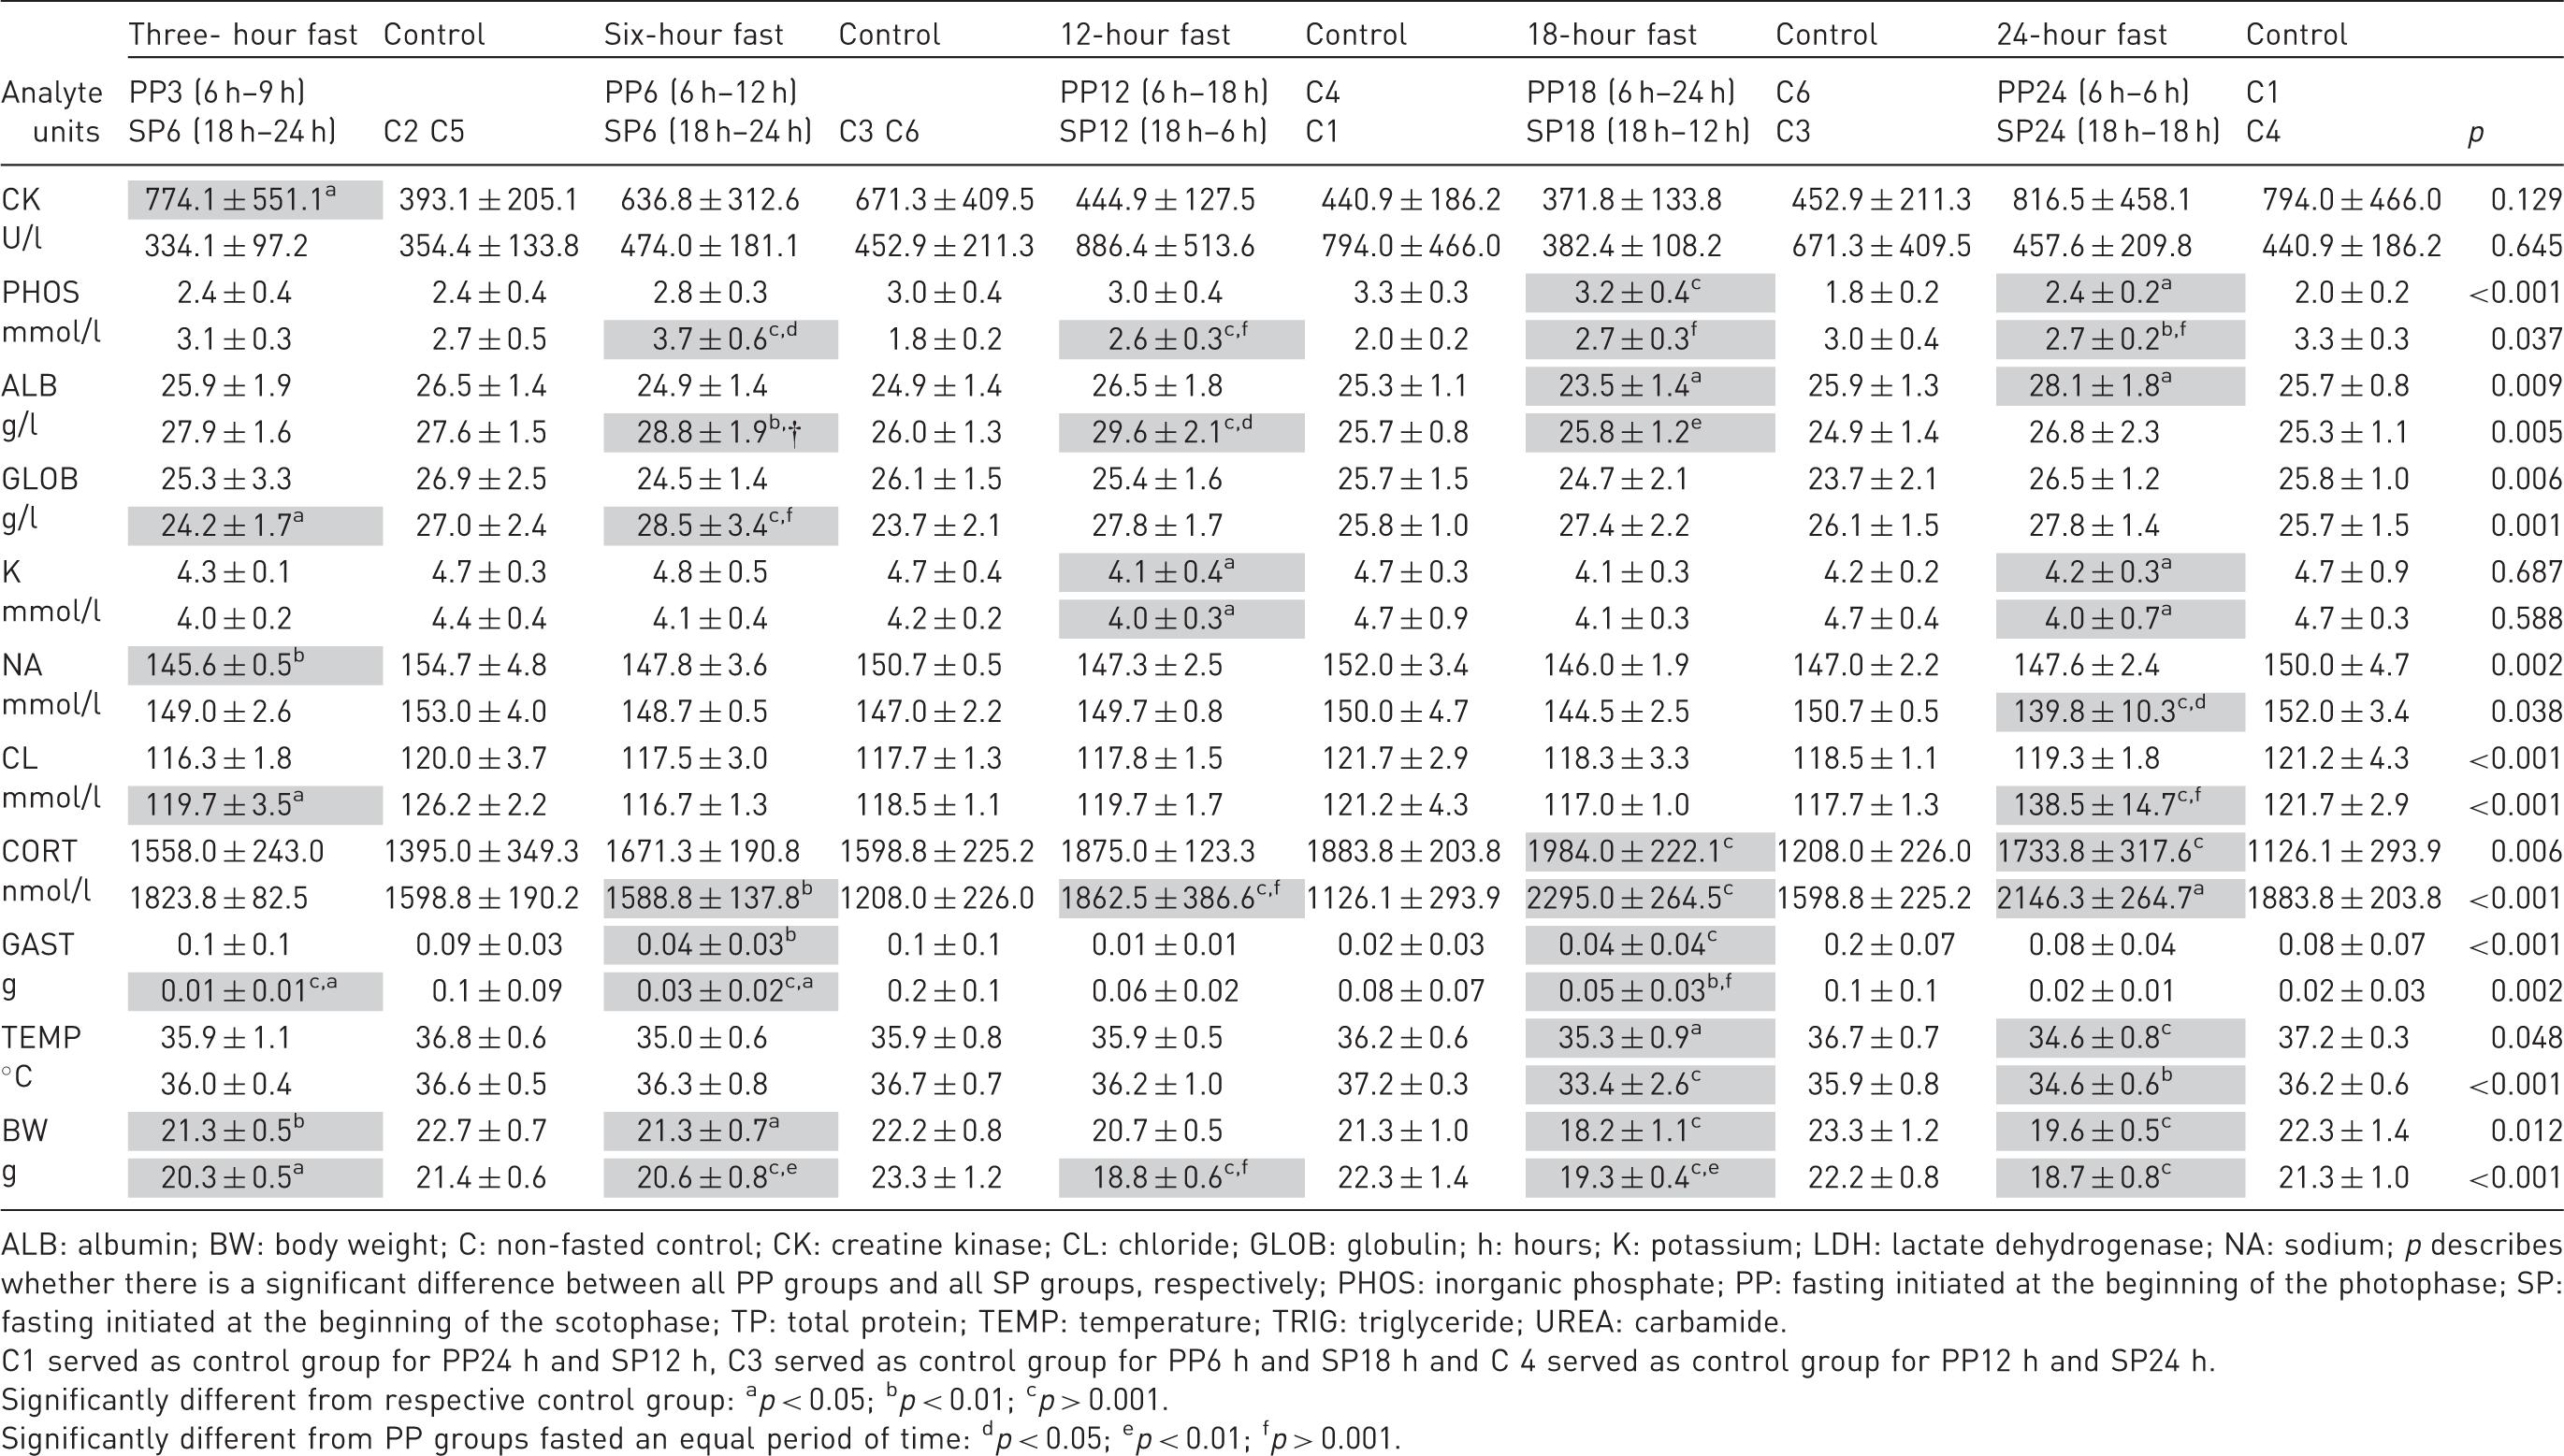
ALB: albumin; BW: body weight; C: non-fasted control; CK: creatine kinase; CL: chloride; GLOB: globulin; h: hours; K: potassium; LDH: lactate dehydrogenase; NA: sodium; p describes whether there is a significant difference between all PP groups and all SP groups, respectively; PHOS: inorganic phosphate; PP: fasting initiated at the beginning of the photophase; SP: fasting initiated at the beginning of the scotophase; TP: total protein; TEMP: temperature; TRIG: triglyceride; UREA: carbamide.
C1 served as control group for PP24 h and SP12 h, C3 served as control group for PP6 h and SP18 h and C 4 served as control group for PP12 h and SP24 h.
Significantly different from respective control group: ap < 0.05; bp < 0.01; cp > 0.001.
Significantly different from PP groups fasted an equal period of time: dp < 0.05; ep < 0.01; fp > 0.001.
Overall, a significant difference between the changes in the SP groups compared to the changes in the PP groups was seen in 31.8% of the comparisons (Table 2(a) and (b); symbol d). In 71% of the cases there was a significant difference between the changes in the SP groups and the changes in the PP groups, and SP groups showed the largest deviation from the control groups.
Circadian rhythms of collected data from control groups.
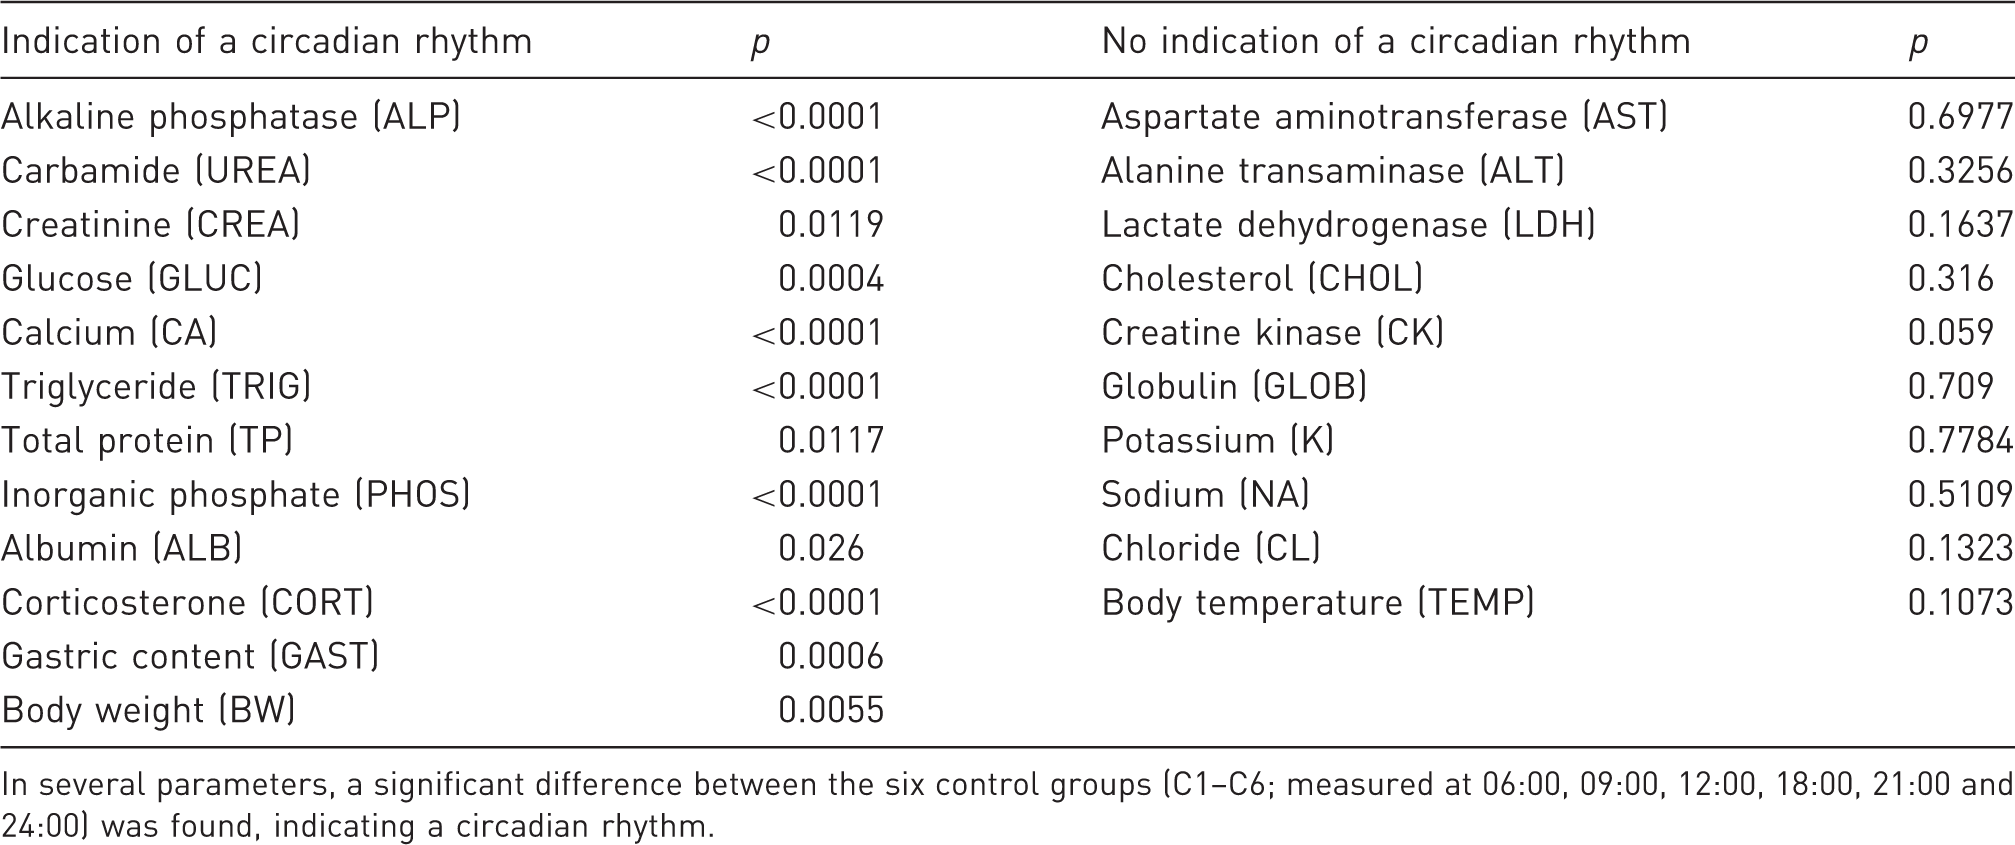
In several parameters, a significant difference between the six control groups (C1–C6; measured at 06:00, 09:00, 12:00, 18:00, 21:00 and 24:00) was found, indicating a circadian rhythm.
Discussion
Several parameters showed a significant circadian rhythm (Table 3), emphasizing the importance of comparing results achieved at approximately the same time point of the day. As hypothesized, significant changes were seen by fasting; the numbers increasing with the duration of the fasting. Furthermore, more significant changes were seen when fasting was initiated in the SP than when fasting was initiated in the PP.
The explanation as to why fasting initiated at the beginning of the SP produced more physiological changes might be that most of the mice’s activities, including food intake, take place in the SP.12,14–19 The metabolism also follows a circadian rhythm characterized by increased activity related to food intake in the SP. 20 Hence, the contrast with the ad libitum-fed state is more pronounced when fasting in the SP than in the PP, as mice primarily eat in the SP. As the food intake of the mice is naturally reduced in the photophase, starting the fasting immediately after the photophase may result in a fasting period that are practically longer than purposed.
Animal welfare was assessed by measuring CORT, body weight and body temperature. CORT levels in this study following a circadian rhythm like the one previously described by several investigators.21–27 The blood CORT level increases gradually until the transition from the PP to the SP, during which the activity level of the mice increases.
CORT levels in fasted mice showed significant differences from controls after a shorter duration of fasting in SP groups than in PP, groups and the SP groups reached a higher level. As CORT is considered a stress parameter, 28 these findings suggest that mice are more stressed by fasting in the SP than in the PP. The CORT levels seen in this study are generally higher than the levels reported in previous studies,29–31 which might be due to different study designs and laboratories. An additional cause could be a potential stress-inducing effect of isoflurane anaesthesia32,33; however, this effect would have affected all the groups equally.
The mice from the SP groups showed a tendency toward a lower body weight than the mice from the PP groups. By all time points, significant differences were found between the body weight of control and test groups, but at 3 and 24 hours of fasting the degree of lowered body weight was similar between the SP and the PP groups (Table 2(b)).
Fasting for 12 hours (either the full PP or the full SP) or for 24 hours did not provoke any significant changes in gastric content. This is most likely because of the circadian rhythm of gastric content, wherein the gastric content is low at the two light/dark transitions, thus at these time points (coinciding with 12 and 24 hours of fasting in this study) the gastric content of control groups was low, and not significantly different from the gastric content of fasted groups. Comparable results were reported by Llanos and Nash 34 . The gastric content increased in the period of fasting concurrent to the period during which the gastric content of non-fasted mice increased (probably periods when control animals were eating more). The most straightforward explanation is that the mice in periods with high feeding motivation and no food available in the food hopper had eaten remnants of food in their bedding or even non-food items such as bedding or pieces of the cardboard shelter. Moreover, coprophagia could have added to the gastric content. Under the conditions given in this study, the gastric content of fasted mice was not reduced compared to the gastric content of non-fasted mice at the corresponding point in time. If the sole purpose of fasting is to obtain a nearly empty stomach, it is recommended to simply use the mice at the two time points when the light is changed and thereby avoid fasting and the related physiological effects and possible animal welfare implications. Not surprisingly, a significant reduction in body weight in the fasted groups compared to controls was found both in the PP and SP groups and at all time points. The only exception was 12 hours’ fasting initiated during the PP, during which the mice had been food deprived for the full length of the PP. The matching control mice were thus euthanised at the end of the 12-h photo phase, during which the food intake may very well have been the lowest.
No circadian rhythm in body temperature was detected in this study, though it has previously been reported.19,35 The reason might be variable changes in body temperature caused by all the events associated with the study. Disturbing all the mice when one cage was removed for collecting samples may have caused activity in periods during which mice would normally rest and decrease their body temperature. Furthermore, temperature measurements were collected in intervals of up to six hours, which might have masked a circadian rhythm.
The lowest body temperature, measured in a mouse from the SP group fasted for 18 hours, was 28.7℃. This was the first mouse sampled from the group, and it was the only incidence of a body temperature below 31℃, which has been defined as torpor.36,37 Torpor is a state of suppressed metabolic rate and decreased body temperature that mice can enter when ambient temperatures are low or in times of food shortage. Mice arise spontaneously from torpor, but not from hypothermia. 9 It might be suggested that suppression of the metabolic rate might alter the results of an experiment. The SP18 group (fasted for 18 hours) had the lowest mean body temperature, which is in accordance with investigators reporting that mice will usually enter torpor in the photophase after approximately eight hours of fasting or at the end of the scotophase. 38 Torpor is preferably measured by telemetry, since disturbances such as noise or movement can make mice exit torpor.37–39 Therefore, lowered, but not torpid, body temperatures can be the result of a mouse coming out of torpor, having had an even lower body temperature. The body temperature of a mouse coming out of torpor increases by approximately 0.26℃ per minute, 40 and usually not all the mice in a group will be torpid at the same time. 37 Some of the mice in this study might have been torpid, but not reported, as the method used could not detect it. However, the mean body temperature of the mice reached as low as 33.4℃ (SP18) and the variation among animals was rather high indicating that some mice may in fact have been torpid.
One of the main reasons for fasting laboratory mice is for measuring blood GLUC in, for example, the oral GLUC tolerance test, and for animal welfare reasons it would be optimal to know the shortest feasible fasting period. In this study, the blood GLUC level after three hours of fasting in SP groups was like that in the PP groups after 18–24 hours of fasting. The duration of the fasting did not affect the results in the SP groups. Hence, if a specific low blood GLUC level is desired, it can be obtained from fasting for a shorter duration in the SP than in the PP. It seems that the SP groups experienced a decrease in blood GLUC during the first three hours of fasting similar to the decrease the PP groups experienced during 18 hours of fasting. By six and 12 hours of fasting, the differences in blood GLUC caused by fasting were significantly larger in the SP groups than in the PP groups. After 18 and 24 hours of fasting these differences had disappeared, assumingly because the duration of the fast becomes the most dominant factor. It has previously been suggested that mice are able to take up glucose faster in the SP than in the PP. 41 Moreover, anaesthesia may stress the mice, which can add variability to blood GLUC level. 42 On the other hand, the non-anaesthetized mouse may undergo stress and an altered GLUC concentration. 43 In this study, plasma GLUC concentrations similar to overnight-fasted mice can be achieved by fasting mice for three hours from the beginning of the SP. To avoid other effects of fasting mice overnight, such as an increased plasma CORT concentration and a 13% body weight loss, it is recommended to apply the procedure with a fasting period of three hours, initiated in the beginning of the SP. If a fasting period of 18–24 hours is applied for achieving a low GLUC concentration, it is recommended to initiate the fasting in the PP, considering behaviour and metabolism of mice and at the same time reducing other effects of fasting. Triglycerides were significantly decreased in fasted groups compared with controls, as previously shown by Hashimoto et al. 44 The triglyceride concentration changes during fasting, as the metabolism becomes catabolic and depends more on lipids from mobilization of adipose tissue and less on GLUC.
Conclusion
It has been recommended to document the duration of fasting to facilitate reproducibility regarding blood analysis. 29 This study supports this recommendation and demonstrates the importance of documenting the circadian rhythm of the laboratory as well as the time point of imposing the fasting. As this study was carried out only in male mice, further studies should be performed to confirm these results in female mice.
Weight loss and a significant increase in the plasma concentration of the stress parameter CORT can be interpreted as an indication of a reduction in animal welfare. This, in addition to possible effects of unwanted physiological changes on the outcome of the study, provides a motivation for investigators to consider all aspects of the fasting procedure. Fasting of 10-week-old, male C57BL/6Ncrl mice, group-housed with bedding, causes significant changes in body temperature, body weight, plasma CORT concentrations, clinical chemistry and gastric content. Increasing the duration of the fast causes an increased occurrence of significant changes. Mice fasted from the beginning of the SP experience more significant changes, and the changes generally occur after a shorter duration of fast compared with mice fasted from the beginning of the PP.
We consider fasting exceeding five hours as having a negative effect on animal welfare, as the longest voluntary inter-meal interval reported in mice is five hours. 12 However, these findings were revealed in male mice in the PP and as mice are nocturnal animals, eating will under normal circumstances be reduced during daytime/PP. Hence, it is most likely mice in the SP (dark phase) will have much shorter inter-meal intervals and hence be more motivated to eat sooner. It is also important to emphasize that a fasting period starting at the beginning of the SP (i.e. when the active period of the mice starts) may result in a possibly extended fasting period, as the mice may not have eaten much during the PP. To disturb the eating patterns of the mice the least, and thereby ensure the highest possible animal welfare, mice should preferably be fasted in the PP and for as short a duration as possible allowed by the given experiment. Gastric content levels of non-fasted mice similar to those of mice fasted for 24 hours were seen at the time points during which the light condition changed (i.e. either at the beginning of the PP or at the beginning of the SP). Hence, the gastric content levels of non-fasted mice at the time points where the light conditions were changing were similar to those of mice fasted for 24 hours. For future experiments, the duration of a fast can preferably be regulated according to whether the fast is initiated in the PP or in the SP. Plasma GLUC concentrations were significantly decreased after three hours of fasting initiated in the SP, reaching a level similar to 18 hours of fasting initiated in the PP. Therefore, it is our overall recommendation to plan a short fast initiated in the beginning of SP, or alternatively carry out longer periods of fasting initiated in the beginning of the PP. Another alternative could be to change the light regimen in the facility by, for example, reversing the light and dark period with lights on at 22 h and lights off at 10 h. Hence, fasting could be initiated at 10 h and as this is the active period of the mice, the studies could be performed at 13 h, for example. It is possible that fasting initiated, for example, in the middle of the light period would prove even more beneficial; however, this remains to be studied.
Footnotes
Declaration of Conflicting Interests
The author(s) declared no potential conflicts of interest with respect to the research, authorship, and/or publication of this article.
Funding
The author(s) disclosed receipt of the following financial support for the research, authorship, and/or publication of this article: This work was supported by the Centre for Applied Laboratory Animal Research.