
Abstract
Until validated correlates of protection are identified, animal models remain the only way to test the efficacy of the new vaccines and drugs urgently needed to fight the global epidemic caused by infection with Mycobacterium tuberculosis. Non-human primates (NHP) offer the most relevant models of human tuberculosis (TB) and are central to the development process for new interventions. Efficacy evaluations are dependent on the capability of the test model to discriminate improved outcomes between treated groups after experimental exposure to M. tuberculosis and therefore the ability to measure TB-induced disease burden is central to the process. We have developed a score system that allows us to quantify the disease burden induced in macaques by infection with M. tuberculosis, based on the extent and features of disease visible on computed tomography (CT) images. The CT determined disease burden was then verified against that obtained using an established pathology-based approach. Trials of the system as a tool to measure disease burden have shown the approach capable of revealing differences between treatment groups in order to: (a) characterise outcome of infection and enable model refinement; (b) demonstrate the efficacy of drug treatment regimens by showing differences in outcome between test groups. Initial trials suggest that the imaging-based score system provides a valuable additional tool for the measurement of TB-induced disease burden that offers the opportunity to apply both refinement and reduction within studies.
Introduction
Mycobacterium tuberculosis, the causative agent of tuberculosis (TB), is an intracellular pathogen that infects 10 million people worldwide and kills approximately 1.4 million people every year. 1 The resultant global health crisis has been intensified by emergence of drug-resistant M. tuberculosis strains, co-infection with HIV and the poor efficacy of the current vaccine, BCG. 2 New treatments including a new vaccine are urgently needed and until validated correlates of protection are identified, animal models remain fundamental to the development process, as they provide a platform in which the efficacy of new interventions can be tested against infectious challenge. Non-human primates (NHP) offer the most clinically relevant models of human TB because of the close similarities in their anatomy, physiology and immune systems,3–5 which lead to the development of comparable clinical signs, disease pathology and immune features following M. tuberculosis infection.
The ability to quantify the disease burden associated with M. tuberculosis infection in the animals under study is essential but these measures need to be accurate and sensitive enough to distinguish subtle differences between treatment groups. Quantitative gross pathology score systems based on the number and size of lesions in pulmonary and extra-pulmonary tissues are established and widely used in the macaque models of TB. Their application, which has demonstrated vaccine efficacy,6–11 has also assisted model characterisation by revealing the effect on disease burden caused by parameters such as disease status (active or latent) or study duration.11,12 Thus gross pathology scoring systems provide valuable measures of total disease burden. However, as determination of the scores depends on information gathered during necropsy, the approach cannot be used to determine the in life evolution of disease within individual animals.
Serial images can be collected from live animals using medical imaging systems such as chest radiographs (CXR), computed tomography (CT) and positron emission tomography – computed tomography (PET-CT), all of which have been established for use with the TB-macaque model and applied to visualise the development of pulmonary disease.13–15 The approaches described to quantify TB-induced pulmonary disease burden from the images collected vary according to the imaging modality. Qualitative score systems have been defined for the evaluation of CXRs based on the occurrence, position and extent of pulmonary infiltrate and have been proven capable of demonstrating improved outcomes associated with vaccination,6–11 although their sensitivity is limited because of the relativity low resolution achievable with X-ray.
The more detailed images obtained using CT and PET-CT have enabled the development of quantitative measures of pulmonary disease based on the number of individual nodules,10,16 changes in lung attenuation, 17 and increase in fluorodeoxyglucose (FDG) avidity. 16 CT images also enable the detection and characterisation of lymph nodes and extra-pulmonary tissues including the spleen, liver and kidneys for the presence of TB-induced disease. Therefore, CT images have the power to provide an overall representation of the extent of TB disease within the host in a similar manner to that provided by the established systems based on gross pathology changes.
The work described in this report aimed to assess the validity and utility of a new scoring system applied to information obtained from CT images of TB-infected macaques for the quantification of disease burden.
Materials and methods
Experimental animals
Rhesus macaques and cynomolgus macaques, aged 3–4 years, were obtained for these studies from the characterised breeding colonies managed by Public Health England that have been established in the UK for more than 30 years. Genetic analysis of these colonies has previously confirmed the rhesus macaques to be of the Indian genotype and cynomolgus macaques of Indonesian genotype. 18 Absence of previous exposure to mycobacterial antigens was confirmed: by a tuberculin skin test conducted whilst the animals were still in their original breeding colony; and just prior to study start, using an ex-vivo IFN-γ ELISPOT (MabTech, Nacka, Sweden) to measure responses to PPD (SSI, Copenhagen, Denmark), and pooled 15-mer peptides of ESAT6 and CFP10 (Peptide Protein Research Ltd, Fareham, UK).
Animals were housed in compatible social groups, in accordance with the Home Office (UK) Code of Practice for the Housing and Care of Animals Bred, Supplied or Used for Scientific Purposes, December 2014, and the National Committee for Refinement, Reduction and Replacement (NC3Rs), Guidelines on Primate Accommodation, Care and Use, August 2006. The housing environment was maintained within the temperature range 18–24℃ and a relative humidity range 40–70%. Cages were constructed with high level observation balconies and enrichment was afforded by the provision of toys, swings, feeding puzzles and DVDs for visual stimulation. Banks of cages were placed in directional airflow containment systems that allowed group housing and environmental control whilst providing a continuous, standardised inward flow of fully conditioned fresh air identical for all groups. In addition to standard old world primate pellets (Primate Mazuri Expanded MP(E), Dietex International, Witham, UK) further food was provided from a selection of vegetables and fruit that were varied on a day to day basis. Animals were sedated by intramuscular (IM) injection with ketamine hydrochloride (Ketaset, 100 mg/ml, Fort Dodge Animal Health Ltd, Southampton, UK; 10 mg/kg) for simple procedures such as blood sampling that required removal from their housing. None of the animals had been used previously for experimental procedures. In order to meet welfare requirements it is imperative that macaques are housed together in single gender, behaviourally harmonious groups and therefore treatment groups were randomly assigned to socially compatible cohorts using software generated random number allocations (Microsoft Excel) As gender has not been reported to influence the outcome of infection with M. tuberculosis in macaques, males were selected for these studies. All animal procedures and study designs were approved by the Public Health England Animal Welfare and Ethical Review Body, Porton Down, UK, and authorised under an appropriate UK Home Office project licence.
M. tuberculosis challenge strains
The M. tuberculosis strain with the characteristics most appropriate to meet the aims of each in vivo study was selected for challenge. The Erdman strain of M. tuberculosis is well characterised in the macaque model and widely used in studies to assess the efficacy of new interventions against TB. The M. tuberculosis Erdman K01 stock (BEI Resources, HPA-Sept 2011) was used for challenge, as previously described. 11 A stock suspension was initially prepared from a 5 ml starter culture originally generated from colonies grown on Middlebrook 7H11 selective agar supplemented with oleic acid, albumin, dextrose and catalase (OADC) (BioMerieux, UK). A liquid batch culture was then grown to logarithmic phase in 7H9 medium (Sigma-Aldrich, UK) supplemented with 0.05% (v/v) Tween 80 (Sigma-Aldrich, UK). Aliquots were stored at −80℃. Titre of the stock suspension was determined from thawed aliquots by enumeration of colony forming units (CFU) cultured onto Middlebrook 7H11 OADC selective agar.
The H37Rv strain has previously been reported to be less virulent in macaques than the Erdman strain, 19 and we have used this for specific studies where this feature is beneficial. The M. tuberculosis H37Rv (National Collection of Type Cultures (NCTC) 7416) challenge stock was generated from a chemostat grown to steady state under controlled conditions at 37℃ ± 0.1, pH 7.0 ± 0.1 and a dissolved oxygen tension of 10% ± 0.1, in a defined medium, the details of which have been previously described,20,21 High-concentration culture (approximately 2 × 10⁸ CFU ml−1 was aliquoted and frozen at −80℃. Titre of the stock suspension was determined from thawed aliquots by enumeration of CFU cultured onto Middlebrook 7H11 supplemented with OADC selective agar (BioMerieux, UK). Aliquots were stored at −80℃.
For challenge, sufficient vials of the selected strain were thawed and diluted appropriately, in sterile distilled water.
Aerosol exposure
Macaques were challenged by exposure to aerosols of M. tuberculosis, as previously described.11,21 Mono-dispersed bacteria in particles were generated using a 3-jet Collison nebuliser and, in conjunction with a modified Henderson apparatus, 22 delivered to the nares of each sedated primate via a modified veterinary anaesthetic mask. Challenge was performed on sedated animals placed within a ‘head-out’, plethysmography chamber (Buxco, Wilmington, NC, USA) to enable the aerosol to be delivered simultaneously with the measurement of respiration rate and respired volume. The calculations to derive the presented dose (PD) (the number of organisms that the animals inhale) and the retained dose (the number of organisms assumed to be retained in the lung) have been described previously.10,11,23
Bronchoscopic instillation
The bacterial inoculum for intrabronchial delivery was prepared by dilution of an aliquot from the same suspension used for aerosol challenge into sterile PBS that provided a suspension whereby 2 ml contained approximately 35 CFU, which was verified by retrospective analysis. 24
Clinical assessment
Animals were monitored daily for behavioural abnormalities including depression, withdrawal from the group, aggression, and changes in feeding patterns, respiration rate and the occurrence of cough. Animals were weighed, rectal temperature measured and examined for gross abnormalities on each occasion that required blood sample collection, aerosol challenge or euthanasia. Red blood cell (RBC) haemoglobin levels were measured using a HaemaCue haemoglobinometer (Haemacue Ltd, Dronfield, UK) to identify the presence of anaemia, and erythrocyte sedimentation rates (ESR) were measured using the Sediplast system (Guest Medical, Edenbridge, UK) to detect and monitor inflammation induced by infection with M. tuberculosis.
The time of necropsy, if prior to the end of the planned study period, was determined by experienced primatology staff and based on a combination of the following adverse indicators: depression or withdrawn behaviour, abnormal respiration (dyspnoea), loss of 20% of peak post-challenge weight, ESR levels elevated above normal (>20 mm), haemoglobin level below normal limits (<100 g/dl), increased temperature (>41℃) and abnormal thoracic radiograph. The range of adverse indicators used allowed application of humane intervention when individuals had progressed to moderate disease.
Drug treatment
Eight cynomolgus macaques infected with M. tuberculosis Erdman strain following exposure to aerosols estimated to contain presented doses of between 192 and 271 CFU were enrolled in a study to assess the efficacy of two anti-TB therapy regimens. Drug treatment was initiated eight weeks after infection with M. tuberculosis. The four macaques in group A received eight weeks of treatment with a combination of isoniazid (Sigma-Aldrich) dose 15 mg/kg, rifampicin (Sigma-Aldrich)15 mg/kg and pyrazinamide (Sigma-Aldrich) 200 mg/kg, followed by eight weeks of treatment with isoniazid (Sigma-Aldrich) dose 15 mg/kg and ethambutol (Sigma-Aldrich) 75 mg/kg. The same anti-TB combination therapies were provided in the reverse order using the same schedule to the four macaques in group B. During each treatment block animals received a daily oral dose of the appropriate drug combination formulated in a four ml volume of fruit puree. CT scans were collected prior to the start of treatment at week eight and at the end of each drug treatment phase at weeks 16 and 24.
Computed tomography (CT) imaging
CT scans were collected from sedated animals using a 16 slice Lightspeed CT scanner (General Electric Healthcare, Milwaukee, WI, USA) 3, 8 and 11 weeks after aerosol exposure to M. tuberculosis (Figure 1), as described previously.
11
In order to improve the characterisation of lesions and lymph nodes Niopam 300 (Bracco, Milan, Italy), a non-ionic, iodinated contrast medium, was administered intravenously (IV) at 2 ml/kg body weight. Scans were evaluated by an expert radiologist with 30 years’ experience of interpreting chest CT scans (FG) blinded to the animal’s treatment and clinical status, for the number and distribution of pulmonary lesions across lung lobes and the presence of nodules (Figure 1(a) and (b)) cavitation (Figure 1(c)), conglomeration, consolidation (Figure 1(d)) as an indicator of alveolar pneumonia, a ‘tree-in-bud’ pattern (Figure 1(e)) as an indicator of bronchocentric pneumonia and lobular collapse (Figure 1(f)). The airways were evaluated for the occurrence of wall thickening (Figure 1(g)) and presence of bronchoceles. The lymph nodes were assessed for enlargement (Figure 1(h)) and the presence of necrosis (Figure 1(i)). Extra-pulmonary tissues including liver (Figure 1(j)), kidneys (Figure 1(k)) and spleen (Figure 1(l)) were examined for the presence of single or multiple foci of disease, cavitation or necrosis.
Examples of TB-induced disease features: (a) well-defined pulmonary nodule; (b) widespread discrete pulmonary nodules; (c) cavitating pulmonary nodule; (d) discrete area of consolidation; (e) tree-in-bud pattern; (f) lobar collapse and consolidation; (g) airway disease; (h) enlarged precarinal lymph node; (i) necrotic paratracheal lymph node; (j) liver: multiple small abscesses; (k) bilateral renal abscess; (l) multiple splenic abscesses. Arrows indicate features.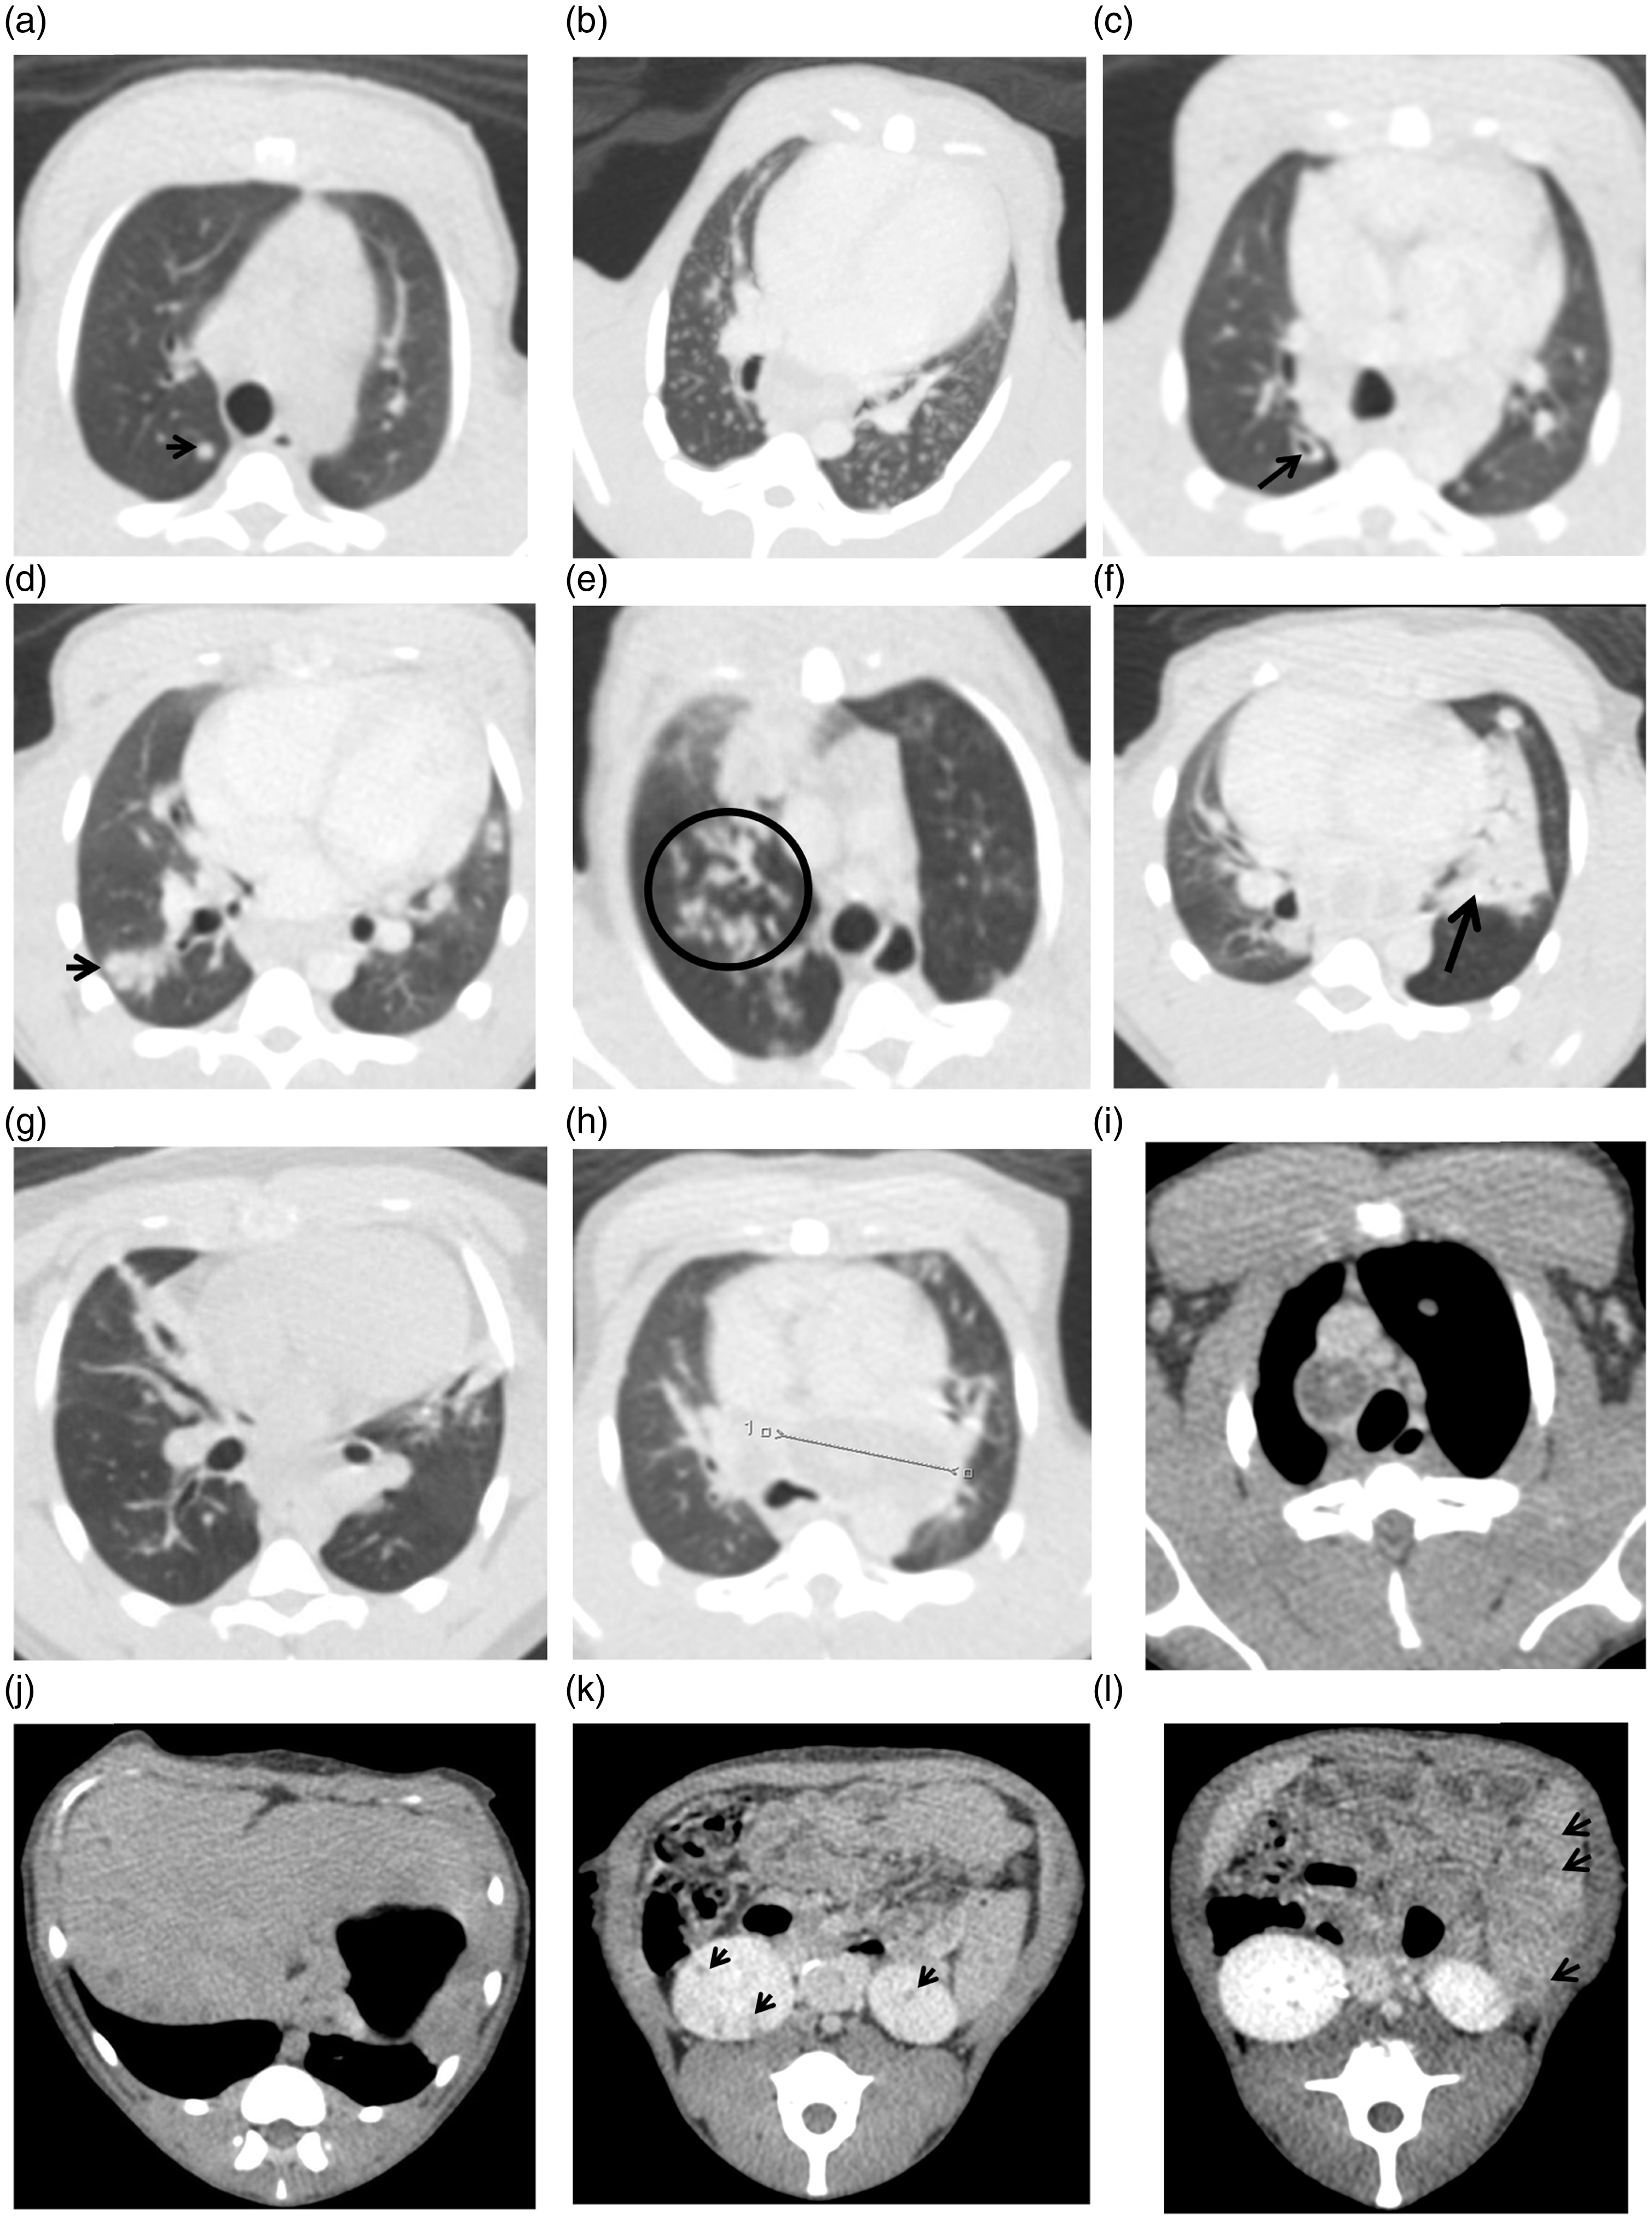
CT score system
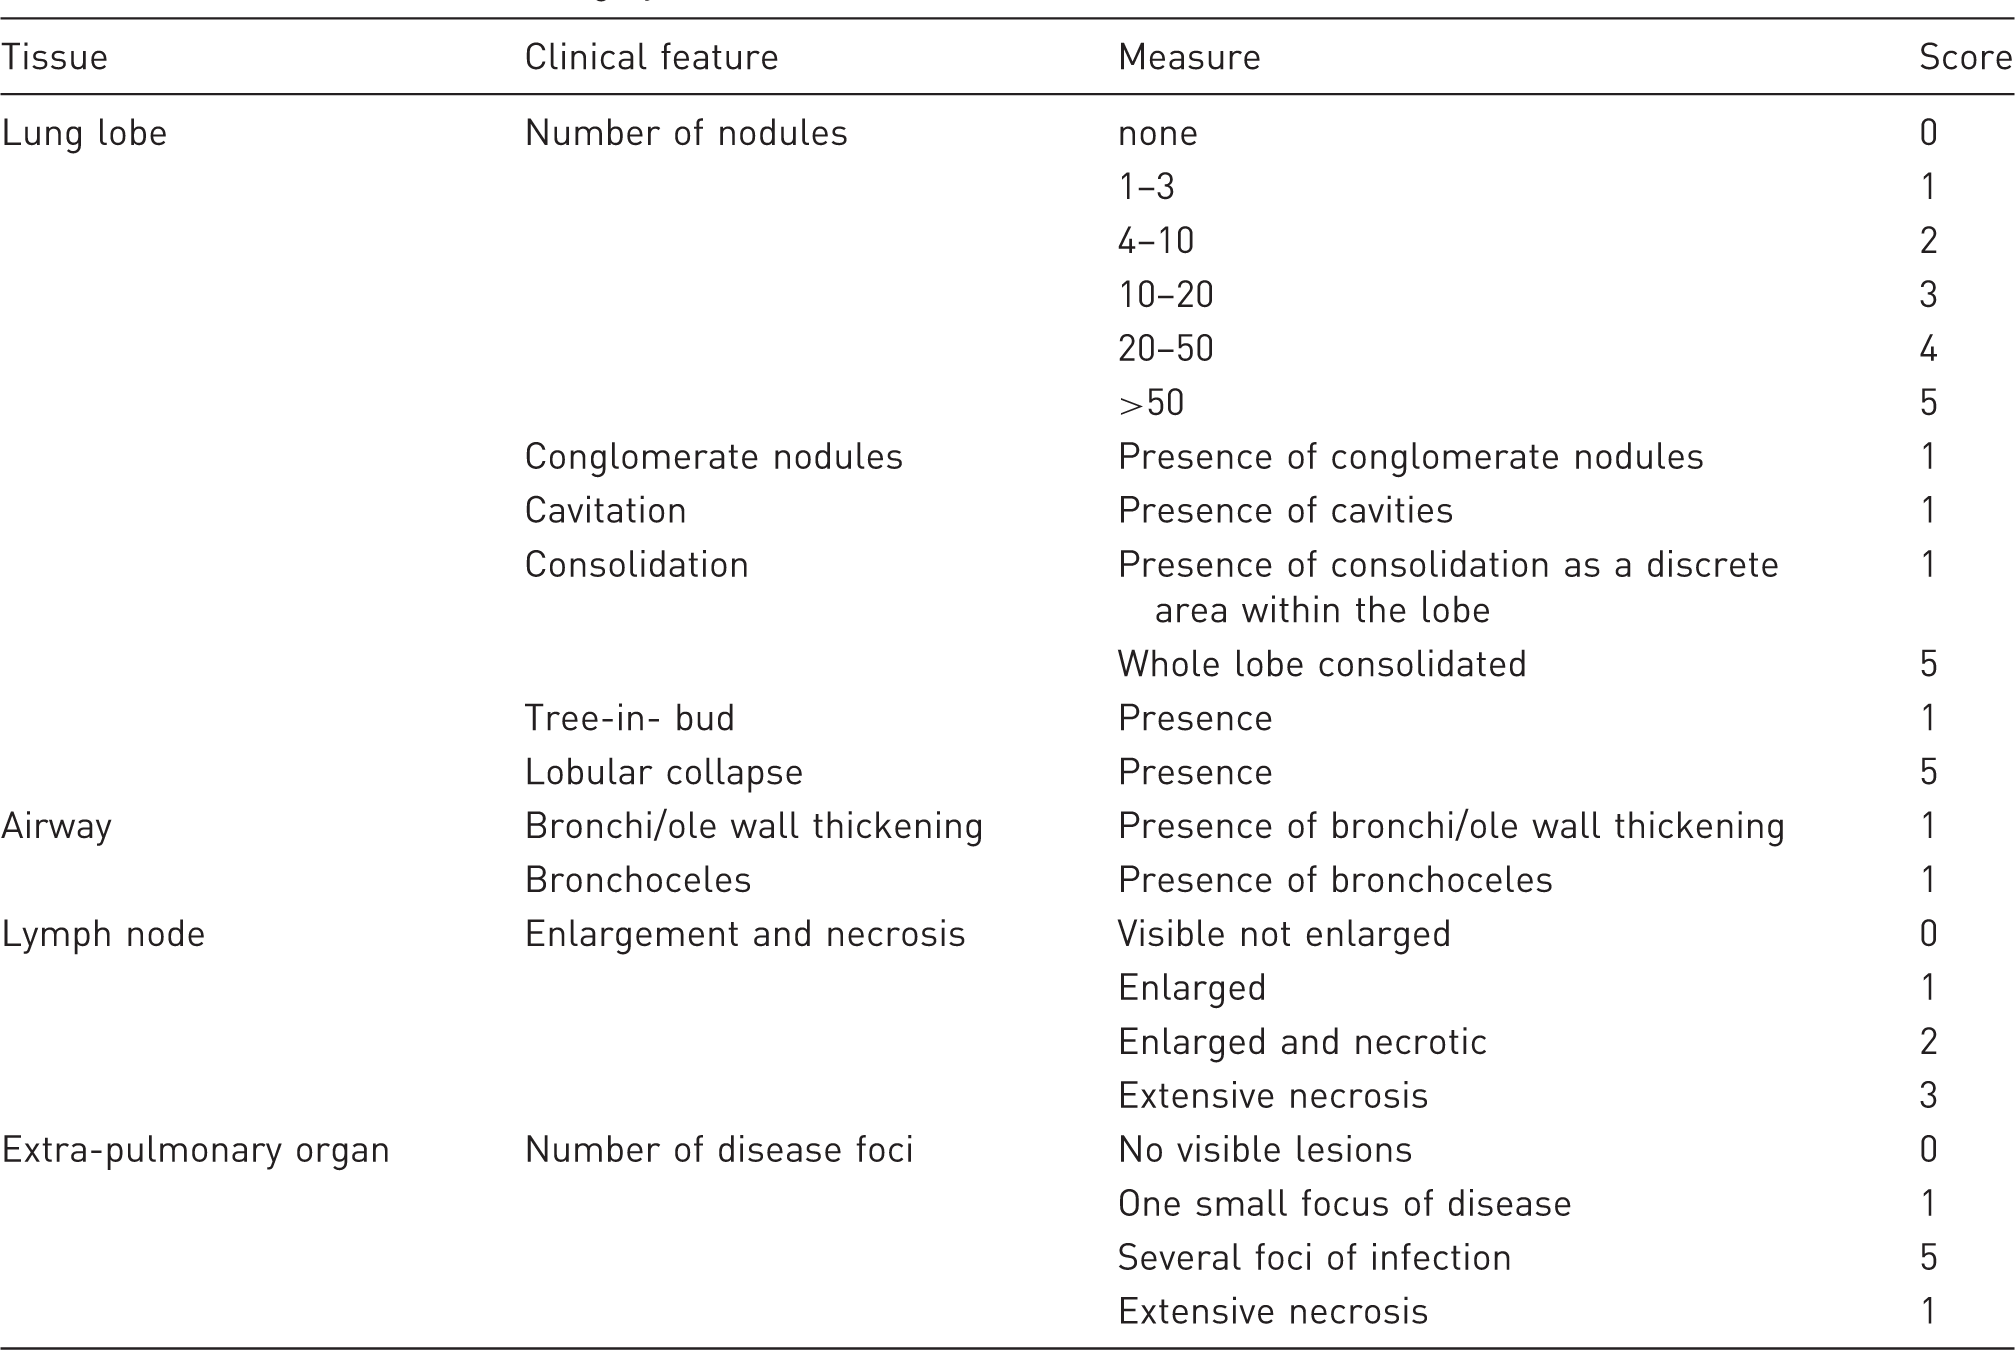
CT disease burden scoring system.
Number and origin of CT scan images analysed to assess CT score system utility.
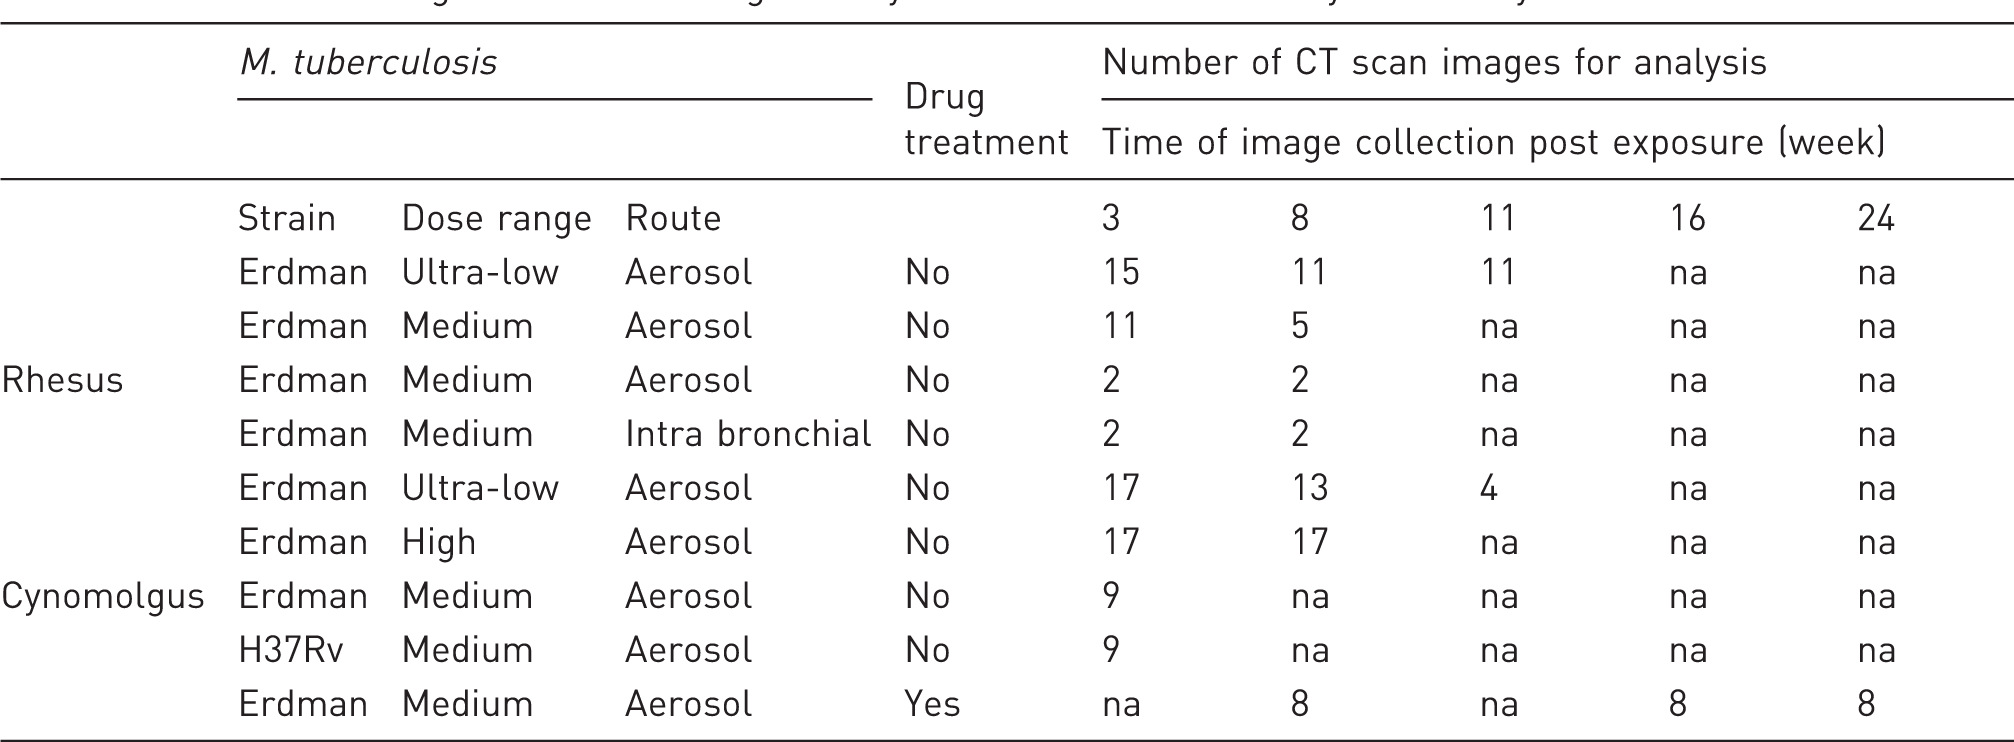
na: not available.
Necropsy
Animals were anaesthetised and blood samples and clinical data collected prior to euthanasia by intra-cardiac injection of a lethal dose of anaesthetic (Dolelethal, Vétoquinol UK Ltd, 140 mg/kg). A post-mortem examination was performed immediately and gross pathological changes were scored using an established system based on the number and extent of lesions present in the lungs, spleen, liver, kidney and lymph nodes, as described previously. 10 Procedures were conducted by personnel blinded to treatment group allocation.
Statistical analyses
The CT scans examined for this work were collected from macaques enrolled in studies designed in accordance with statistical advice such that the minimum numbers of animals were used in group sizes sufficient to robustly address the specific aims of each study. Differences in the CT score were compared between species and test groups using the non-parametric Mann–Whitney U test. The Spearman correlation test was used to determine the level of correlation between qualitative pathology scores and CT scores. The distributions of each data set were compared using the D’Agostino and Pearson’ omnibus normality test, which indicated a normal distribution for all data sets with sufficient data points. Non-parametric tests were selected for these analyses because of the relatively small data sets. All analyses were performed using GraphPad Prism, version 5.01 (GraphPad Software Inc, La Jolla, CA, USA).
Results
TB-induced disease burden assessed from CT scans collected in life is comparable to disease burden determined at necropsy based on gross pathology
In order to provide a valid tool for the quantification of TB-induced disease burden, the disease measured using the CT score system should be comparable to that measured using established approaches. To evaluate the legitimacy of the CT score system, the disease burden scores from CT images were compared to scores determined by application of an established gross pathology-based system. Disease burden was measured using both systems in 14 rhesus macaques and 18 cynomolgus macaques that had been infected with M. tuberculosis Erdman strain for between three and 32 weeks at the time of euthanasia. The CT score system was applied to images collected from subjects less than six days before euthanasia and the pathology score system was applied during necropsy. Spearman’s correlation analysis revealed significant correlations between scores determined using the CT system and the gross pathology system when the results from both macaque species were combined (p = <0.0001, r = 0.7405), or as single species (rhesus: p = 0.0178, r = 0.6305; cynomolgus macaques: p = 0.0026, r = 0.6649) (Figure 2). This indicated that the disease burden measured using the CT score system was directly comparable to the burden measured by examination of gross pathology changes. Therefore, disease burden determined from CT scans provides a relevant measure of disease burden that can be applied ‘in life’.
Correlation plot comparing TB-induced disease burden in rhesus and cynomolgus macaques scored using an established system based on gross pathological changes applied at necropsy, with disease burden scored using the CT score system applied to images collected less than 6 days before necropsy. Data points represent individual animals, and the macaque species are indicated by symbol shape and fill colour. Spearman’s correlation coefficient (r) and significance values (p) are indicated.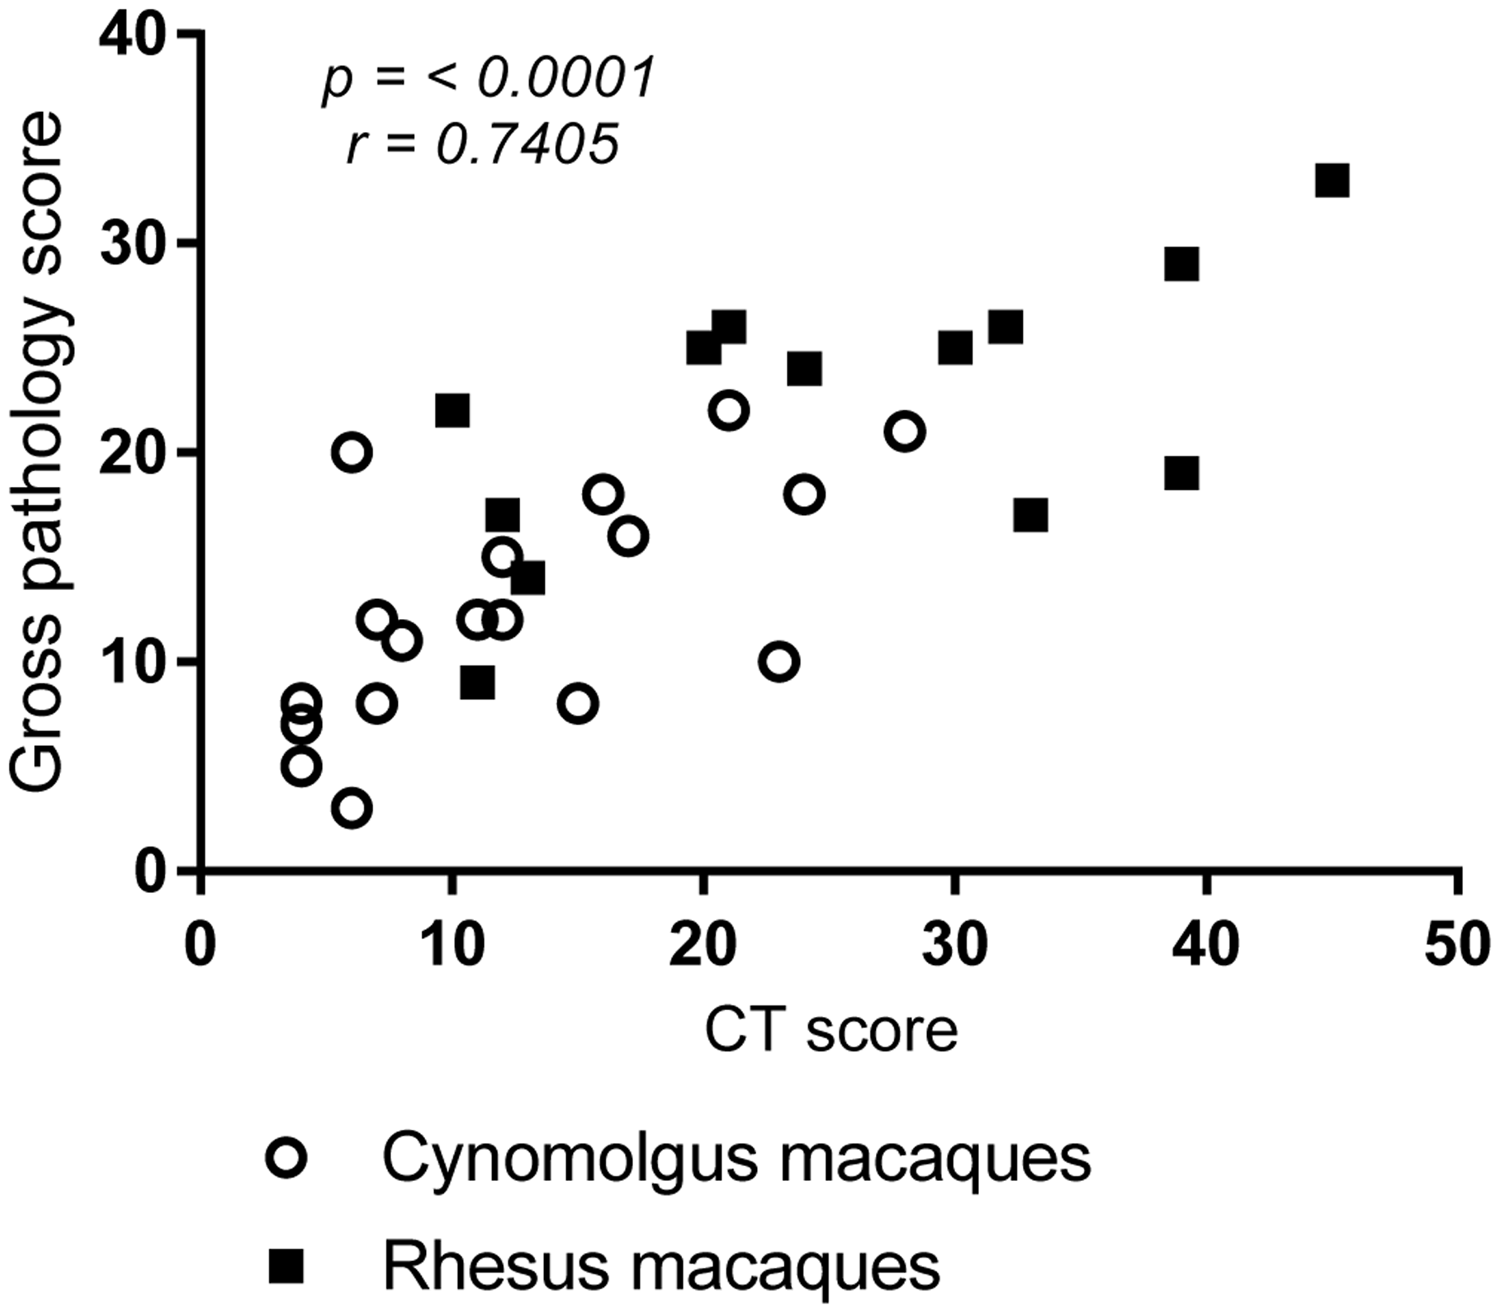
Application of the CT score system for model characterisation and refinement
Following validation of the disease scores derived from CT image analysis as a measure of the pathological changes caused by M. tuberculosis infection, the next step was to evaluate the utility this approach to discriminate differences in disease outcome. The CT score system was applied to evaluate whether changes to specific parameters impact on the outcome of infectious challenge in the TB macaque model. CT scores were calculated from images collected three and eight weeks after exposure to either an ultra-low dose (ULD), or higher dose of M. tuberculosis strain Erdman from rhesus (ULD < 40 CFU: week 3 n = 15, week 8 n = 11; medium dose range 46–250 CFU: week 3 n = 8, week 8 n = 5) (Figure 3(a)) and cynomolgus macaques (ULD < 40 CFU: week 3 n = 17, week 8 n = 13, high dose range 100–500 CFU: week 3 n = 13, week 8 n = 13) (Figure 3(b)). Comparison of the median scores for each group revealed significantly greater disease burden in the macaques of both species, following exposure to the higher dose of M. tuberculosis, at both time points (rhesus, week 3 p = 0.0059, week 8 p = 0.0096; cynomolgus, week 3 p ≤ 0.0001, week 8 p = 0.0049). The median scores showed the disease burden to increase significantly between weeks three and eight in the rhesus macaques exposed to either, ULD (p = 0.0275) or medium doses, (p = 0.0039) of M. tuberculosis and in the cynomolgus macaques following high dose (p = 0.0049) but not ULD exposure (p = 0.0804). Further comparison of the median CT scores determined from scans collected three, eight and eleven weeks after ULD exposure in rhesus (week 11, n = 11) and cynomolgus macaques (week 11, n = 4) (Figure 3(c)) revealed the disease burden to continue to increase significantly from week three to week eleven (p = 0.004) in rhesus macaques, in contrast the disease burden in cynomolgus macaques did not show significant increases during the same period (p = 0.2854). Furthermore, disease burden was significantly greater in rhesus macaques than cynomolgus macaques at all three time points assessed (week 3: p = 0.0014, week 8: p = 0.0007, week 11: p = 0.0168).
CT score system for model characterisation and refinement. The effect of aerosol dose of M. tuberculosis Erdman strain on disease burden assessed three and eight weeks after exposure: (a) CT scores calculated from CT images of rhesus macaques following exposure to either an ultra-low (PD < 40 CFU) or a medium dose (PD 46–250 CFU); (b) CT scores calculated from CT images of cynomolgus macaques following exposure to either an ultra-low (PD < 40 CFU) or a high dose (PD 100–500 CFU). (c) Influence of macaque species on outcome of exposure to an ultra-low dose (PD < 40 CFU) of M. tuberculosis Erdman strain measured by CT score. (d) Pulmonary disease burden measured by CT score induced three weeks after aerosol exposure to a presented dose of between 192 and 271 CFU of M. tuberculosis strain Erdman or M. tuberculosis strain H37Rv in cynomolgus macaques. (e) Influence of route of M. tuberculosis Erdman strain delivery on the outcome of exposure measured by CT score in rhesus macaques. Data points represent individual animals with medians indicated. Horizontal bars represent significant differences between test groups as determined by Mann–Whitney test with significance values (p) indicated above.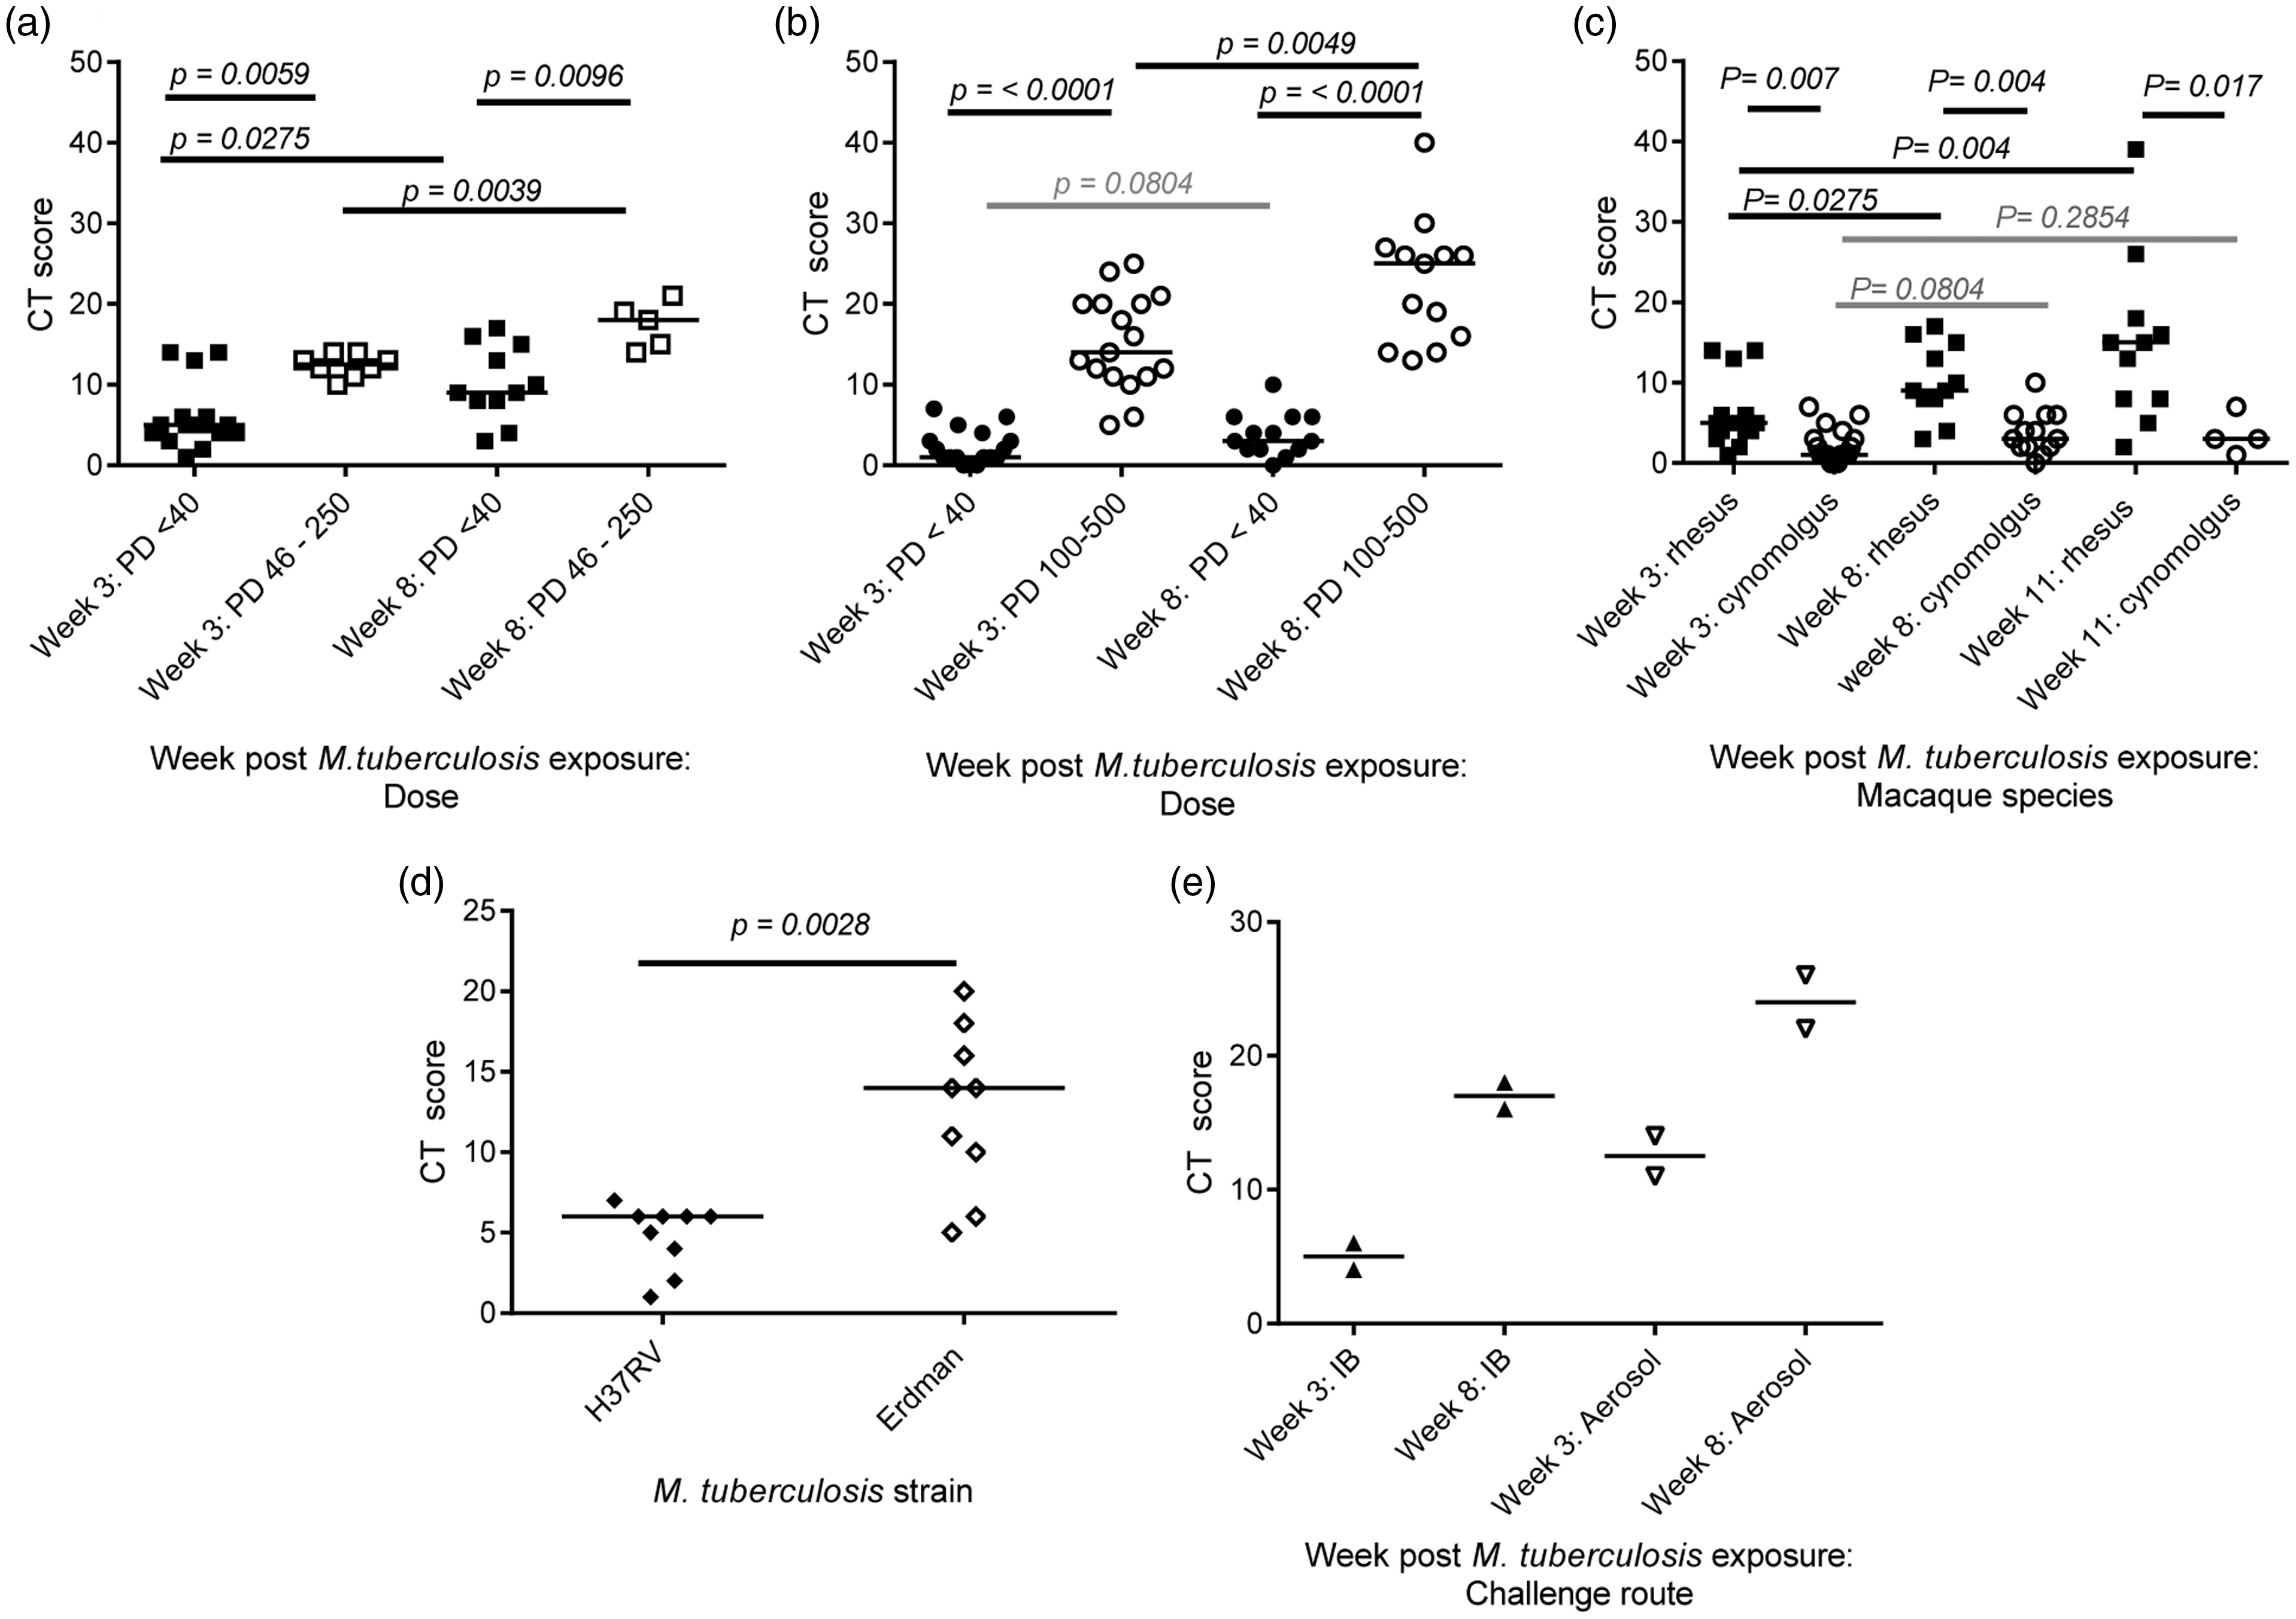
Next the CT score system was applied to evaluate the impact of M. tuberculosis strain on the disease burden induced. Data were scored from CT scans collected from two groups of nine cynomolgus macaques, three weeks after aerosol exposure to a presented dose of between 192 and 271 CFU of M. tuberculosis strain Erdman or M. tuberculosis strain H37Rv. The scores did identify a significantly higher level of disease burden in cynomolgus macaques following aerosol exposure to M. tuberculosis Erdman strain compared to H37Rv (p = 0.0028) (Figure 2(d)).
The influence of the route of M. tuberculosis exposure on disease burden was investigated through application of the CT scoring system to data collected three and eight weeks after exposure from in four rhesus macaques in a small pilot study (Figure 2(e)).25 Whilst the small number of macaques in the study prohibited the demonstration of significant differences between delivery routes, the scores identified a trend for higher disease burden in rhesus macaques following aerosol exposure to M. tuberculosis compared to bronchoscopic placement of the inoculum.
Application of the CT score system for evaluation of the efficacy of interventions against TB
If a new tool for measuring disease burden is to be useful for evaluating the efficacy of new interventions against TB, it needs to possess the power to show that treatment corresponds to a reduction in the disease burden induced after infection. To evaluate the potential of the CT score system to provide a measure of an overall treatment effect, the extent of TB disease burden was scored from CT scans collected from eight cynomolgus macaques enrolled in a trial of two anti-TB combination therapies prior to, at the mid-point of, and at the end of drug treatment. Comparison of the median scores calculated from scans from all eight animals revealed a significant reduction in disease burden following treatment with combinations of isoniazid rifampicin/pyrazinamide and isoniazid/ethambutol relative to the burden present at the start of treatment, after the first eight week phase of treatment (p = 0.0469) and the full 16 weeks of treatment (p = 0.0234) (Figure 4(a)). Interrogation of the CT scores calculated from each test group of four macaques separately for evidence of treatment effects suggested potential differences in the efficacy conferred by the two treatment regimens. Whilst both treatment regimens caused a non-significant reduction in burden over the 16 weeks of treatment, the reduction was more pronounced in group B that received isoniazid/ethambutol then isoniazid rifampicin/pyrazinamide (Figure 4(b)) (Non-significant p values from comparisons between weeks 8, 16 and 24: group A: 0.3750, 0.8750, 0.2500; group B: 0.2500, 0.1250, 0.1250.)
The effect of anti-TB therapy on TB-induced disease burden scored from CT images. CT scores calculated from CT images collected from cynomolgus macaques infected with M. tuberculosis Erdman strain prior to the start of treatment with anti-TB combination therapies (week 8), at the mid-point of treatment (week 16) and the end of treatment (week 24): (a) the cumulative effect of treatment with combinations of isoniazid/rifampicin/pyrazinamide and isoniazid/ethambutol; (b) the effect of treatment with isoniazid/rifampicin/pyrazinamide, then isoniazid/ethambutol (group A) compared with treatment with isoniazid/ethambutol then isoniazid/rifampicin/pyrazinamide (group B). Data points represent individual animals with medians indicated. Horizontal bars represent significant differences between test groups as determined by Mann–Whitney test with significance values (p) indicated above.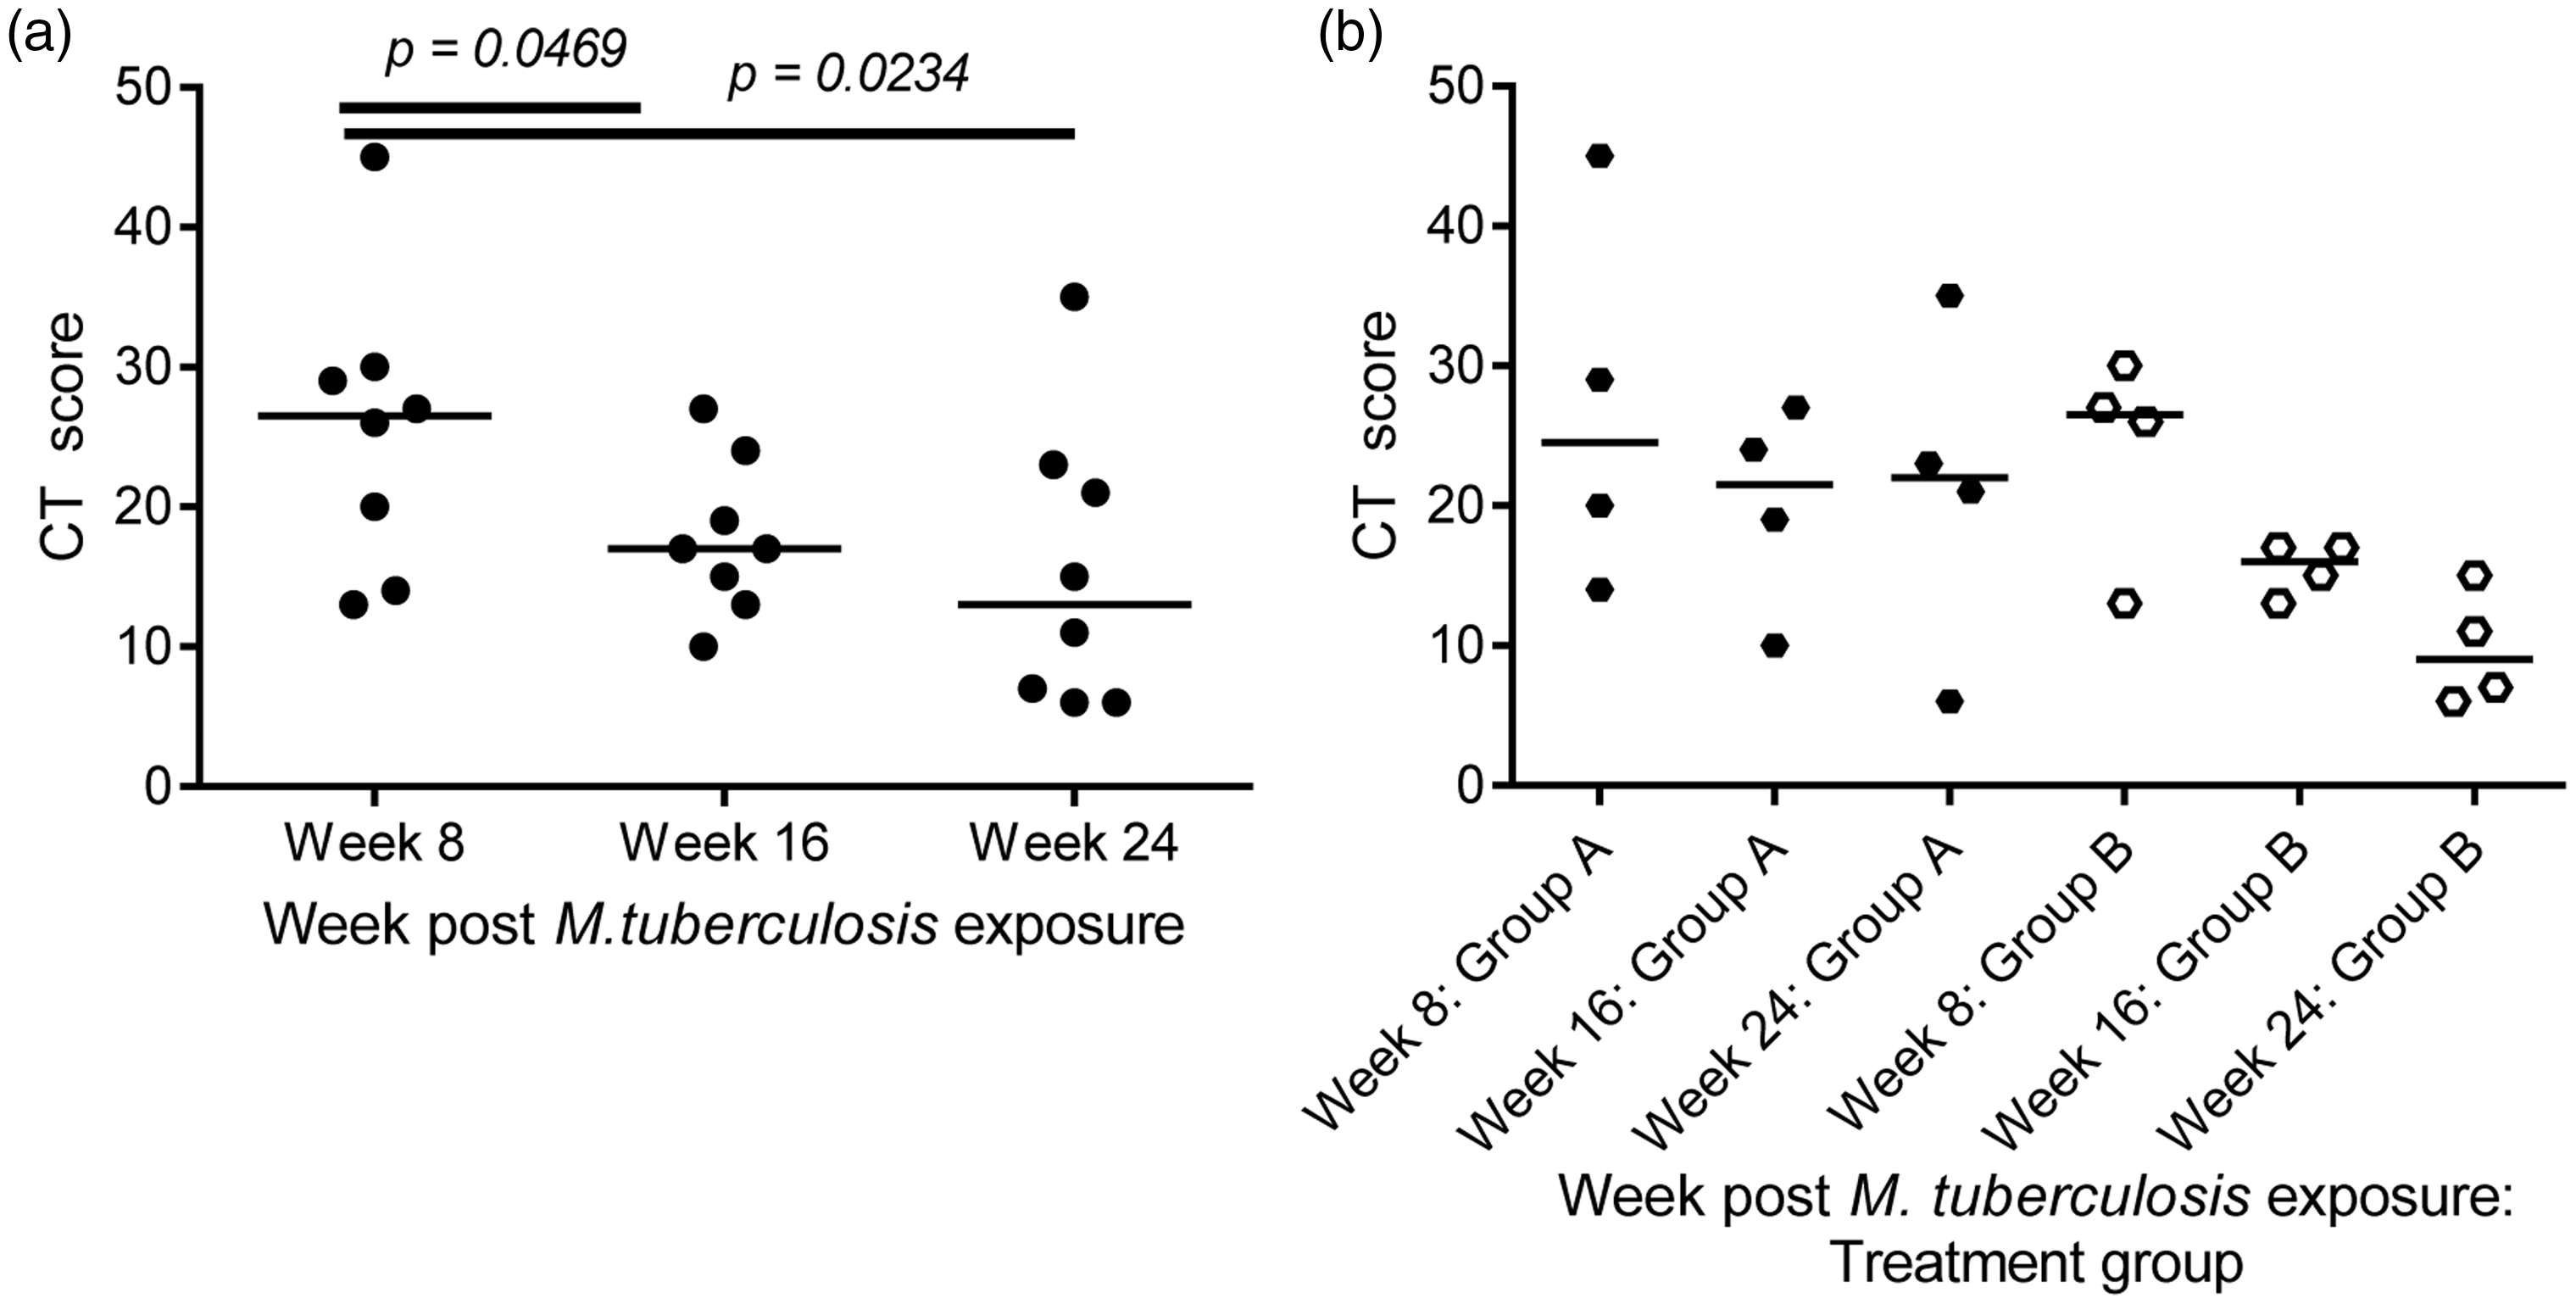
Discussion
A score system has been developed that quantifies the disease burden induced by infection with M. tuberculosis in macaques, based on the extent and features of disease visible on CT images captured in reports of scans conducted by an experienced consultant radiologist blinded to treatment status. Tools that measure the disease burden induced following infectious challenge in animal models are critical as currently this is the only way to demonstrate the efficacy of the new interventions being developed to combat TB. Score systems based on changes in gross pathology seen at necropsy provide an accepted and well established approach for quantifying disease burden in the macaque model of TB, that have been used to demonstrate the effects of experimental treatments.6–11 However, the approach is limited as assessment can only be applied to each subject on a single occasion.
We have shown that the measure of disease burden provided by the new CT scoring system accurately reflects the extent of TB-induced disease determined using pathology scoring in both the rhesus and cynomolgus macaque species. The strong correlation between the scores derived from the CT and pathology data give confidence that the scores derived from CT images will provide a useful additional approach for quantifying disease burden in macaques.
To evaluate the utility of the CT score approach to discriminate effects within the TB macaque model, we assessed the capacity of CT scores to reveal the impact on disease burden induced by changes to variable components of the model, such as the macaque species, M. tuberculosis dose and strain. Analysis of CT scores revealed the disease burden to be higher, and increase more rapidly, in rhesus macaques than in cynomolgus macaques exposed to equivalent aerosol doses. The subsequent conclusion that cynomolgus macaques possess a superior ability to control TB is in in line with other reports that have compared M. tuberculosis infection in the two macaque species.3,4,6,11 Findings from the assessment of the effects of TB exposure dose and strain measured by CT score also agreed with previous reports, with increased disease burden measured following exposure to larger aerosol doses,10,11 or after infection with M. tuberculosis strain Erdman as opposed to the H37Rv strain. 19 The parallels between our findings based on the analysis of CT scores with studies reported that used other measures of disease burden support the validity of the approach.
The analysis of CT scores also has the potential to provide new insights in to the macaque TB model. We have previously described the qualitative difference in the pattern of pulmonary disease induced by M. tuberculosis after either aerosol exposure, or intra-bronchial placement of an equivalent dose. 24 As part of the work conducted for this report, the CT score system was applied to scans collected from animals in the pilot study and enabled quantification of the influence of route of delivery on disease outcome for the first time. Results revealed the development of an increased level of disease following aerosol exposure compared to that induced after intra-bronchial placement. Although the numbers of animals in this pilot study are small, the clear difference in the disease is suggestive of an influence of delivery route on infection outcome that warrants further investigation. Thus the information provided by the CT score system can be used to refine the models applied in future studies allowing selection of the most appropriate model parameters to meet the needs of the experimental hypothesis under test. The development of new interventions against TB relies on the provision of refined TB macaque models that include sensitive measures of disease burden capable of discriminating differences between treatment groups to test the efficacy of new vaccines and drugs. The drug treatment study reported here shows that CT scores not only provide a measure that can demonstrate a statistically significant effect on disease burden, but also highlight differences in the effects of the two treatment regimens.
Quantification of disease burden from CT images provides an attractive approach for gathering data on disease burden as images can be collected using non-invasive procedures from live animals. In contrast, the pathology score system can only be applied after the death of the subject, and therefore disease burden can only be measured on a single occasion. Consequently, for studies, such as those to characterise disease caused by a new agents or to define optimal treatment effects, where there is a need to evaluate disease burden on multiple occasions, the serial sacrifice of groups of similarly treated animals has been used to enable pathology to be determined over time. As CT images can be collected from the same individual on regular occasions after experimental infection there is an opportunity to evaluate the evolution of disease or treatment effect. Using this approach the CT score system significantly reduces the number of animals needed per study, for example, a study requiring the evaluation of disease burden on five occasions in a group of six subjects using CT, would require 30 individuals to perform the same evaluation using gross pathology scores. The use of serial imaging over serial sacrifice, not only enables reduction, but also provides refinement, as change can be evaluated within the same individual reducing the opportunity for inter-animal variation to mask experimental effects and therefore improving data quality. The ability to quantify subtle pathological changes through imaging also has the potential to reduce the need to progress to higher levels of disease and thus to reduce the severity experienced during a study.
Our initial trials suggest that the CT score system developed provides a valuable system for the measurement of disease burden. Application of the score system to CT scans from more studies is now required to allow further assessment of the utility and value of this approach. It will be particularly important to trial the system in studies designed to assess vaccine efficacy as this is an arena which needs approaches capable of demonstrating treatment effects.
Footnotes
Acknowledgements
This work was supported by the Department of Health, UK. The views expressed in this publication are those of the authors and not necessarily those of the Department of Health. We thank the staff of the Biological Investigations Group at PHE Porton for assistance in conducting studies, and Ann Williams, Simon Clark and Faye Lanni for aerobiology and bacteriology support.
Declaration of Conflicting Interests
The author(s) declared no potential conflicts of interest with respect to the research, authorship, and/or publication of this article.
Funding
The author(s) disclosed receipt of the following financial support for the research, authorship, and/or publication of this article: from The Department of Health, UK.