
Abstract
Bone protection and metabolism are directly linked to estrogen levels, but exercise is also considered to have bone protective effects. Reduced estrogen levels lead to a variety of disorders, for example, bone loss and reduced movement drive. The objective of this study was to investigate the effects of estrogen on individual voluntary exercise motivation and bone protection. We investigated sham operated, ovariectomized, and ovariectomized with estrogen supplemented Wistar rats (20 weeks old) either with or without access to exercise wheels. We selected an experimental approach where we could monitor the individual exercise of group-housed rats with ad libitum access to a running wheel with the help of a subcutaneous chip. In vivo and ex vivo microcomputed tomography analyses of the tibia were performed at two-week intervals from week 0 to week 6. Furthermore, tibial trabecular structure was evaluated based on histomorphometric analyses. We observed a significant bone protective effect of E2. For exercise performance, a substantially high intra-group variability was observed, especially in the E2 group. We presume that dominant behavior occurs within the group-housed rats resulting in a hierarchical access to the running wheel and a high variability of distance run. Exercise did not prevent ovariectomy-induced bone loss. However, lack of estrogen within the ovariectomized rats led to a drastically reduced activity prevented by estrogen supplementation. Our findings are important for future studies working with group-housed rats and exercise. The reason for the high intra-group variability in exercise needs to be investigated in future studies.
Introduction
Osteoporosis is a systemic skeletal disease characterized by a low bone volume and has significant effects on the morbidity and mortality of the patient.
1
Given a high prevalence (24% among women above 50 in Germany),
2
which is expected to increase in the next years,
3
osteoporosis is one of the major health care factors with socio-economic impact. In Europe, total direct costs of osteoporosis-related fractures are expected to increase up to 76.7 billion euros in 2050.
4
It is widely recognized that estrogen deficiency plays a major role in the changes of bone metabolism and bone protection. Pharmaceutical treatment of postmenopausal hypoestrogenemia to prevent osteoporosis has been in focus for a long time. Besides pharmaceutical treatment, lifestyle factors like exercise may also play an important role in osteoporosis prevention. Research on exercise within animal models, especially rat models, is difficult. Former studies which focused on ad libitum exercise either used group means,
5
or in order to monitor individual performance, single housing.
6
On the one hand, single housing of female rats will increase their stress level,7,8 which is an important point of animal welfare and potentially influences the experiment. On the other hand, means obtained by group housing cannot display by definition the motivation and performance of individual animals. Treadmill approaches, which are based on forced running,
9
are not usable to measure motivation for exercise and also affect the stress level of the respective animals.10,11 Within this study, we applied a new experimental setup which is capable of monitoring the individual performance of group housed rats with ad libitum access to an exercise wheel to investigate the influence of exercise on osteoporosis (see Figure 1).
Schematic outline of the cage system of the exercise groups. An exercise wheel with cyclometer and antenna for individual monitoring of each animal is provided in the exercise cage. Rats are housed in the cage system for the whole time of the experiment.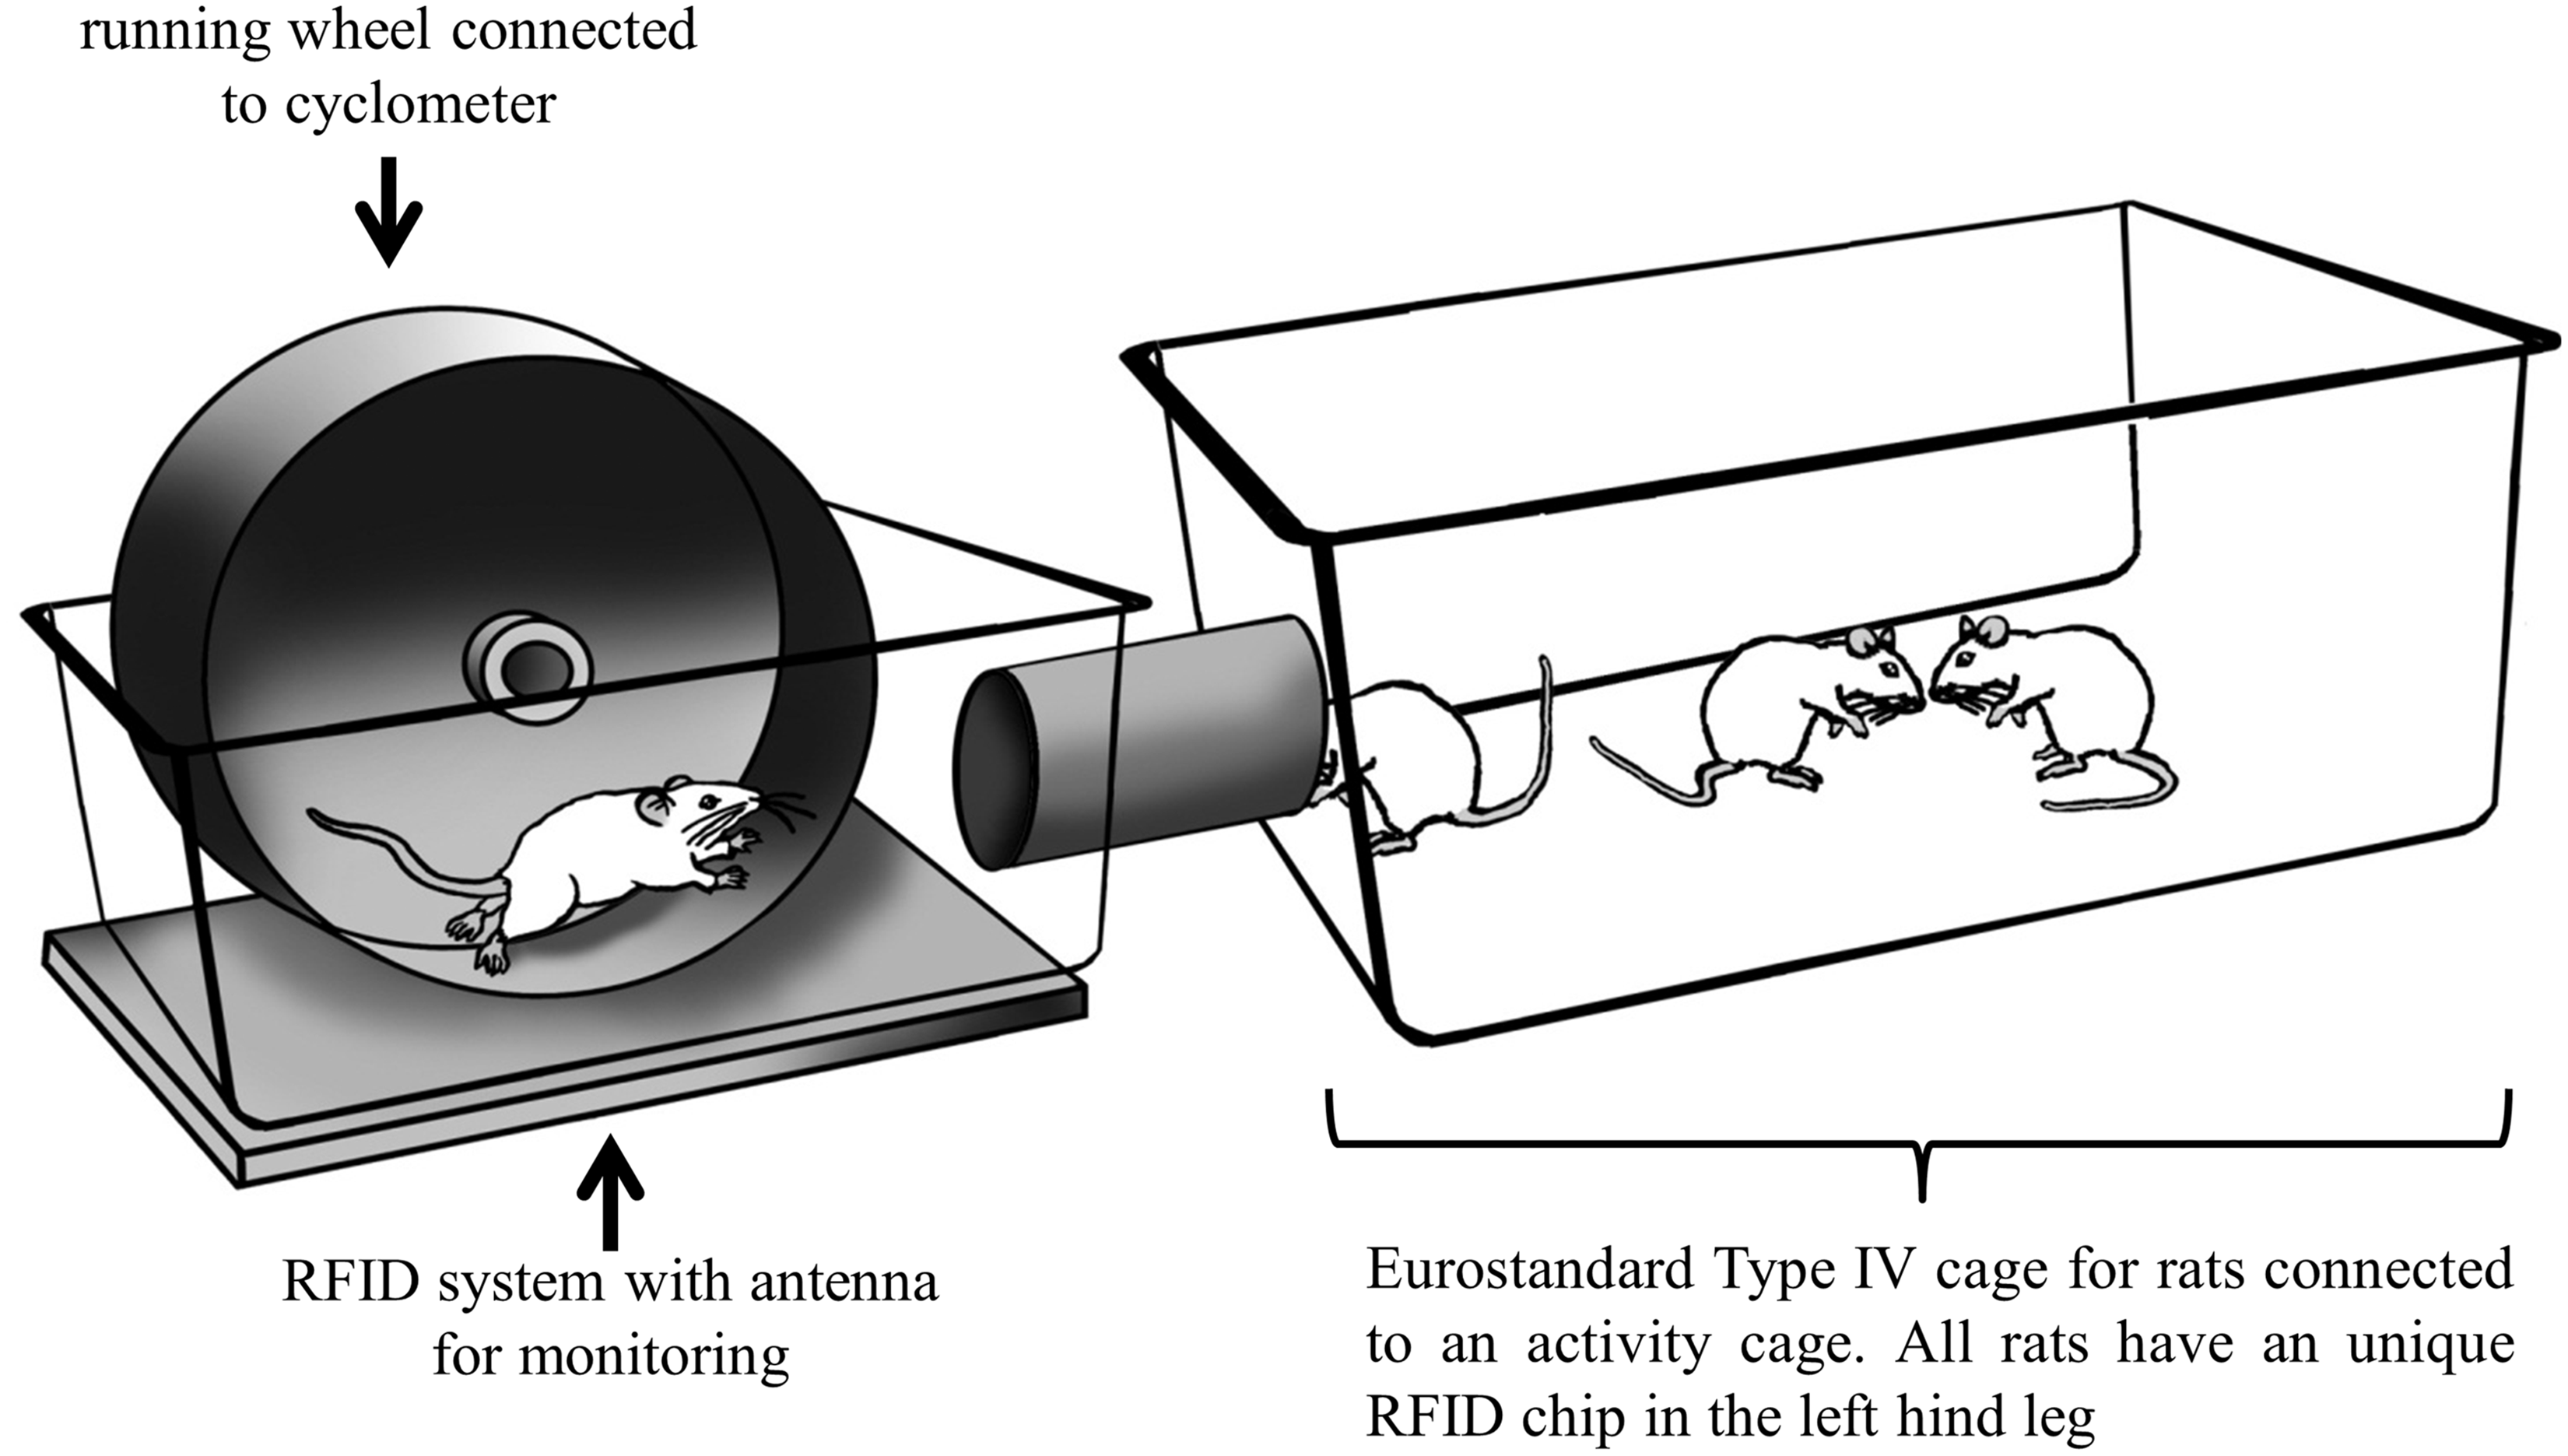
A well-established rodent model to investigate symptoms of postmenopausal estrogen deficiency is the aged ovariectomized (ovx) rat. 12 Changes of bone microstructure in ovx rats could be shown with in vivo microcomputed tomography (µCT) already after two weeks. 13 In our study, we evaluated bone changes over six weeks in a two-week interval with in vivo µCT. For the first time we could combine information of individual exercise and continuous bone changes as well as hormone status of group-housed rats.
Material and methods
Animals
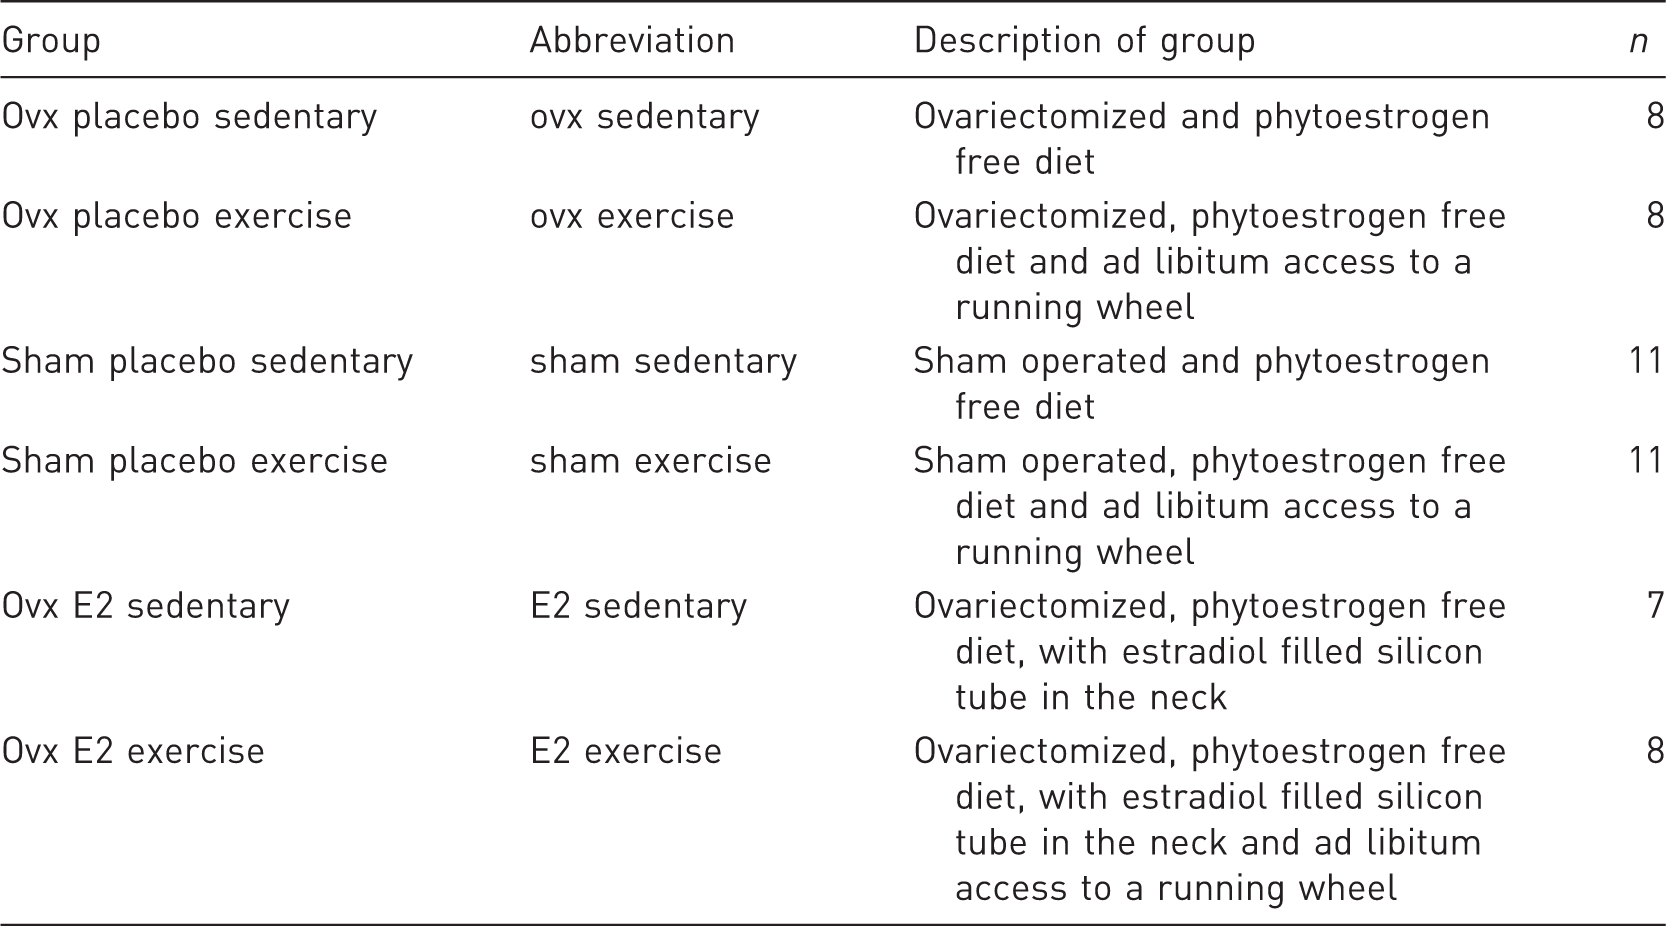
List of treatment groups, explanation of the respective treatment, and number of animals within the respective groups.
Experimental protocols were selected and performed to adhere closely to the 3R principles of animal welfare and were in line with the ethical standards listed in the 1964 Declaration of Helsinki. All procedures were conducted according to the institutional Animal Care and Use Committee guidelines and were approved by the governmental Animal Care and Use Committee (Registration No.: DD24-5131/338/9) regulated by the German federal law for animal welfare.
Experimental setup
To allow ad libitum access to a running wheel during the whole time of the experiment, each exercise group was housed in a cage system. The system consisted out of a common Eurostandard Type IV cage for rats which was connected by a tube with an activity cage (Tecniplast SpA, Buguggiate, Varese, Italy) with an exercise wheel (Figure 1).
Four animals a time were housed within the cage system with free access to food, water and both cages for the whole time of the experiment. A cyclometer (Garmin Edge 500, Garmin Ltd, Switzerland) attached to the exercise wheel monitored the running distance (RD) and the RFID detection system (Euro I.D. Identikationssysteme GmbH & Co, Germany) identified the respective individual in the cage. The logged data from RFID system and the data from the cycling computers were read out and saved every week. The individual performance of each animal was assessed by combining RFID and cycling computer datasets.
In vivo and ex vivo μCT
In vivo µCT (vivaCT 75, SCANCO Medical, Switzerland) of every animal was performed at week 0 prior to surgery. Following the surgery, two more in vivo µCT scans were performed two and four weeks post-surgery. The final µCT scan of ex vivo tibiae in 70% ethanol took place 6 weeks post-surgery. For in vivo µCT analyses rats were anesthetized with Isofluran (Isofluran CP: IsoFlo 2–4 L/min, O2 0.5–1 L/min). A tibia region around the proximal epiphyseal plate of the animals was scanned using an X-ray energy of 45 keV with 250 angles and an isotropic voxel size of 40 µm. Reconstructed µCT data were analyzed using the SCANCO Medical evaluation software. Bone parameters for the trabecular structure of the proximal tibia were analyzed about 1 mm below the growth plate. Using a bone threshold of 342 mg-HA/cm3 (gauss filter = 0.8, gauss support = 1), bone volume/total volume (BV/TV), trabecular thickness (Tb.Th), trabecular number (Tb.N), and trabecular separation (Tb.Sp) were calculated for 34 slices.
Histomorphometric analyses
For histomorphometric analyses the tibiae were demineralized in CTAB (20% (m/v)) and embedded in paraffin. Tibiae were cut in 4 µm thick slices with a rotary microtome (Leica, RM 2125RT). Slices were deparaffinized, rehydrated, stained with hematoxylin and eosin (HE) (10 min in Mayer's hematoxylin, 10 min bluing in tap water, and 5 min in 0.5% eosin solution), dehydrated, and mounted with Pertex®. To examine histomorphometric bone parameters and the changes within the trabecular structure stained slices were analyzed with OsteoMeasure™ (OsteoMetrics, Inc.). We focused on a region of interest (ROI) 1 mm distal from the proximal epiphyseal plate in the middle of the epiphysis. The total size of the ROI was 1.0 × 0.9 mm2 consisting of three columns each with five vertical arranged squares; in total 15 squares (0.2 × 0.3 mm2) were evaluated. Due to staining artifacts, evaluation of the third column could not be performed for five samples. However, the evaluated parameters are given as proportion to the respective evaluated size and trabecular structure changes in the middle of the epiphysis only distal and not lateral. Consequently, the evaluated parameters can be compared.
Statistical analyses
The data is presented as arithmetic mean ± standard deviation (SD). Endpoints and changes over time between the different groups were analyzed. To determine the changes over time for the 4 parameters obtained by µCT measurements and the differences of those changes between the respective treatment groups, mixed repeated measures analyses of variance (ANOVA) including polynomial contrasts for the parameter time were performed. Time, E2 status, and exercise status interactions were evaluated. If a significant interaction was observed, individual mixed repeated measures ANOVAs for each respective treatment group and the ovx sedentary group were conducted in order to obtain significances for every treatment group for all time points. Histomorphometric data and uterine wet weight (UWW) were analyzed with one-way ANOVA followed by a Tukey's honest significance test (HSD) post hoc test in order to determine significant differences. SPSS Statistics (ver. 23) was used for statistical analyses; p values < 0.05 were considered as significant.
Results
Body and organ weights
Summary of body weight and uterine wet weight (UWW) data. Body weight and UWW data is given as mean ± standard deviation. For UWW, a one-way ANOVA following a Tukey's HSD post hoc test was performed. Given are the p values of the Tukey's HSD post hoc test for the respective group versus the ovx sedentary group.
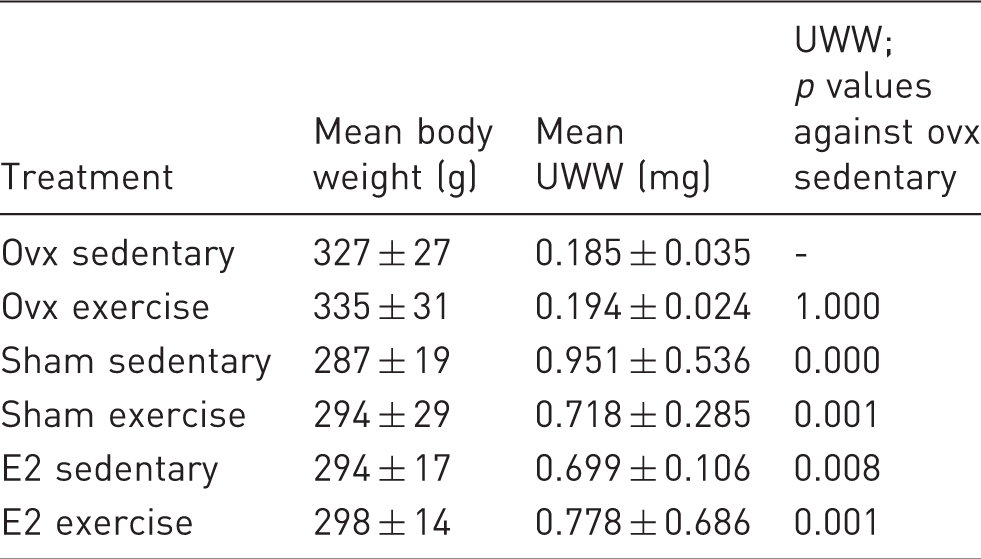
The UWW of animals treated with E2 was considerable higher compared to the UWW of the ovx animals (Table 2). Both sham groups, sedentary and exercise, showed similar UWW to the E2 groups; the ovx exercise group shows similar uteri wet weights to the ovx sedentary group (Table 2). A statistically significant difference of the weight was determined by one-way ANOVA (F(5,49) = 12.547, p = 0.001). Tukey's HSD post hoc test revealed that the UWW of the ovx sedentary group is significantly lower compared to the E2 sedentary (p = 0.008), E2 exercise (p = 0.001), sham sedentary (p = 0.000), and sham exercise (p = 0.001) groups. No statistical difference can be observed between the ovx sedentary and ovx exercise group (p = 1.000) (Table 2).
Running activity of the treatment groups
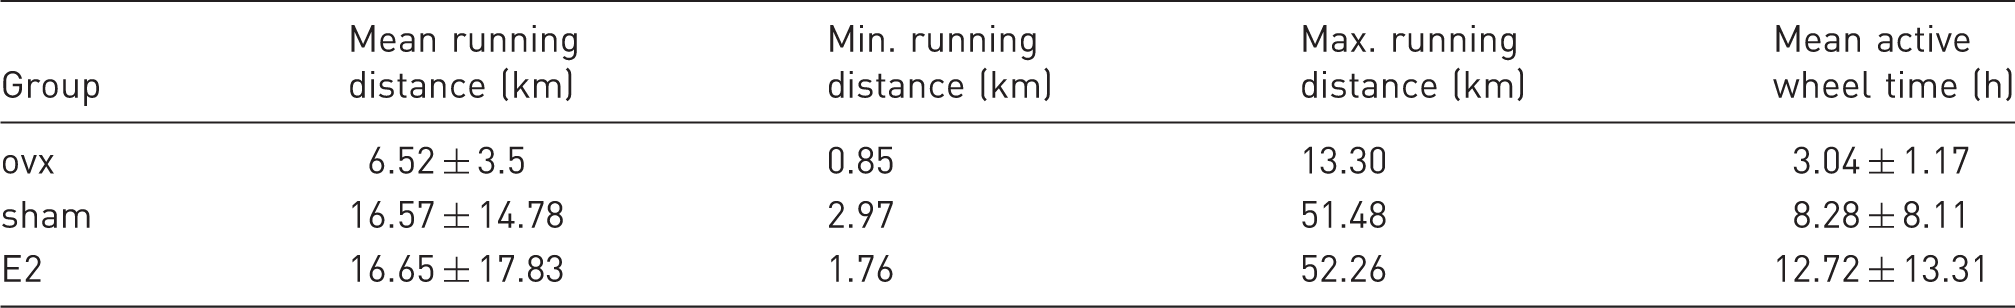
Summary of running distance of the respective groups of the animal experiment. Running distance is given in km as mean cumulated distance of the whole experiment (6 weeks subsequently after ovx). Standard deviation and minimum/maximum running distance of animals of the respective group is given as well.
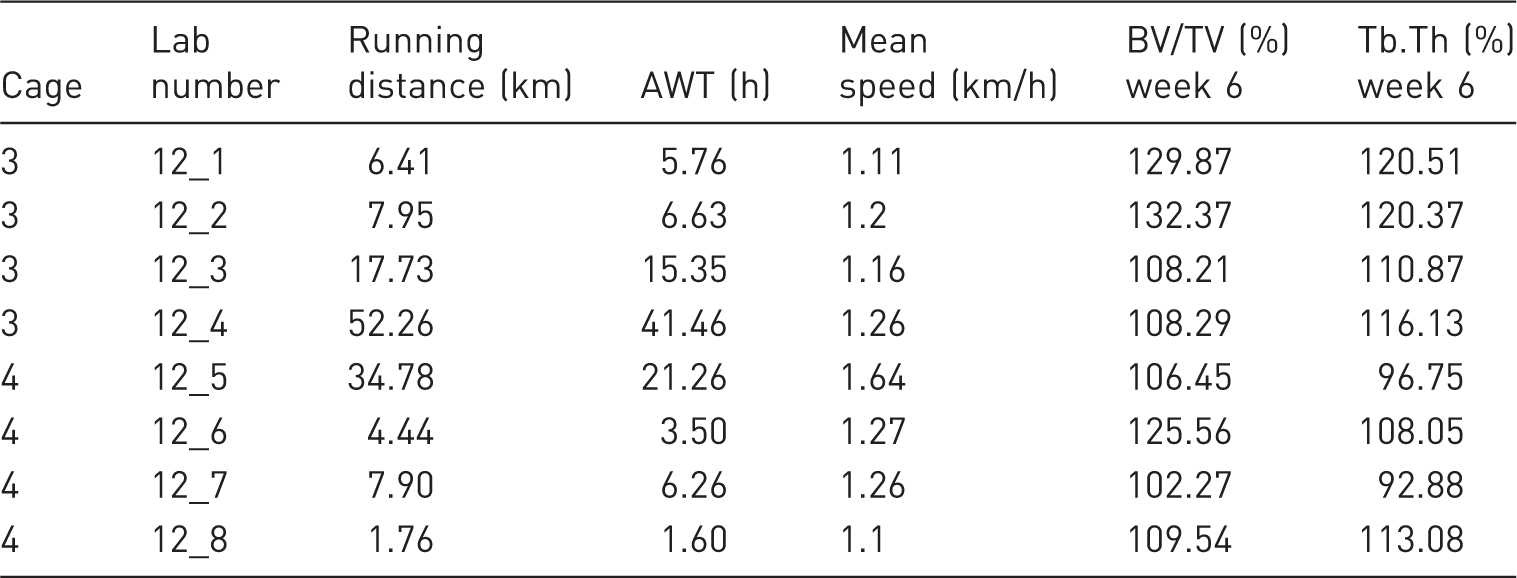
E2 group: cumulated running distance and active wheel time over six weeks, mean speed for each animal of the groups and the change of bone parameters for each animal between 0 and 6 weeks.
Bone parameters
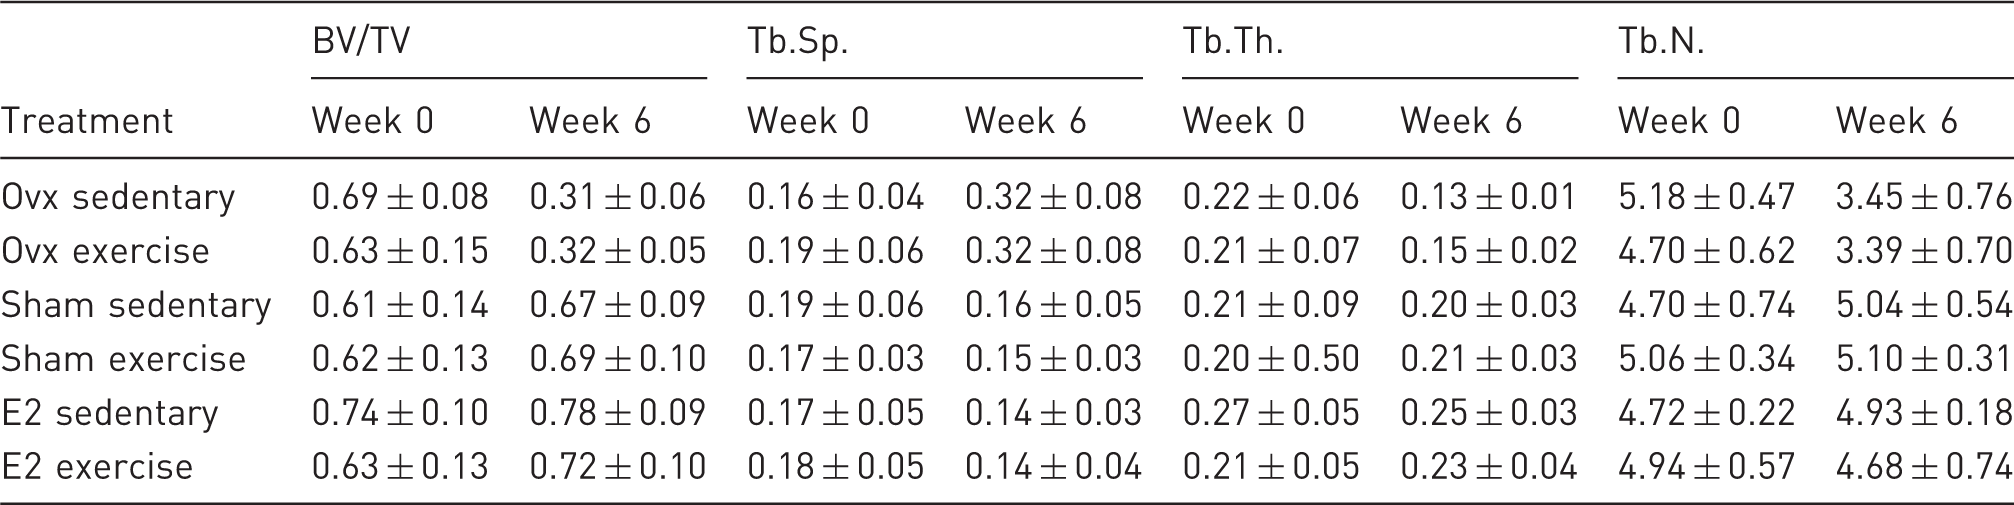
Parameters obtained by the µCT measurements at week 0. The mean values ± standard deviation are shown for all groups and all parameters used in this study.
Changes of the respective parameters over time of the experiment are shown in Figure 2. Values of the µCT measurement at week 0 were set to 100%. In order to compare inter- and intra-group changes over time, the values of two, four, and six weeks post-surgery were converted into percentage with the week 0 values used as basic value (Figure 2). For all four bone parameters, the changes over time of both ovx groups, exercise and sedentary, are contrary to the other four groups (Figure 2). The mean BV/TV of both ovx groups is steadily decreasing over time to fewer than 60% of the week 0 value, for the sedentary group more than for the exercise group. For the other treatment groups the BV/TV is slightly increasing (Figure 2) up to 105–116% at week 6. The trabecular separation of the ovx groups is increasing to 179% for the exercise group and up to 202% for the sedentary group. For all other four treatment groups a slight decrease can be observed to 83–89% at week 6 (Figure 2). Trabecular thickness and number is decreasing to fewer than 80% for both ovx groups, for the sedentary group more than for the exercise group. For both sham groups after 6 weeks a slight increase of trabecular number and thickness can be observed except for the trabecular number of the sham exercise group which is 101% at week 6. Trabecular thickness is increasing for the E2 exercise group to 110%, whereas trabecular number is steady for the first 4 weeks and from weeks 4–6 slightly decreasing to 96%. The E2 sedentary group shows an increase in trabecular thickness until week 2 and a steady decrease to 96% at week 6. For trabecular number it is the other way around, first a slight decrease until week 2 and afterwards an increase to 105% at week 6. Statistical analysis revealed significant interactions between time and E2 status for all 4 parameters. Thus, for all four parameters additional analyses were conducted (see statistical analyses) and significant differences in changes over time between the groups will be displayed in Figure 2.
Changes of bone parameters during the time span of the experiment. Parameters were obtained via µCT in vivo and ex vivo. For each parameter, values pre-surgery (week 0) were set to 100% and used as basic value for the following measurements. Means of the percentage values of the respective treatment groups are given. Significant changes (α = 0.05) for the respective groups are indicated below the y-axis with the respective symbols. Changes over time were significantly different between ovx groups and, E2 and sham groups; the changes over time were significant different for BV/TV (a) and Tb.Th (c) at week 2, for Tb.N (d) at week 4, and for Tb.Sp (b) at week 6. Within the ovx groups, the exercise group showed, compared to the sedentary group, a lesser decrease of BV/TV (a), Tb.Th (c) and Tb.N (d) and a lesser increase in Tb.Sp (b) over time of the experiment. Parameter changes over time between the sham and E2 groups were not significant different, but at week 6 similar.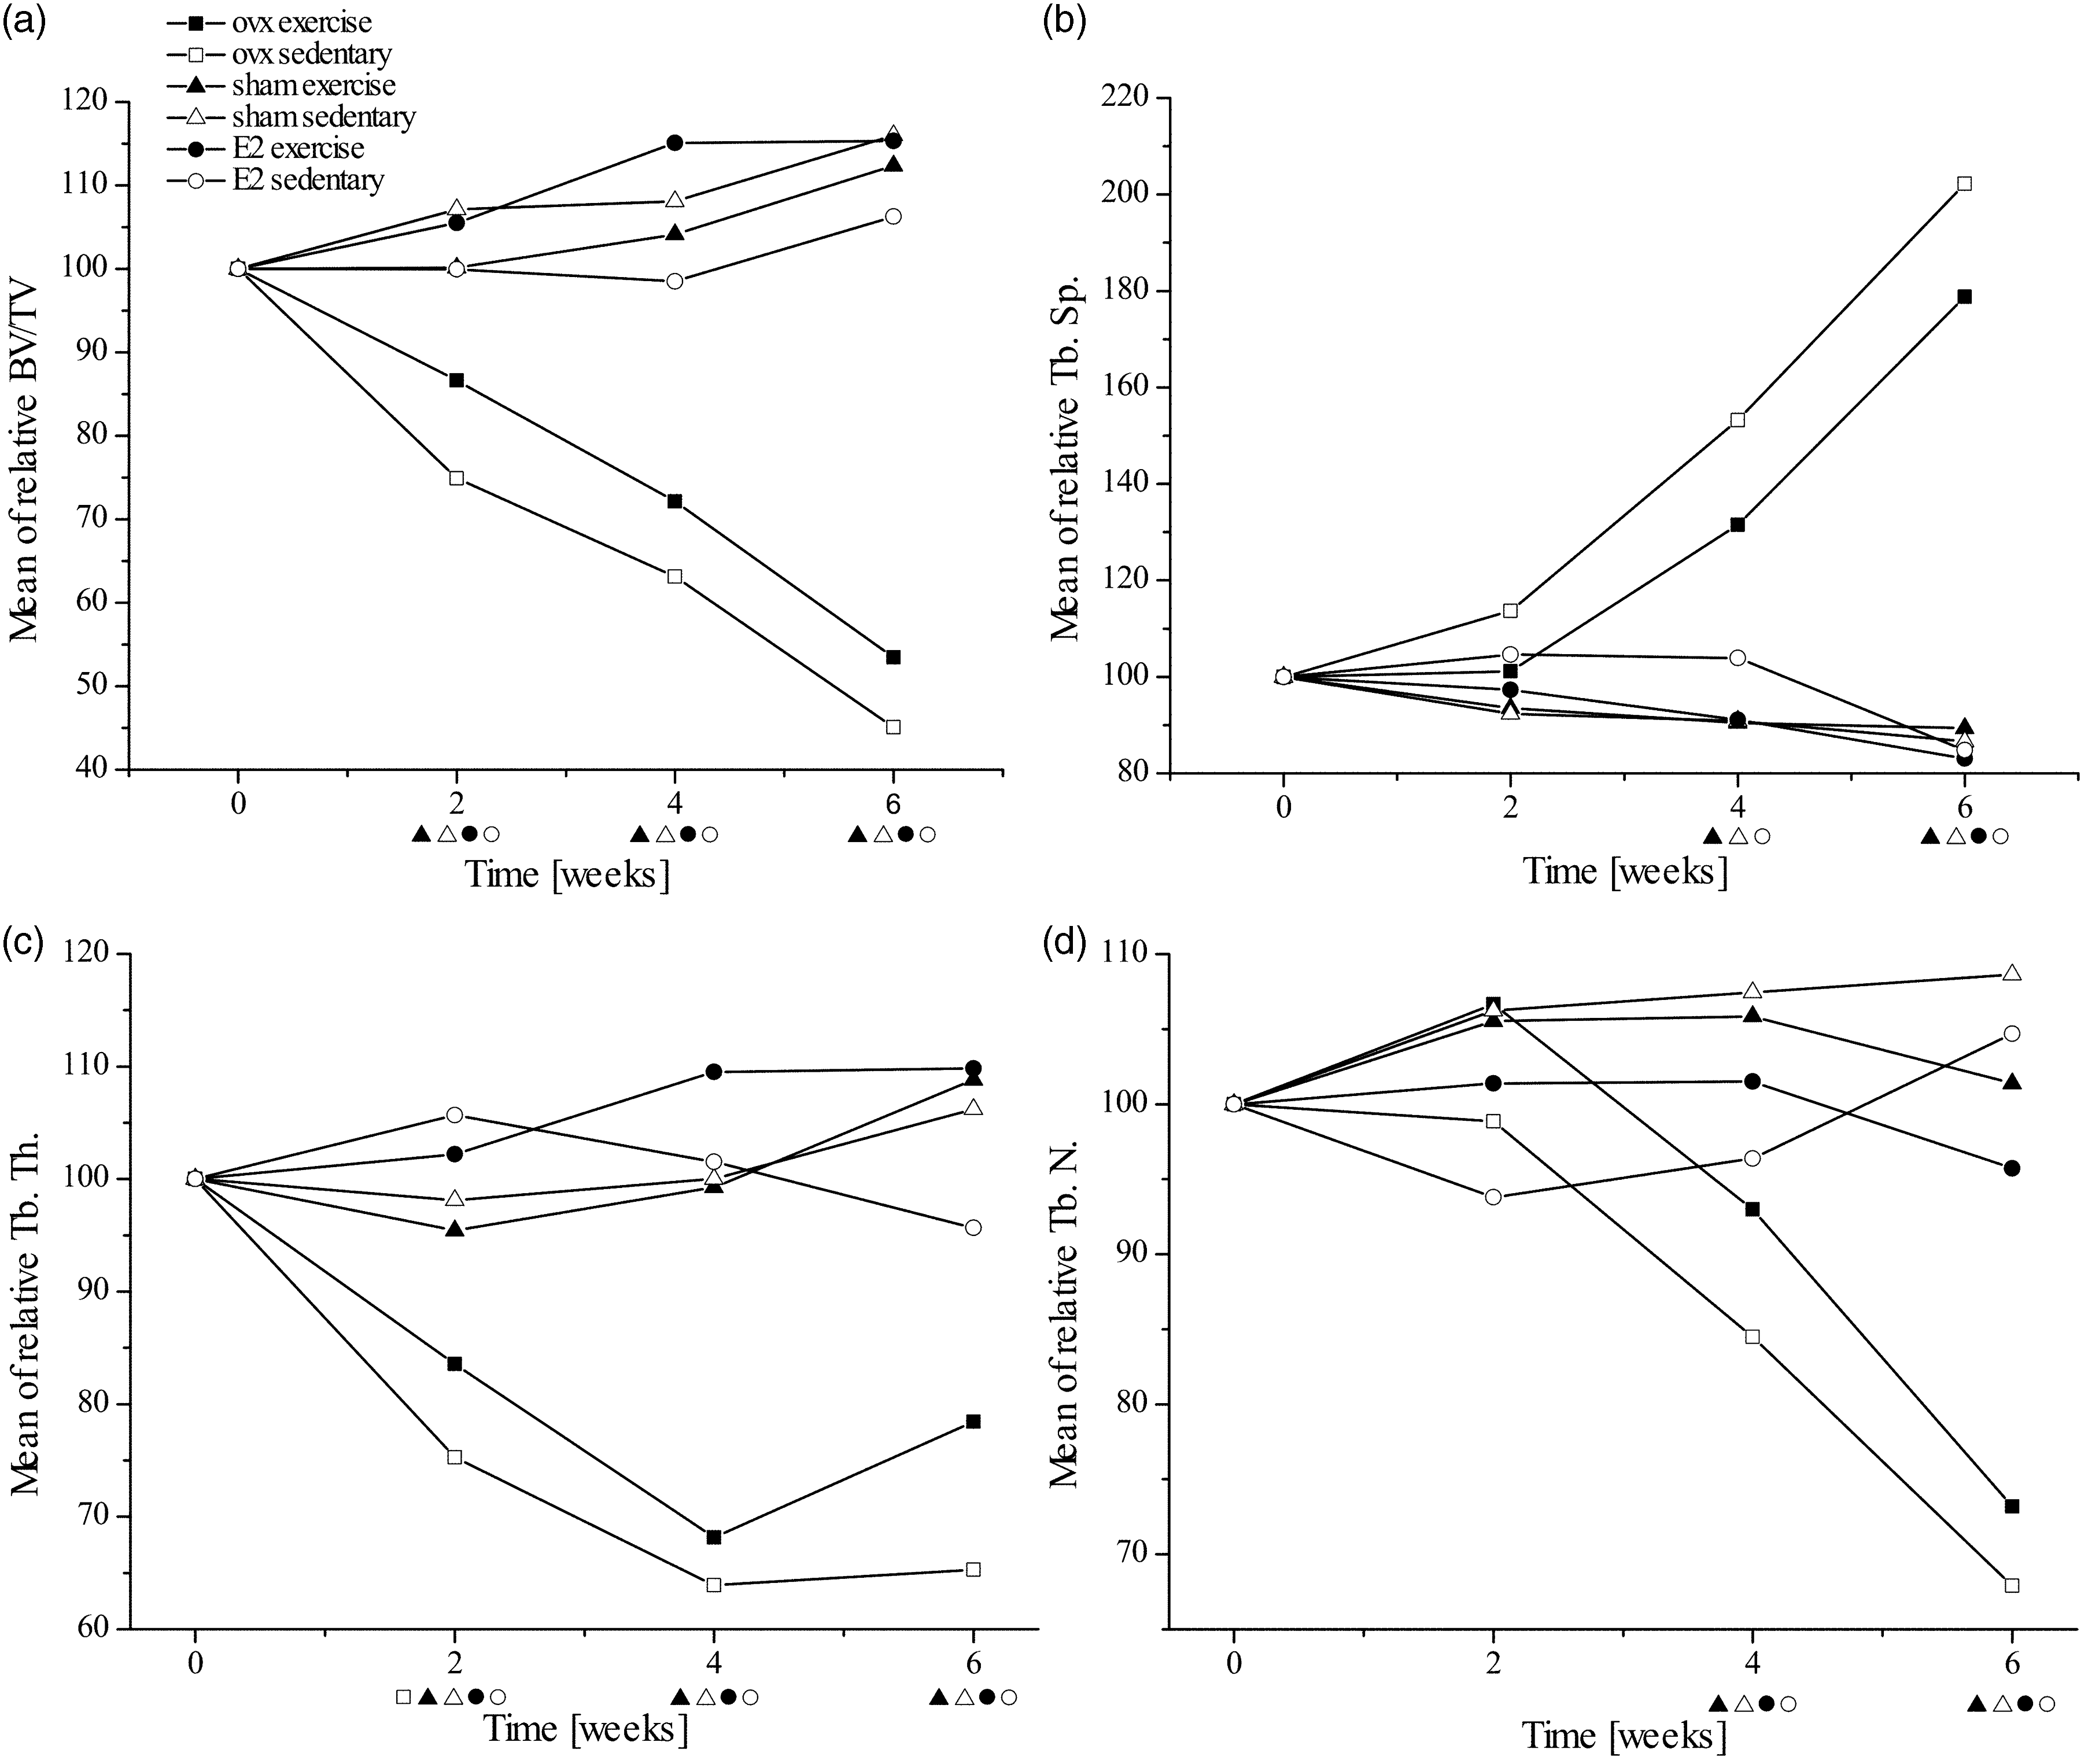
Within the histomorphometric analysis the same parameters were evaluated as for the µCT measurements. The absolute values differ between the histomorphometric and µCT analyses (supplementary material). However, the relationships between the groups are equal in both groups: ovx sedentary and ovx exercise groups differ significantly from the other four groups, except for trabecular thickness.
Discussion
Evaluation of the E2 status and influence of E2 on exercise motivation of group housed rats
The significantly increased UWW of the E2 treated groups compared to the ovx groups proves that the implanted E2 filled silicon tube worked and increased the E2 level of the rats. The effect of the very low isoflavone content of the here used 2019 Harlan Teklad standard rodent diet is negligible; the animals consumed at most 1.34 mg/kg BW per day isoflavones. In accordance with literature investigating effects of isoflavones in rats, this concentration does not show any effects in the so-far tested endpoints. 15 A similar UWW of the E2 and sham groups might indicate a similar estrogenization of the respective groups (Table 2). This supports our assumption that the E2 levels of the E2 treated groups are similar to the ones described in Möller et al., 14 because we used an identical protocol to treat our animals. However, we could not measure the E2 plasma concentration in this study and, therefore, a final proof for the E2 plasma concentration is lacking. The observed weight gain of the ovx rats and the prevention of this by E2 supplementation supports findings of previous studies. 16 Partial prevention of ovx-induced osteopenia by weight increase, although previously reported, 17 was not supported by several recent studies.13,18 In addition, our data show irreversible changes within the bone microarchitecture (Figure 2, Supplementary Material 1).
Besides the weight change, the E2 status had a strong impact on the movement motivation of the rats (Table 3). The reduced RD at week one post-surgery is likely an aftermath of the surgery. However, RD increases especially within the sham and E2 group afterwards as the animals recover from the surgery. All animals underwent surgery (sham or ovx) and consequently hereafter we do not focus on the surgery effects as they are irrelevant when comparing the different groups. The permanently decreased movement drive of the ovx group after surgery is displayed by a reduced distance run and a reduced time spent in the wheel compared to the E2 and sham group. Our findings support previous studies which showed that E2 status has a high impact on movement motivation.2,19,20 The increased locomotor activity of the sham and E2 group, displayed by the distance run, is mediated via the ERα in the medial preoptic area (MPOA).21,22 However, the overall locomotor activity was not monitored. In future experiments it would be of great interest to analyze if the general locomotor activity was influenced by the possibility to use the running wheel. Although the inter group variability was expected and is based on the different treatments, the intra-group variability was, especially within the E2 group, substantially higher than it was assumed beforehand. It is noticeable that in both cages of the E2 group one animal was using the running wheel for a long time and hence was able to run considerably more than all other animals in the same cage. It is implausible that this occurred by chance, as it is always the same animal which spent more time in the wheel (12_4 and 12_5, see Table 3). Potential genetic disposition is not likely to cause this variability, as it is rather unlikely that these genetic predisposed animals are spread even over the cages. Furthermore, genetic variability is limited, even in outbred strains like Wistar rats. 23 Different running pace does also not answer the high difference in total distance run; Average running pace itself has a limited variability and does not correlate with the total distance run (Table 4). We presume dominant group behavior of the respective animals as explanation for the high intra-group variability of distance run.
The permanent high E2 level induced a high movement motivation. Furthermore, running wheels are enrichment for the standard laboratory cages. Here, a competition about the running wheel is possible and a dominant rat would use the wheel more frequently. Such a hierarchical access to the running wheel could explain the strongly variable AWT and, consequently, distance run in the wheel. Both E2 exercise groups support our theory. Based on the running distance a hierarchy could be observed: 12_4 and 12_5 (supplementary material) ran every week considerably more than all other animals, whereas 12_3 and 12_7, except for 12_7 for week 2, (supplementary material) always ran the second most distance. The here shown potential dominant dependency of running is an interesting topic for further research.
The low performance of the ovx group was expected as they lack almost entirely estrogen and are less motivated to run. Given the overall low performance and motivation, dominant behavior resulting in competition about the exercise wheel could not occur except for week 0, pre operation. However, also the high performer and presumably dominant animals (1_3 and 1_12) were less motivated after operation, resulting in low distances run (supplementary material). Within the sham group variability decreased slightly compared to the E2 group (see SD, Table 3). Nevertheless, a reduced variability can be expected as sham group rats went through multiple estrous cycles and within the estrous cycle the E2 level and hence the E2 induced movement drive was changing. Depending on the temporal shifts between the estrous cycles of the respective rats, movement drive of the respective animals might be high at different time points avoiding a strong competition about the running wheel.
However, the hypothesis cannot be applied on every single cage and needs to be tested in future experiments. If the dominant animal hypothesis can be confirmed, simple changes in the structure of the experiment like adding additional running wheels will allow the submissive animals to run more. Thus, the intra-group variability will decrease and evaluation of the impact of exercise will be more significant.
Bone protective effects of estrogen and exercise
Our results show that estrogen supplementation protects the bone from ovariectomy induced bone loss. The changes over time within cancellous bone, displayed by all measured bone parameters obtained by the µCT measurements (Table 5), were significantly different between the ovx group and the E2 treated groups (Figure 2). Bone loss occurred immediately after ovariectomy (Figure 2). After 6 weeks all 4 parameters showed a significantly different change between the aforementioned groups, proving that the experimental period of 6 weeks is sufficient to show changes of the bone micro-architecture due to different E2 levels. Changes over time of the E2 treated and sham group were similar, showing that the E2 intervention prevented the ovx induced bone loss almost completely.
After 6 weeks an additional influence of exercise on all measured bone parameters was not significant. However, within the ovx groups the exercise group showed a less severe bone loss than the ovx sedentary group, for Tb.Th an increase beginning at week 4 post-surgery could be even observed. The lack of significance was likely caused by the aforementioned low exercise performance of the ovx groups. The exercise performance of the ovx group dropped post-surgery and stayed steadily below 50% of the pre-surgery values (data not shown). Compared to the E2 group, the ovx group ran only one third of the respective mean distance post-surgery (Table 3). Consequently, the impact of exercise was much lower within the ovx group than within the E2 group. However, as stated above, the E2 intervention itself prevented from ovx induced bone loss completely prohibiting a potential bone protective effect induced by exercise. The histomorphometric analysis supported the findings of the µCT based analysis. Only for Tb.Th no significant differences, neither for E2 status nor for exercise, could be observed. However, having partly diverging results with two different methods is common. We consider the µCT based analysis as more reliable, because histomorphometric analyses are based on one single endpoint measurement of one longitudinal slice of the bone and a ROI of 1.0 × 0.9 mm2.
Given the low impact, duration of further experiments could be expanded to see differences between exercise and sedentary groups more clearly. After 6 weeks, three out of four parameters measured by the µCT did not reach a steady state, but were still increasing (Tb.Sp) or decreasing (BV/TV and Tb.N).
Another approach would be an increase of the running wheel activity of the ovx group, e.g. with a reward system. For the E2 group an intervention needs to be designed where the E2 level of the animal is above the ovx group level but still suboptimal to induce a bone loss which is less severe than for the ovx group. A high intra-group variability might be used as an advantage in future studies. Animals with low and high exercise performance can be contrasted and an impact of high and low exercise on bone loss could be tested. This was not possible in this study because of the general low performance of the ovx group and the general lack of bone loss in the E2 group.
Conclusion
Our experimental setup was suitable to link individual exercise motivation of group-housed rats and in vivo µCT measurements of bone parameters; hence we were able to evaluate interactions of animal activity, hormone status and changes in the microarchitecture of bone over a period of six weeks. The approach used herein is a major refinement for animal welfare, as it avoids stress caused by single housing while still having the advantages of individual monitoring of the exercise performance. This was so far not performed with rats. Additionally, compared to single housing, group housing is more resource-friendly. Our data show that E2 intervention is the strongest short-time effect to prevent bone loss during osteoporosis and that it also preserves the overall exercise motivation. Within the ovx exercise group a slight, non-significant, bone protective effect could be observed, although estrogen deficiency induced a significant post-surgery decrease in exercise performance. Over the whole experiment, the exercise performance showed high intra-group variability, especially within the E2 group. Thus, exercise performance is not solely based on treatment, but group behavior might play an important role. Consequently, group means should not be referred to individual performance and future studies should focus on potential social reasons for the observed variability.
Supplemental Material
Supplemental material for Influence of estrogen on individual exercise motivation and bone protection in ovariectomized rats
Supplemental material for Influence of estrogen on individual exercise motivation and bone protection in ovariectomized rats in Laboratory Animals
Footnotes
Declaration of Conflicting Interests
The author(s) declared no potential conflicts of interest with respect to the research, authorship, and/or publication of this article.
Funding
The author(s) disclosed receipt of the following financial support for the research, authorship, and/or publication of this article: The work was supported by the Deutsche Forschungsgemeinschaft (grant number BE 5466/2-1).
Acknowledgments
Sincere thanks to two unknown reviewers whose comments substantially improved the manuscript. The authors wish to thank Renate Linke for her assistance with animal husbandry and Susanne Broschk and Antje Beyer for technical assistance during animal surgeries.
References
Supplementary Material
Please find the following supplemental material available below.
For Open Access articles published under a Creative Commons License, all supplemental material carries the same license as the article it is associated with.
For non-Open Access articles published, all supplemental material carries a non-exclusive license, and permission requests for re-use of supplemental material or any part of supplemental material shall be sent directly to the copyright owner as specified in the copyright notice associated with the article.