
Abstract
A relative bioavailability study (RBA) of two phenytoin (PHT) formulations was conducted in rabbits, in order to compare the results obtained from different matrices (plasma and blood from dried blood spot (DBS) sampling) and different experimental designs (classic and block). The method was developed by liquid chromatography tandem-mass spectrometry (LC-MS/MS) in plasma and blood samples. The different sample preparation techniques, plasma protein precipitation and DBS, were validated according to international requirements.
The analytical method was validated with ranges 0.20–50.80 and 0.12–20.32 µg ml−1, r > 0.999 for plasma and blood, respectively. Accuracy and precision were within acceptance criteria for bioanalytical assay validation (< 15 for bias and CV% and < 20 for limit of quantification (LOQ)). PHT showed long-term stability, both for plasma and blood, and under refrigerated and room temperature conditions. Haematocrit values were measured during the validation process and RBA study. Finally, the pharmacokinetic parameters (Cmax, Tmax and AUC0–t) obtained from the RBA study were tested. Results were highly comparable for matrices and experimental designs. A matrix correlation higher than 0.975 and a ratio of (PHT blood) = 1.158 (PHT plasma) were obtained.
The results obtained herein show that the use of classic experimental design and DBS sampling for animal pharmacokinetic studies should be encouraged as they could help to prevent the use of a large number of animals and also animal euthanasia. Finally, the combination of DBS sampling with LC-MS/MS technology showed to be an excellent tool not only for therapeutic drug monitoring but also for RBA studies.
Introduction
It is well known that a pharmacokinetic (PK) analysis of a pharmaceutical product requires a considerable number of experimental units (individuals) to achieve a reliable statistical result. Nowadays, the study of PK in mammals is based on animal plasma separated from whole blood obtained at different time intervals. 1 The first issue arises from the large volume of blood samples required (>100 µl) by the conventional techniques of sample preparation, which finally compromises the survival of experimental animals in studies with multiple sampling times. 2 For small mammals, this volume is large enough as to demand the sacrifice of the animal per time point. This is unacceptable due to the intrinsic variation added to the assay and for the practical and ethical considerations associated with the euthanasia of a large number of animals. 1 An option for addressing this problem would be the block design, i.e. an experimental design involving a large number of grouped animals and lesser extractions per group and at different time points.
In recent years, the use of dried blood spot (DBS) for the miniaturisation of analytical procedures has become more important as it presents advantages such as non-invasive sampling procedures, minimal chance of contamination, no need for anticoagulant, small volume of samples, stable analyte matrix, and low cost of shipping.3–5 Moreover, DBS presents the same characteristics as the classic whole blood sampling regarding the estimation and interpretation of PK parameters. 6 Drug exposure assays in animals is simplified by easy sample preparation techniques, such as DBS, as it reduces the volume of blood samples needed, thus leading to significant benefits according to the reduction, refinement, and replacement principle (3Rs) for animal research.7,8 Although plasma is the classic matrix used for this type of assay due to the difficulty of working with whole blood, the latter offers the additional advantages of providing information about the sum of bound (Cb) and unbound (Cu) drug concentrations and a better interpretation of its clearance. 6
Relative bioavailability (RBA) focuses on the release of a drug substance from a drug product and its subsequent absorption into the systemic circulation to demonstrate the absence of significant differences in the rate and extent to which the active ingredient or active moiety in pharmaceutical equivalents or pharmaceutical alternatives become available at the site of drug action when administered at the same molar dose under similar conditions in an appropriately designed study. 9
Thus, studies of RBA allow generic drugs to be classified as therapeutic equivalents and to infer that they produce the same clinical effect and the same safety profile as the prescribed drug. 10 The drug 5,5-diphenyl-imidazoline-2,4-dione, commonly known as phenytoin (PHT), is one of the drugs most widely used as an anticonvulsant to treat many epileptic seizure types. 11 Furthermore, an efficient, simple and rapid analytical methodology based on liquid chromatography-tandem mass spectrometry (LC-MS/MS) to determine PHT and even antiretroviral levels in human plasma and saliva has been recently developed.12–14
There are many studies showing the advantages of DBS, but its application to PK and pharmacodynamics studies in animals has not been fully focused. Therefore, the aim of the present work was to compare the blood/DBS technique with the conventional technique of plasma protein precipitation through an RBA study in rabbits using LC-MS/MS technology and to compare two types of experimental designs (classic and block).
Material and methods
Chemicals and reagents
Acetonitrile (MeCN) and methanol (MeOH) high-pressure liquid chromatography (HPLC) grade, as well as ammonium acetate for analysis (ACS, Reag Ph Eur), were Carlo Erba Reagents and Merck, respectively. Ultrapure water HPLC grade was supplied by Tedia (Fairfield, OH, USA). Chemical standard for PHT and the internal standard (IS) clonazepam (CZP) were supplied by a pharmaceutical company and stored in a vacuum desiccator. The test and reference formulations containing 100 mg of PHT were supplied by a pharmaceutical company. The DBS cards used were Whatman-S&S#903, with a 5 mm diameter punch. Rabbit blood pool and plasma were provided by Comparative Medicine Centre (ICIVET Litoral-UNL/CONICET).
Animals
Sixteen male and female young New Zealand (CLG) rabbits, aged 3 months, with genetics and sanitary certification provided by the Comparative Medicine Centre (ICIVET-Litoral), were randomly selected for this study. The rabbits were kept in open cages with a surface of 0.46 m2/animal (Euro Rabbit Rack, Allentown Inc, NJ, USA). During the experiment, the animals were kept under controlled cycles of light and darkness (light from 08:00 to 20:00 hours (h)), high-efficiency-particulate-air (HEPA) filter air at 18–22℃, with free access to water and commercial food (rabbit feed, GEPSA, Argentina). All procedures were carried out according to the Guide for the Care and Use of Laboratory Animals (National Research Council, 2011) and were approved by the Institutional Ethics and Security Committee of the Facultad de Ciencias Veterinarias – Universidad Nacional del Litoral, Santa Fe, Argentina (protocol number: 422-15). The health status of the colony was periodically checked by Charles River Laboratories (Wilmington, MA, USA) through Federation of European Laboratory Animal Science Associations (FELASA) Complete PRIA service.
The average weight of the rabbits ranged from 2.0 to 2.9 kg and each was individually identified. Rabbits received the drug under overnight fasting conditions. The adequate number of animals and samples were confirmed by a sample size calculation that evaluated the number of samples necessary to produce an estimate of the concentration that would fall within 0.4 units of the real value.
Study design
Drug administration
An RBA study of two PHT sodium formulations (test and reference) of 100 mg tablets (1 × 100 mg tablets) was performed under fasting conditions in a randomised, open-label, two-period crossover design with a 14-day washout interval between doses. Then, the procedure was repeated in reverse order of administration of the test and reference products. The dose was defined considering lethal dose 50% (LD50) (125 mg kg−1 in rabbits) and 100 mg of the drug were administered (one tablet) to the sedated animal. For drug administration, a qualified operator held with both arms the rabbit body and exposed the animal’s head, while another operator placed the tablet in the rabbit’s mouth followed by 2 ml of water. Simultaneously, the operator restricted the mouth of the rabbit for a few seconds applying gentle tension to ensure complete disintegration of the tablet.
Sample collection
Blood samples were collected in tubes containing ethylenediaminetetraacetic acid (EDTA) at the following intervals: 0 (pre-dose), 1.0 h, 2.0 h, 3.0 h, 4.0 h, 5.0 h, 6.0 h, 7.0 h, 8.0 h, 9.0 h, 10.0 h, 12.0 h, 24.0 h and 32.0 h for odd caravans and 0 (pre-dose), 1.0 h, 3.0 h, 5.0 h, 7.0 h, 9.0 h, 12.0 h, and 32.0 h for even caravans. A total volume of 30 µl of rabbit blood sample was spotted with a repeater pipette onto the DBS cards and allowed to dry at room temperature for at least 2 h. Then, each card was stored at room temperature in a sealed plastic bag. The remaining blood samples were centrifuged at 2000 × g for 5 minutes and plasma was separated. Then, plasma was stored at –20℃ until analysis. The correlation between PHT concentrations in matched plasma and blood spot samples was evaluated.
Standards, calibration solutions and quality control (QC) samples
Stock solutions of PHT and IS were prepared in MeCN-water (50:50, v/v) at concentrations of 2 mg ml−1. An aliquot of PHT and IS stock solutions were diluted with MeCN to obtain the working solutions (WS) for the plasma technique, while WS were prepared in water for the blood/DBS technique. WS were prepared fresh daily.
Calibration standards were prepared for plasma and whole blood by spiking with WS to concentrations which spanned the expected range. The blood was then spotted onto the collection cards (30 µl per circle) and dried thoroughly before being processed as described above.
QC samples were prepared by spiking known amounts of PHT-WS into a plasma pool and blank blood from healthy, drug-free donor rabbits in four levels of concentration (limit of quantification (LOQ), low, medium and high). Calibration points and QC samples were extracted and tested for each analytical batch along with the unknown samples. Additionally, the calibration curves used for the validation procedure and for the RBA study were performed with a standardised haematocrit (Hct) value of 37%.
Sample preparation
Aliquots of 100 μl of plasma or QC samples were mixed with 100 μl IS-WS (final concentration of 25.04 µg ml−1) in a 2 ml centrifuge tube, and 900 μl MeCN were added in order to induce protein precipitation. Then, samples were vortexed and centrifuged, and 500 μl of the supernatant were transferred to an autosampler vial and diluted with 1000 μl of HPLC water. Finally, the samples were injected into an LC-MS/MS system for analysis as described above.
A 5 mm diameter disc was punched from the central part of the blood spot from each DBS card for calibration points and QC. The disks were placed directly into a centrifuge tube. A volume of 500 μl of MeOH, containing IS (36.05 µg ml−1), was added to perform the extraction. Afterwards, they were vortexed (1 minute) and sonicated (15 minutes). Finally, 300 μl of supernatant were added to 600 μl of water in autosampler vial and were injected into an LC-MS/MS system.
Validation procedure
The plasma and blood/DBS analytical techniques were validated in accordance with the International Conference on Harmonisation (ICH) guideline15–18 and linearity, LOQ, accuracy and precision, recovery and matrix effect, influence of the Hct, blood spot volume, stability and storage were considered. The criteria for validation were as follows: mean concentration values should be within 15% of the spike value, except for LOQ, which should be within 20%, for both calibration points and QC samples.
Linearity
PHT calibration curves were prepared by spiking blank rabbit plasma and blood in a concentration range of 0.20–50.80 µg ml−1 and 0.12–20.33 µg ml−1, respectively. Each concentration was analysed in triplicate. The spiked blood was gently mixed in a tube for 15 minutes at room temperature before spotting on DBS cards and then left to dry. Calibration curves were generated using 1/× weighting of standards and adjusted by linear least square.
Limit of quantitation
The LOQ was defined as the lowest concentration in the calibration curve that can be measured within acceptable accuracy and precision values.15–17
Accuracy and precision
QC samples were prepared by spiking WS to blank rabbit plasma and blood samples at concentrations of 0.20, 0.76, 6.10 and 35.55 µg ml−1 and 0.12, 0.49, 6.39 and 20.33 µg ml−1, respectively. The accuracy and precision of the developed techniques were determined by the analysis of all QC concentrations in plasma and blood/DBS in five-fold on three separate days. Accuracy (%) and precision (coefficient of variation (CV%)) were calculated on the same day (intra-day) and on separate days (inter-day).
Recovery and matrix effect
In order to identify the best solvents to extract PHT from DBS, different solvents, such as MeOH, MeCN, and mixtures (50:50) of MeOH/water and MeCN/water, were tested. Extraction procedure efficiency was determined by the analysis of DBS spiked samples at two different concentration levels (0.39 and 16.25 µg ml−1). The analyte response obtained from the extracted samples spiked at the beginning was compared to a blank sample spiked at the end of the process, and the recovery was calculated. Recovery was performed only for the blood/DBS technique in order to know the performance of the chosen solvent extraction. It was not required to know the recovery value for the plasma technique as calibration curves were performed for blank matrix.
Matrix effect (%) was assessed by comparing the PHT signal obtained from plasma and blood, at concentrations of 0.44–44.25 µg ml−1, and 0.39–16.25 µg ml−1, respectively, injected directly in water against the PHT signal obtained at the same concentrations, and added to an extract drug-free matrix (blank extract). The overall precision of the matrix effect was expressed as CV. Matrix effect was evaluated for different lots in plasma (including normal, hemolysate and lipaemic plasma).
Influence of Hct
The blood volume within a given 5.0 mm disc may increase significantly when Hct levels fluctuate and, therefore, low Hct blood samples are spread more widely than those with normal and high Hct. 5 Normal Hct values in adult rabbits are between 31% and 40%. Rabbit blood with a value of 36.8% Hct was used as blank samples to validate and calibrate the method. Throughout the RBA study, Hct values (initial, medium and final times) were measured in all animals by micro-Hct method.
Blood spot volume
Different blood volumes spotted onto DBS card/paper might result in different analyte concentrations to be measured from a fixed spot size and Hct value. The spot homogeneity was verified by preparing low and high concentrations of PHT (0.81 and 20.32 µg ml−1 in blank rabbit blood with a 36.8% Hct value). Afterward, volumes of 10, 20, 30, 40 and 50 µl were spotted onto DBS cards. After drying, the centre of each DBS card was spotted and the sample was analysed. Bias and CV% were calculated with a maximum acceptable amount of 15% for all volumes.
Stability and storage
The long-term stability of the drug was evaluated at two concentrations (low and high) with three replicates over 30 days in plasma and 75 days in blood, under the following storage conditions: –20℃ for plasma, and 4℃ (refrigerated) and room temperature for blood, to ensure that samples were stable during shipping and storage prior to analysis.
Furthermore, the following stability tests for the plasma technique were also conducted: Short-term stability was proven by storing the samples for 6 h on the counter; autosampler stability was tested by leaving the samples in the injector for 8 h at room temperature. Also, freeze-thaw stability (after three cycles of subsequently freezing and thawing the enriched samples) was tested. All the tests were analysed in triplicate at two levels of concentration (low and high) (data not shown).
MS
Detection and quantitation were achieved by using a QTrap 5500 triple quadrupole mass spectrometer (AB Sciex) equipped with an electrospray ionisation source (ESI) interface, operating in negative and positive mode (switch system) and using the multiple reaction monitoring (MRM) mode. The following MS/MS transitions were monitored: m/z 251.1 > 102.0 as quantifier ion, m/z 251.1 > 208.0 as qualifier ion for PHT, and m/z 317.1 > 215.0 for CZP. Both Q1 and Q3 quadrupoles were set on unit resolution. The transitions were optimised by infusing a standard solution (1 µg ml−1) in mobile phase. Set values are as follows: desolvation temperature (℃), nebulizer gas (pounds per square inch (psi)), desolvation gas (psi) and entrance potential (V), were set at 300, 20, 5 and –14 (PHT) and 11 (CZP), respectively. Data were acquired and processed using ANALYST (version 1.6.2; ABSciex, Toronto, Canada).
The ultra-fast liquid chromatography (UFLC) system used was an LC-20AD (Shimadzu), which consists of a binary pump equipped with autosampler SIL-HTc 20AXR (Shimadzu). Chromatographic separation was performed with a Hypersil Gold C18 column (100 mm × 2.1 mm inner diameter (i.d.), 3.0 µm particle size) maintained at 40℃ and the injection volume was 10 μl. An isocratic mobile phase consisting of a mixture of MeCN and 3 mM ammonium acetate (50:50 v/v) at a flow rate of 0.3 ml/min−1 was used to separate the analyte. Total run time was 4 minutes. The autosampler was kept at room temperature.
PK and statistical analysis
The following PK parameters were calculated using the validated software Win Nonlin version 6.02 (Pharsight Corp., Mountain View, CA, USA): area under the curve from time zero to the last measurable PHT concentration (AUC0–t), using the linear trapezoidal rule; (AUC0–∞), calculated as the sum of AUC0–t plus Clast/ke (where Clast is the last measurable concentration, and ke is the terminal rate constant of elimination); maximum measured concentration of PHT (Cmax); time to maximum plasma or blood concentration (Tmax); and terminal elimination half-life (T1/2). In order to find correlations between both matrices (plasma-blood) and between both experimental designs (classic-block), blood concentrations (Cblood) and plasma concentrations (Cplasma) were determined by the respective techniques and they were directly compared through the following parameters obtained: Cmax, Tmax and AUC0–t.
Results
Analytical method validation
Calibration curves were linear in the ranges 0.20–50.80 µg ml−1 and 0.12–20.32 µg ml−1 with correlation coefficient values of r > 0.999 for the plasma and blood matrix. Retention times for PHT and IS were 1.85 minutes and 2.05 minutes, respectively. Specificity was assessed in six different batches of plasma and blood samples by analysing blank and spiked samples at LOQ levels. No significant chromatographic signals of endogenous PHT were observed neither for plasma nor for blood batches at the target analyte retention times (PHT and IS). LOQ levels were 0.20 µg ml−1 and 0.12 µg ml−1 for plasma and blood/DBS, respectively.
Intra-day and inter-day accuracy and precision a .
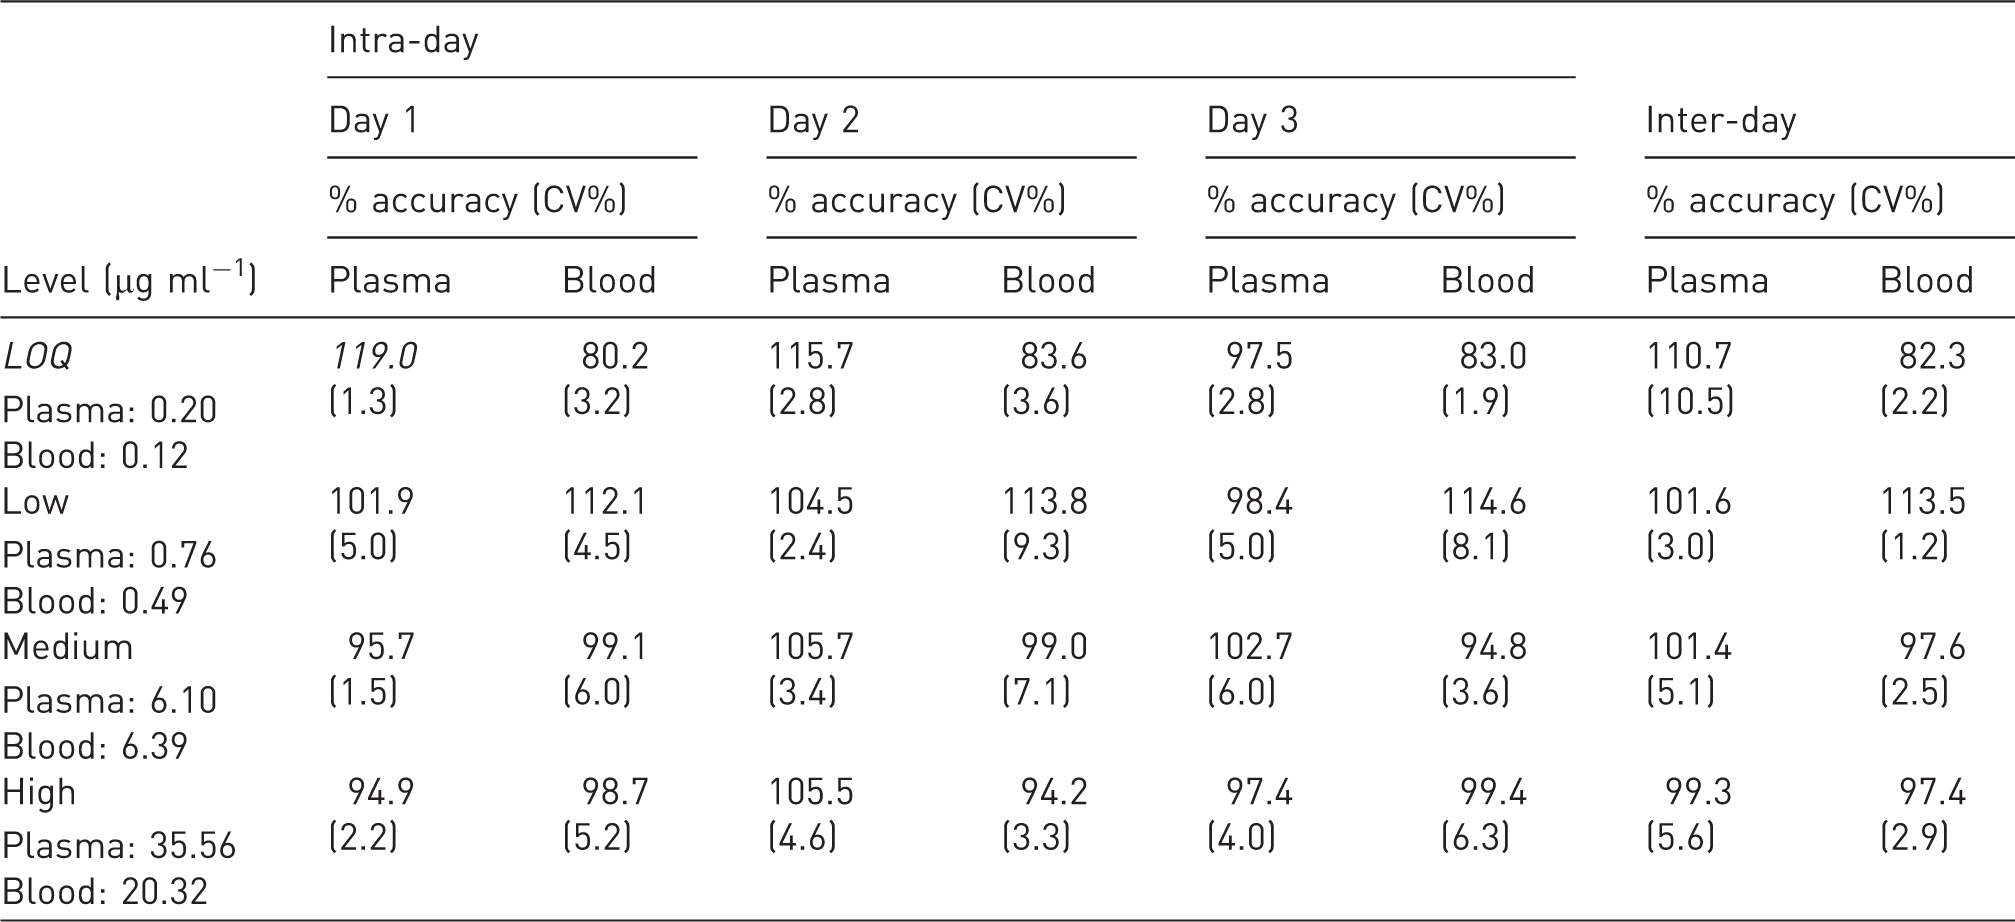
CV%: precision expressed as coefficient of variation (SD/mean result) 1 × 100. LOQ: limit of quantification.
Influence of the rabbit blood spotted volume on DBS paper (n = 3 replicates).
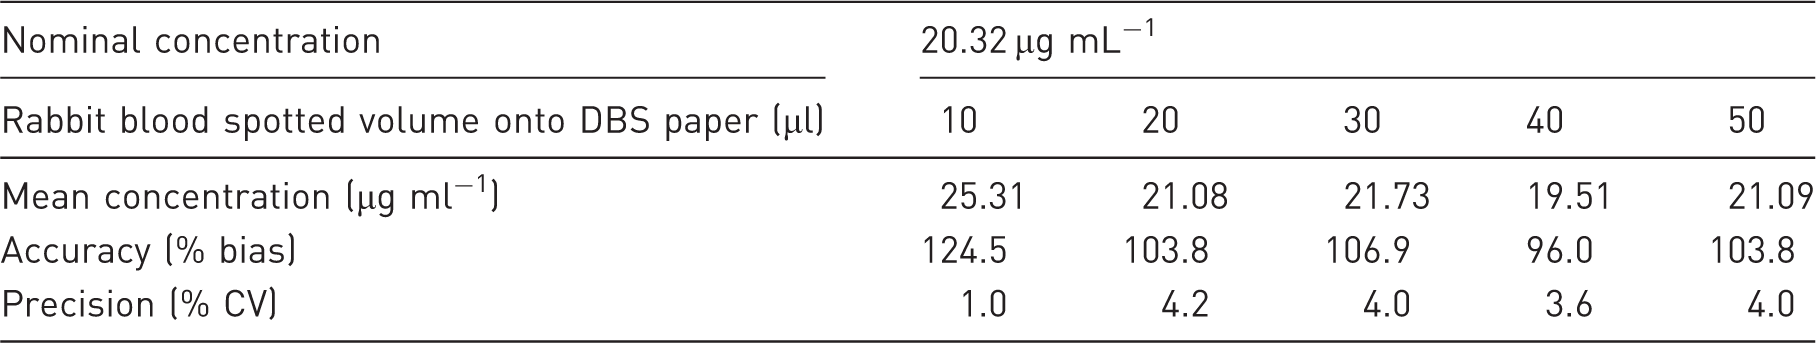
DBS: dried blood spot.
The solvent extraction for the blood/DBS technique was performed based on visual observation and recovery percentages. MeOH was chosen as the extraction solvent.
Recovery values for blood/DBS technique were 98.9% and 108.2% for low and high levels of concentration, respectively, and CV (%) was <12.0% for all cases. Matrix effect (%) calculated was minimal both for plasma (<6.0%, CV% 6.2) and blood/DBS techniques (< 1% with CV% 4.6).
PHT long term stability in plasma and blood/DBS at different temperatures and concentration (n = 3). Table shows accuracy (%) and CV (%) between brackets.
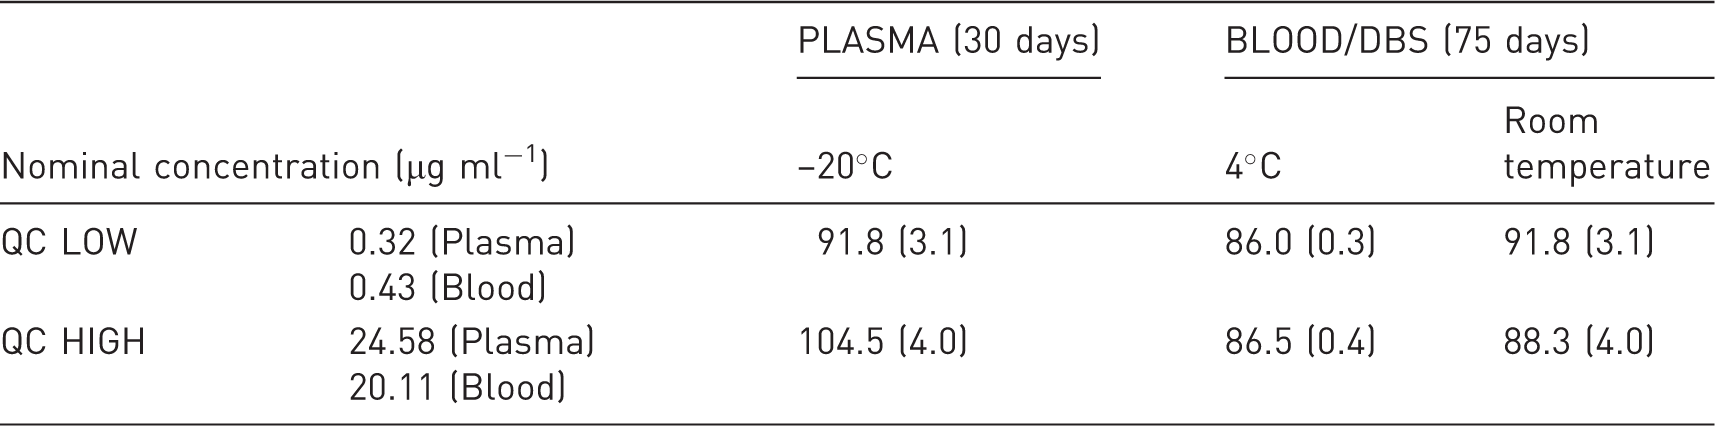
Stability was performed at different temperatures and concentration (n = 3). Table shows accuracy (%) and CV (%) between brackets respectively.
CV%: precision expressed as coefficient of variation (SD/mean result) 1 × 100. DBS: dried blood spot; QC: quality control.
Hct values for RBA study were within normal ranges for adult rabbits.
Techniques comparison (plasma vs blood/DBS).
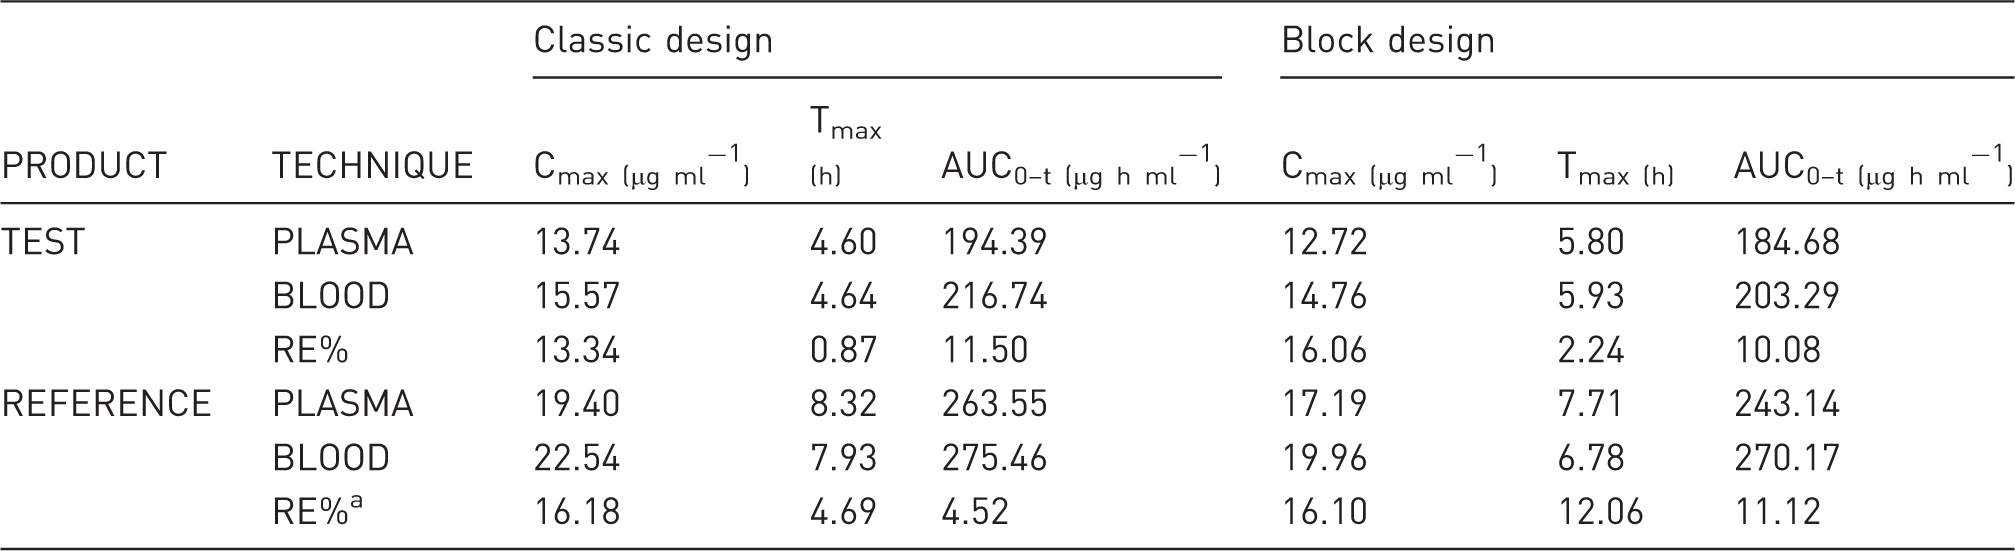
RE%: difference, in absolute value, between the value obtained from the blood matrix and the value obtained from the plasma matrix, with respect to the value obtained from the plasma matrix, expressed as a percentage.
DBS: dried blood spot; Cmax: maximum measured concentration of phenytoin; Tmax: time to maximum plasma or blood concentration; h: hours; AUC0–t: area under the curve from time zero to the last measurable phenytoin concentration.
Classic/block design comparison for plasma and blood/DBS techniques.
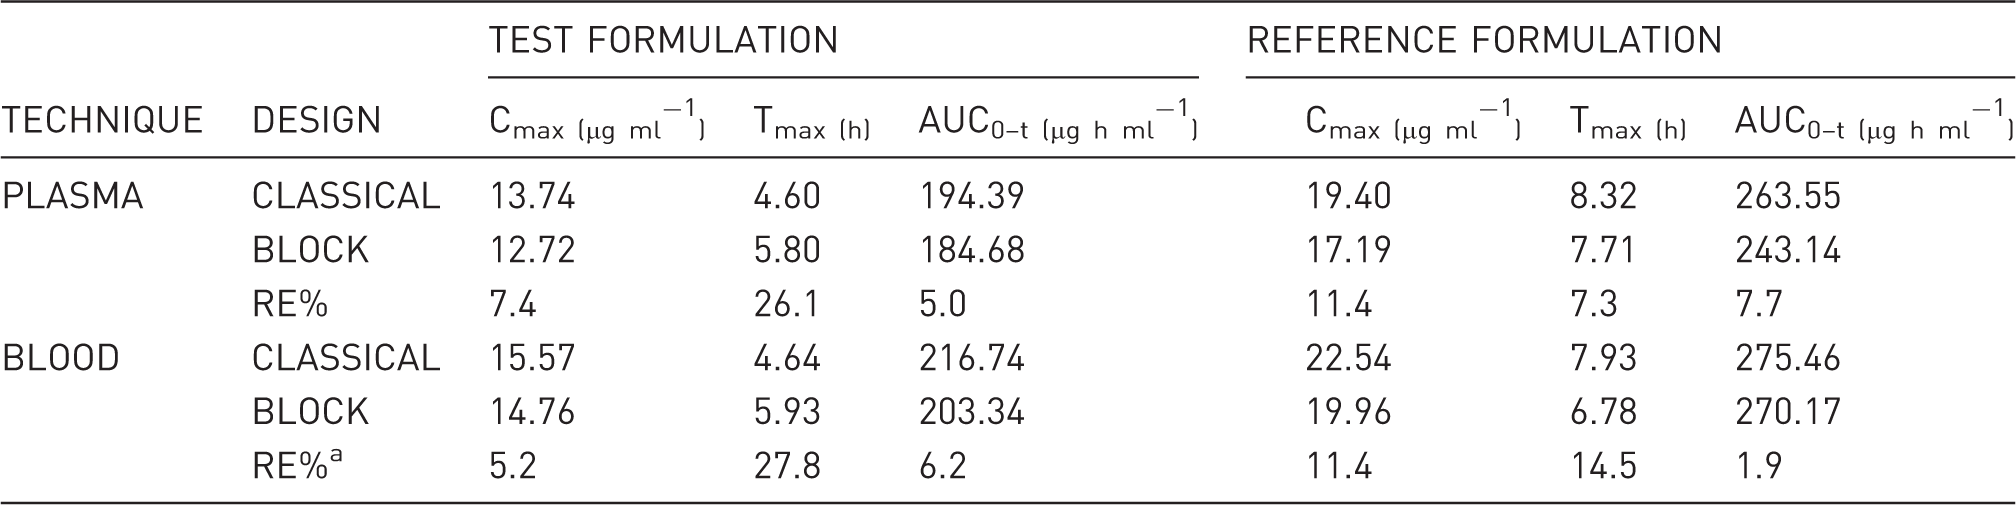
RE%: difference, in absolute value, between the value obtained from the block experimental design and the value obtained from the classic experimental design, with respect to the value obtained from the classic design, expressed as a percentage.
DBS: dried blood spot; Cmax: maximum measured concentration of phenytoin; Tmax: time to maximum plasma or blood concentration; h: hours; AUC0–t: area under the curve from time zero to the last measurable phenytoin concentration.
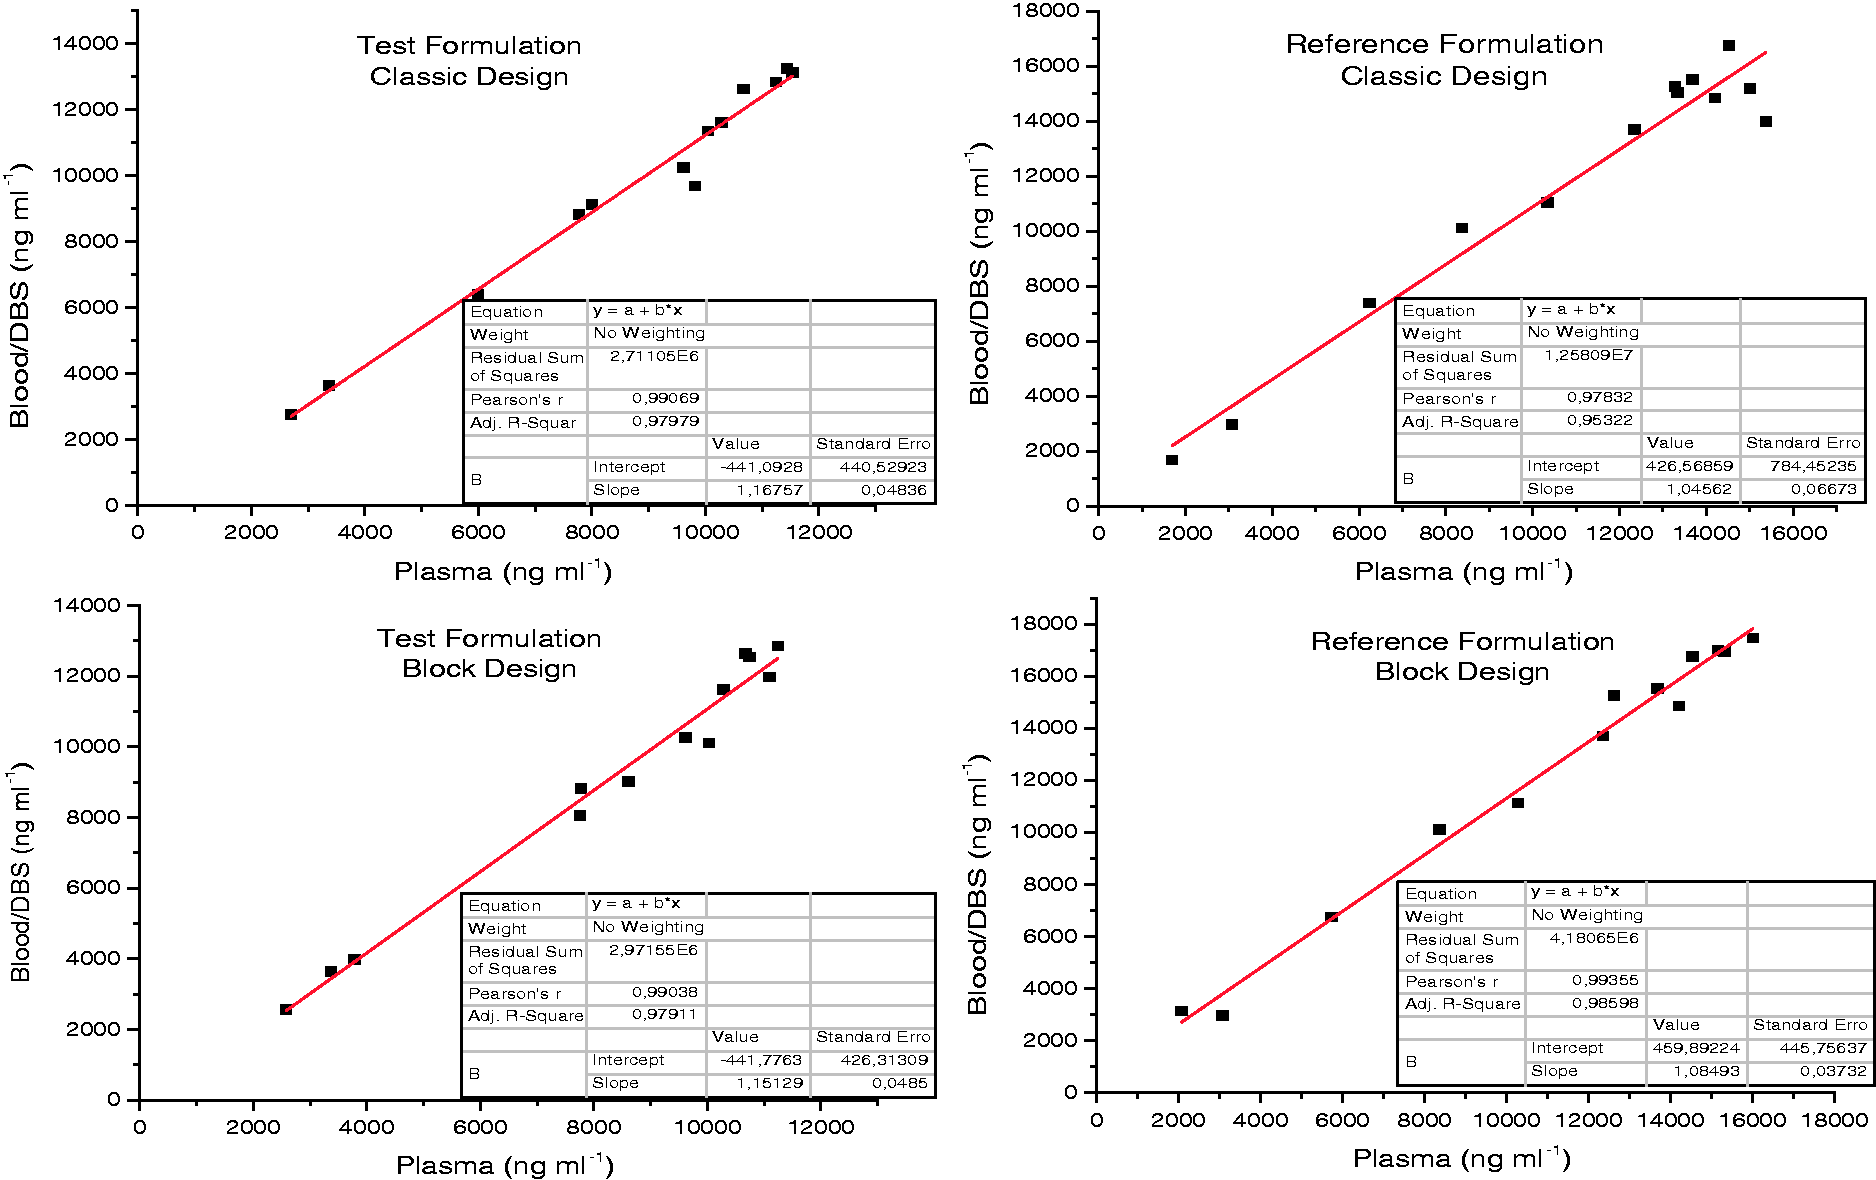
Linear correlation between PHT levels from blood/DBS and corresponding plasma samples. (a) Test formulation, classic design for RBA study. (b) Reference formulation, classic design for RBA study. (c) Test formulation, block design for RBA study. (d) Reference formulation, block design for RBA study.
An r > 0.975 was observed for all cases.
Discussion
All values shown in Table 1 were well within internationally recognised acceptance criteria for assay validation15–17 and were within the pre-defined limits required for the spiked value (within 15%), except for LOQ, which should not deviate by more than 20%.
In order to achieve the homogeneity of drug distribution on DBS cards and to minimise the chromatographic effect, it is recommended to spot a maximum volume of 30 μl of blood on filter paper. 19 It allows spotting again in case reanalysis is required. In addition, 30 μl is similar to the volume of a real drop of blood.
Extraction solvents with aqueous content showed dirty extracts due to the dissolution of red cells and other endogenous compounds from the DBS, resulting in potential matrix effect. 5 The cleanest extracts were shown by MeCN and MeOH. However, MeOH was chosen because it showed high recovery values. Recovery for plasma technique is not required as calibration curves were performed in matrix as the samples tested, so in this way the value of plasma analyte is independent of the recovery value.
Table 3 shows that PHT is stable for both matrices. For the blood/DBS technique, stability differences of PHT were not observed for refrigerator or room temperature.
Regarding plasma vs blood/DBS correlation, the low RE% of PK parameters between both techniques shown in Table 4 indicate highly comparable results. Regarding Table 5, low RE% between both experimental designs were observed, except for Tmax, possibly due to the block design, from which fewer sampling data per animal were obtained, and because the Tmax parameter was very sensitive. The correlation plots shown in Figure 1 indicate that plasma concentration can be estimated confidently from blood/DBS measurements. In order to estimate plasma drug levels, blood/DBS study data were related to plasma study data (in its respective time), which made it possible to arrive at the following ratio: (PHT blood) = 1.158 (PHT plasma). These results are in agreement with those published by Kong et al., 20 who indicated that PHT was readily partitioned and dissociated from red blood cells, with blood-plasma concentrations similar to those herein reported.
Conclusion
A simple and rapid method to determine PHT in rabbits has been developed by applying plasma and blood/DBS techniques and LC-MS/MS technology. The method was validated and complied with the most recent regulatory guidelines and showed to be accurate, precise and robust. A correlation between Cplasma estimated from Cblood levels was observed, which emphasises whole blood as an alternative to conventional plasma samples matrix. Blood/DBS technique herein described showed results comparable to those of classic technique, with easier sample collection and avoiding the use of cannulated animals to obtain more blood volume or with no need for anticoagulant. Furthermore, our results encourage working with a classic experimental design and blood/DBS sampling, which do not require a large number of animals or animal euthanasia.
Finally, the combination of blood/DBS sampling with LC-MS/MS technology showed to be an excellent tool to apply not only for therapeutic drug monitoring but also for RBA studies.
Footnotes
Acknowledgement
The authors thank the Consejo Nacional de Investigaciones Científicas y Técnicas (CONICET) for co-supporting together with DominguezLab S.A. the doctoral fellowship.
Declaration of Conflicting Interests
The author(s) declared no potential conflicts of interest with respect to the research, authorship, and/or publication of this article.
Funding
The author(s) received no financial support for the research, authorship, and/or publication of this article.