
Abstract
Various types of restraint collars have been used for research animals, and the Elizabethan collar (E-collar) is the most commonly used. However, animals can be choked by the E-collar or they tend to remove it; furthermore, repeated rubbing and scratching of the collar may chafe the neck. We developed a new restraint collar with a vest to overcome these limitations. The vest-collar (V-collar) can be worn similarly to a vest, in contrast to the E-collar, which is fixed around the neck. A cone-shaped collar is attached to the vest in the V-collar and is made of Eva foam to surround the chest softly, accompanied by a transparent polyvinyl chloride (PVC) film for visibility. To evaluate the performance of the V-collar, we conducted experiments with mice wearing the V-collar and the E-collar. Both groups showed normal weight gain and food intake. Glucose and stress hormone levels showed no significant differences, and no stress-associated leukocyte profiles were observed during the experiments. However, despite the short experimental duration, more than half of the mice in the E-collar group showed injury to the skin on the neck, with increased thickness of the epidermal and keratin layers. Moreover, inflammatory cell counts were higher in the E-collar group than in the V-collar group. In conclusion, the V-collar, in contrast to the E-collar, does not cause skin injuries in animals and is thus beneficial for animals and investigators. Investigators can effectively use the V-collar to enhance laboratory animal welfare.
Investigators are occasionally required to prevent certain animal behaviours during experiments, such as coprophagy, self-grooming, self-injury, licking of test compounds or post-surgical sites and removal of catheters, plasters and bandages.1,2 Infection of wounds and post-surgical sites is common, and test compounds are often removed by continuous grooming. 3 To prevent such events from occurring, investigators use various restraint collars for experimental animals. 4 Restraint collars are also called neck collars, safety collars or vet-collars. The most common restraint collar is the Elizabethan collar (E-collar). 1 Selection of a restraint collar appropriate for the species, size and purpose is necessary to maximize the comfort of animals. If the collar is of an unsuitable size, animals can choke or they can remove the collar. In particular, placement and maintenance of the E-collar on rodents such as mice, rats, hamsters and guinea pigs are difficult because these animals have relatively short necks with small and conical heads. 2 Although several investigators have reported that experimental animals adapt well to the E-collar and can eat, drink and sleep normally; by just wearing the E-collar it can induce potential stress. 1 Veterinarians have suggested that the E-collar should be immediately removed on completion of an experiment. 5
Conventional E-collars are made of a rigid plastic forming a thin attachment rim, which can chafe the animal’s neck region through repeated rubbing. Investigators have designed different types of E-collars to solve this problem.1,2,6–12 A better collar would be softer on the neck region, while providing firm restriction from licking or scratching. We developed a new restraint collar with a vest to fulfil these requirements. The vest-collar (V-collar) restrains animals through the vest and prevents skin chafing by dispersing the contact region between the collar and the animal skin. Therefore, it can decrease stress and provide greater animal comfort during experiments.
In this study, our newly designed V-collar was compared with a commercially available E-collar in experimental mice. The body weight, food intake, non-fasting blood glucose, plasma corticosterone levels, and white blood cell (WBC) counts of mice wearing one of these collars were measured for 14 days to evaluate the feasibility of the V-collar.13–15 Additionally, on day 14, we performed histopathological analyses of skin obtained from the anterior neck and chest regions of the mice to evaluate the degree of tissue damage on the skin of the animals. 16
Animals
Seven-week-old male ICR mice (30–35 g) were purchased from Nara Biotech (Seoul, Korea). Twenty-four mice were divided randomly into the control, E-collar and V-collar groups. The number of mice in each group was eight. The animals were housed singly to measure food intake of each mouse in a home cage (mouse mini cage; Jeung Do Bio & Plant Co, Seoul, Korea) under a 12:12 h light/dark cycle with artificial light (50 lux in the cage) from 08:00 to 20:00 h. This mouse mini cage was 143 × 256 × 127 mm3 in size with a floor area of 220 × 104 mm2 and composed of a transparent polypropylene body and stainless steel wire mesh and lid to provide adequate space for singly-housed mice. The cage provided the required space for a singly-housed stock mouse as described in the guidelines for minimum cage size. 17 The mice were fed with irradiated pellet food (Teklad; Harlan, Madison, WI, USA) ad libitum and had free access to sterilized drinking water. The temperature was 22.5–24 ℃ and the humidity was 50–60%. The mice were allowed to acclimatize for at least one week prior to the experiments. Euthanasia was carried out using carbon dioxide. All animal care and handling were in accordance with the institutional guidelines of the Animal Care and Use Committee at the Korea Institute of Science and Technology (2014-058).
Materials and methods
V-collar design
The V-collar comprises a cone and a vest (Figure 1). Because a heavy collar would be a burden on the animal, the materials for the components are selected from light and resilient polymeric sheets. The cone is made of a transparent polyvinyl chloride (PVC) sheet to provide visibility. The sheet is cut into a horseshoe shape and bent to form the cone. The ends of the cone are laid to overlap each other and attached using double-sided tape. Various fabric types have been considered to form the vest, including felt. We chose to use an Eva foam sheet in the final design because it was easy to cut, soft and flexible. The vest was shaped like an arc attached to a double torus. It had two holes to accommodate the upper arms, and the soft bottom part of the double torus supported the abdomen area. This vest was designed to minimize the area of contact with the animal’s body and provide adequate ventilation. Three release incisions were placed on the arc of the vest to contour the arc and to accommodate the shape of the cone to be attached. The vest was bent to close the arcs with a stapler or an adhesive tape. Double-sided tape was applied to the edge of the arc and bent around the smaller circle of the cone to attach the cone and the vest together. To place the final assembly on the animal, the vest was set bottom-side-down on the table. The head of the animal was placed in the vest. The entire body of the animal was pushed until the head was placed in the smaller circle of the cone. Then, the forelimbs were pulled through the two holes in the vest. The V-collar was closed on the back of the animal using Velcro or buttons, and it could be adjusted according to the body size. The collar was placed on the animal rapidly under anaesthesia with isoflurane to reduce stress.
Planar (a), partially assembled (b) and completely assembled (c) vest-collar (V-collar). Mice wearing a V-collar (d) and an Elizabethan collar (E-collar) (e).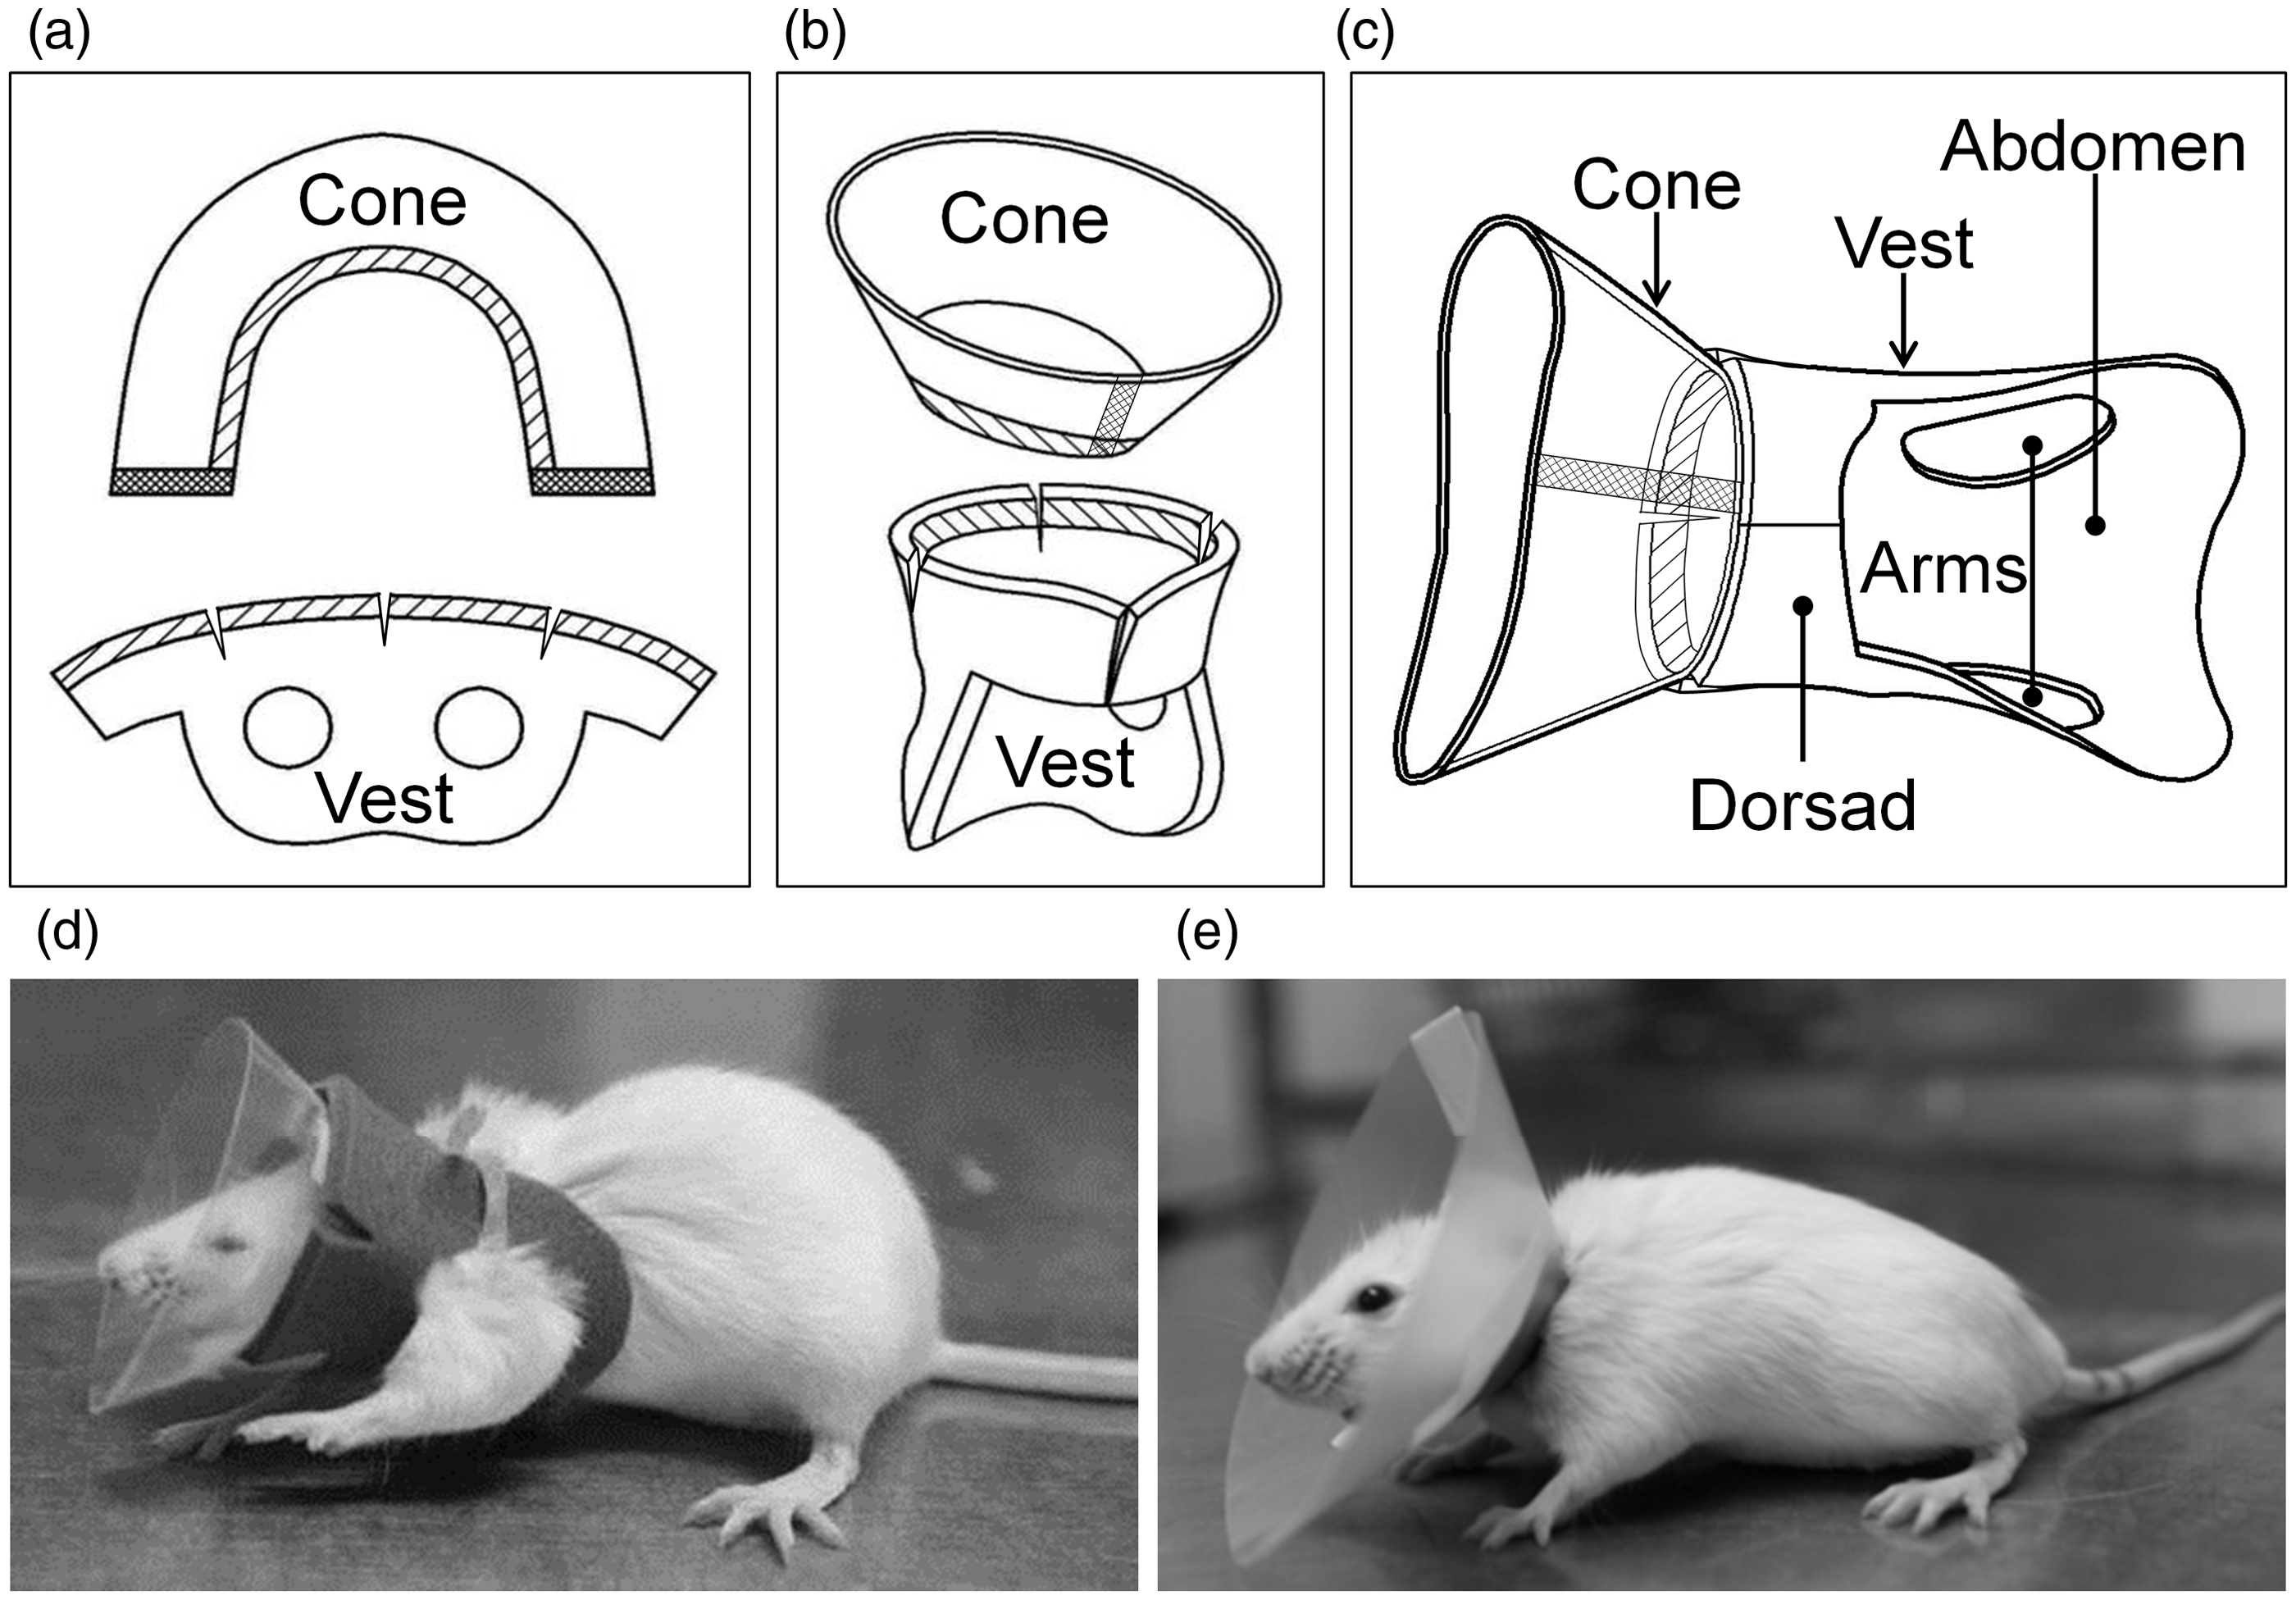
Body weight and food intake
The body weights and amount of food consumed were measured using a digital balance every day for 14 days. The E-collar and V-collar were removed from the mice for self-grooming once a day for one hour. In order to reduce stress the pellet fragments and eye mucus could be removed from their face and the faeces and urine could be removed from their body.3,5 A wire mesh was placed at the bottom of each cage to measure the food intake accurately. The wire mesh could also prevent the pellet and faeces from entering into the collars and contaminating the animal’s body. A mat and paper towel were spread under the wire mesh in each cage for the absorption of urine and drinking water. The mat and paper towel could also prevent the absorption of water from the pellet fragments. Unconsumed food remaining in the cage was weighed using the digital balance to calculate the amount of ingested food. Then, each mouse was provided again with new feed. The cages and wire meshes were cleaned daily. 13
Blood collection and sample analysis
Blood samples were collected from the right subclavian vein using a one-millilitre syringe containing heparin with a 26-gauge needle under anaesthesia with isoflurane on days 1, 3, 7, and 14. Non-fasting blood glucose levels were measured using Accu-Chek test strips (Roche Diagnostics, Basel, Switzerland), 18 whereas stress hormone levels were measured using the Corticosterone EIA kit (Enzo Life Science, Farmingdale, NY, USA) according to the manufacturer’s instructions. 19 Plasma samples were obtained by centrifugation of the collected blood at 10,000 rpm for 5 min at 25 ℃. Plasma stress hormones were extracted using ethyl acetate, and the solvents were removed by evaporation under nitrogen gas. The samples were maintained at −70 ℃ until further analysis. The total white blood cell (WBC) count was determined using an auto-haematology analyser (PE-6800; Prokan Electronics Inc, Shenzhen, China). The blood samples were transferred into tubes with K2EDTA (BD, Franklin Lakes, NJ, USA) and analysed. Blood smears from the rest of the blood samples were prepared for differential staining using the Diff-Quik staining kit (Merck, Darmstadt, Germany). WBC counting (lymphocytes, neutrophils, eosinophils and monocytes) was performed by the researcher with a veterinary expert in a blind check under the advice of an objective clinical veterinary pathologist, by the differential blood count method as described in a previous article. 20
Histopathology
On the final day of the study (day 14), all mice were sacrificed by cardiac puncture under anaesthesia with isoflurane, and sections of the skin from the anterior neck and chest regions were prepared for histopathology. The skin tissues were placed in cassettes and fixed in 10% formalin. Each sample was further processed using standard methods and embedded in paraffin. 16 The prepared sections (4 µm thick) were stained with haematoxylin (Sigma–Aldrich, St Louis, MO, USA) and eosin (BBC Biochemical, Mt Vernon, WA, USA) (H&E). Tissue slides were evaluated by light microscopy at 100 × and 400× magnification. One microphotograph per mouse at 100× magnification and five microphotographs per mouse at 400× magnification were obtained. The thickness of the epidermal layer (in micrometres) was calculated from the mean of 10 values per microphotograph at 100× magnification. The number of inflammatory cells was obtained by counting cells at 400× magnification. 21 Histopathology on macroscopic and microscopic examinations was blindly performed by an objective veterinary pathologist.
Statistical analysis
All data are expressed as mean ± standard deviation. Statistical analyses were performed using GraphPad Prism 5.0 software (GraphPad Software Inc, San Diego, CA, USA). A two-tailed Student’s unpaired t-test was used to compare the baseline values of all study parameters. One-way analysis of variance (ANOVA) was followed by Tukey’s multiple comparison test for between-group comparisons. If the data did not show a normal distribution, between-group comparisons were performed using the Mann–Whitney test. P < 0.05 was considered statistically significant.
Results
The food and water intake of mice were quantified empirically everyday while wearing the collars. Subjective assessment showed that the E-collar and V-collar groups did not cause problems such as ocular, facial swelling and chafing of the animal’s neck. These findings were observed by the naked eye of two researchers in a blind check before the end of the experiment.
Body weight and food intake
The results of body weight and food intake measurements are shown in Figure 2. After the collars were placed on the mice for one day, the body weights of the animals in the control, E-collar, and V-collar groups were 33.05 ± 1.01, 32.19 ± 1.13, and 32.23 ± 1.29 g, respectively, with no significant differences on day 1 (Figure 2a). The body weights in all groups showed a statistically significant increase over two weeks. Tukey’s multiple comparison test showed that the body weights in the V-collar group were significantly different from those in the E-collar and control groups on days 10, 11, 12 and 14 and on days 11 and 14 (P < 0.05), respectively. To compare the pattern of weight gain among the three groups, the increases in body weights were plotted in Figure 2b. Tukey’s multiple comparison test showed that the weight gains in the V-collar group were significantly different from those in the E-collar group on days 6, 11, 12 and 14 (P < 0.05). The weight gains were similar in the V-collar and control groups, and were about 30–50% higher in the E-collar group.
Body weights (a), weight gains (b) and food intake measurements (c) for male ICR mice (n = 8) in the control, E-collar and V-collar groups for a period of 14 days (left panels) and at day 14 (right panels) (#: between the E-collar and V-collar groups; †: between the V-collar and control groups; *: between the E-collar and control groups by Tukey’s multiple comparison; P < 0.05).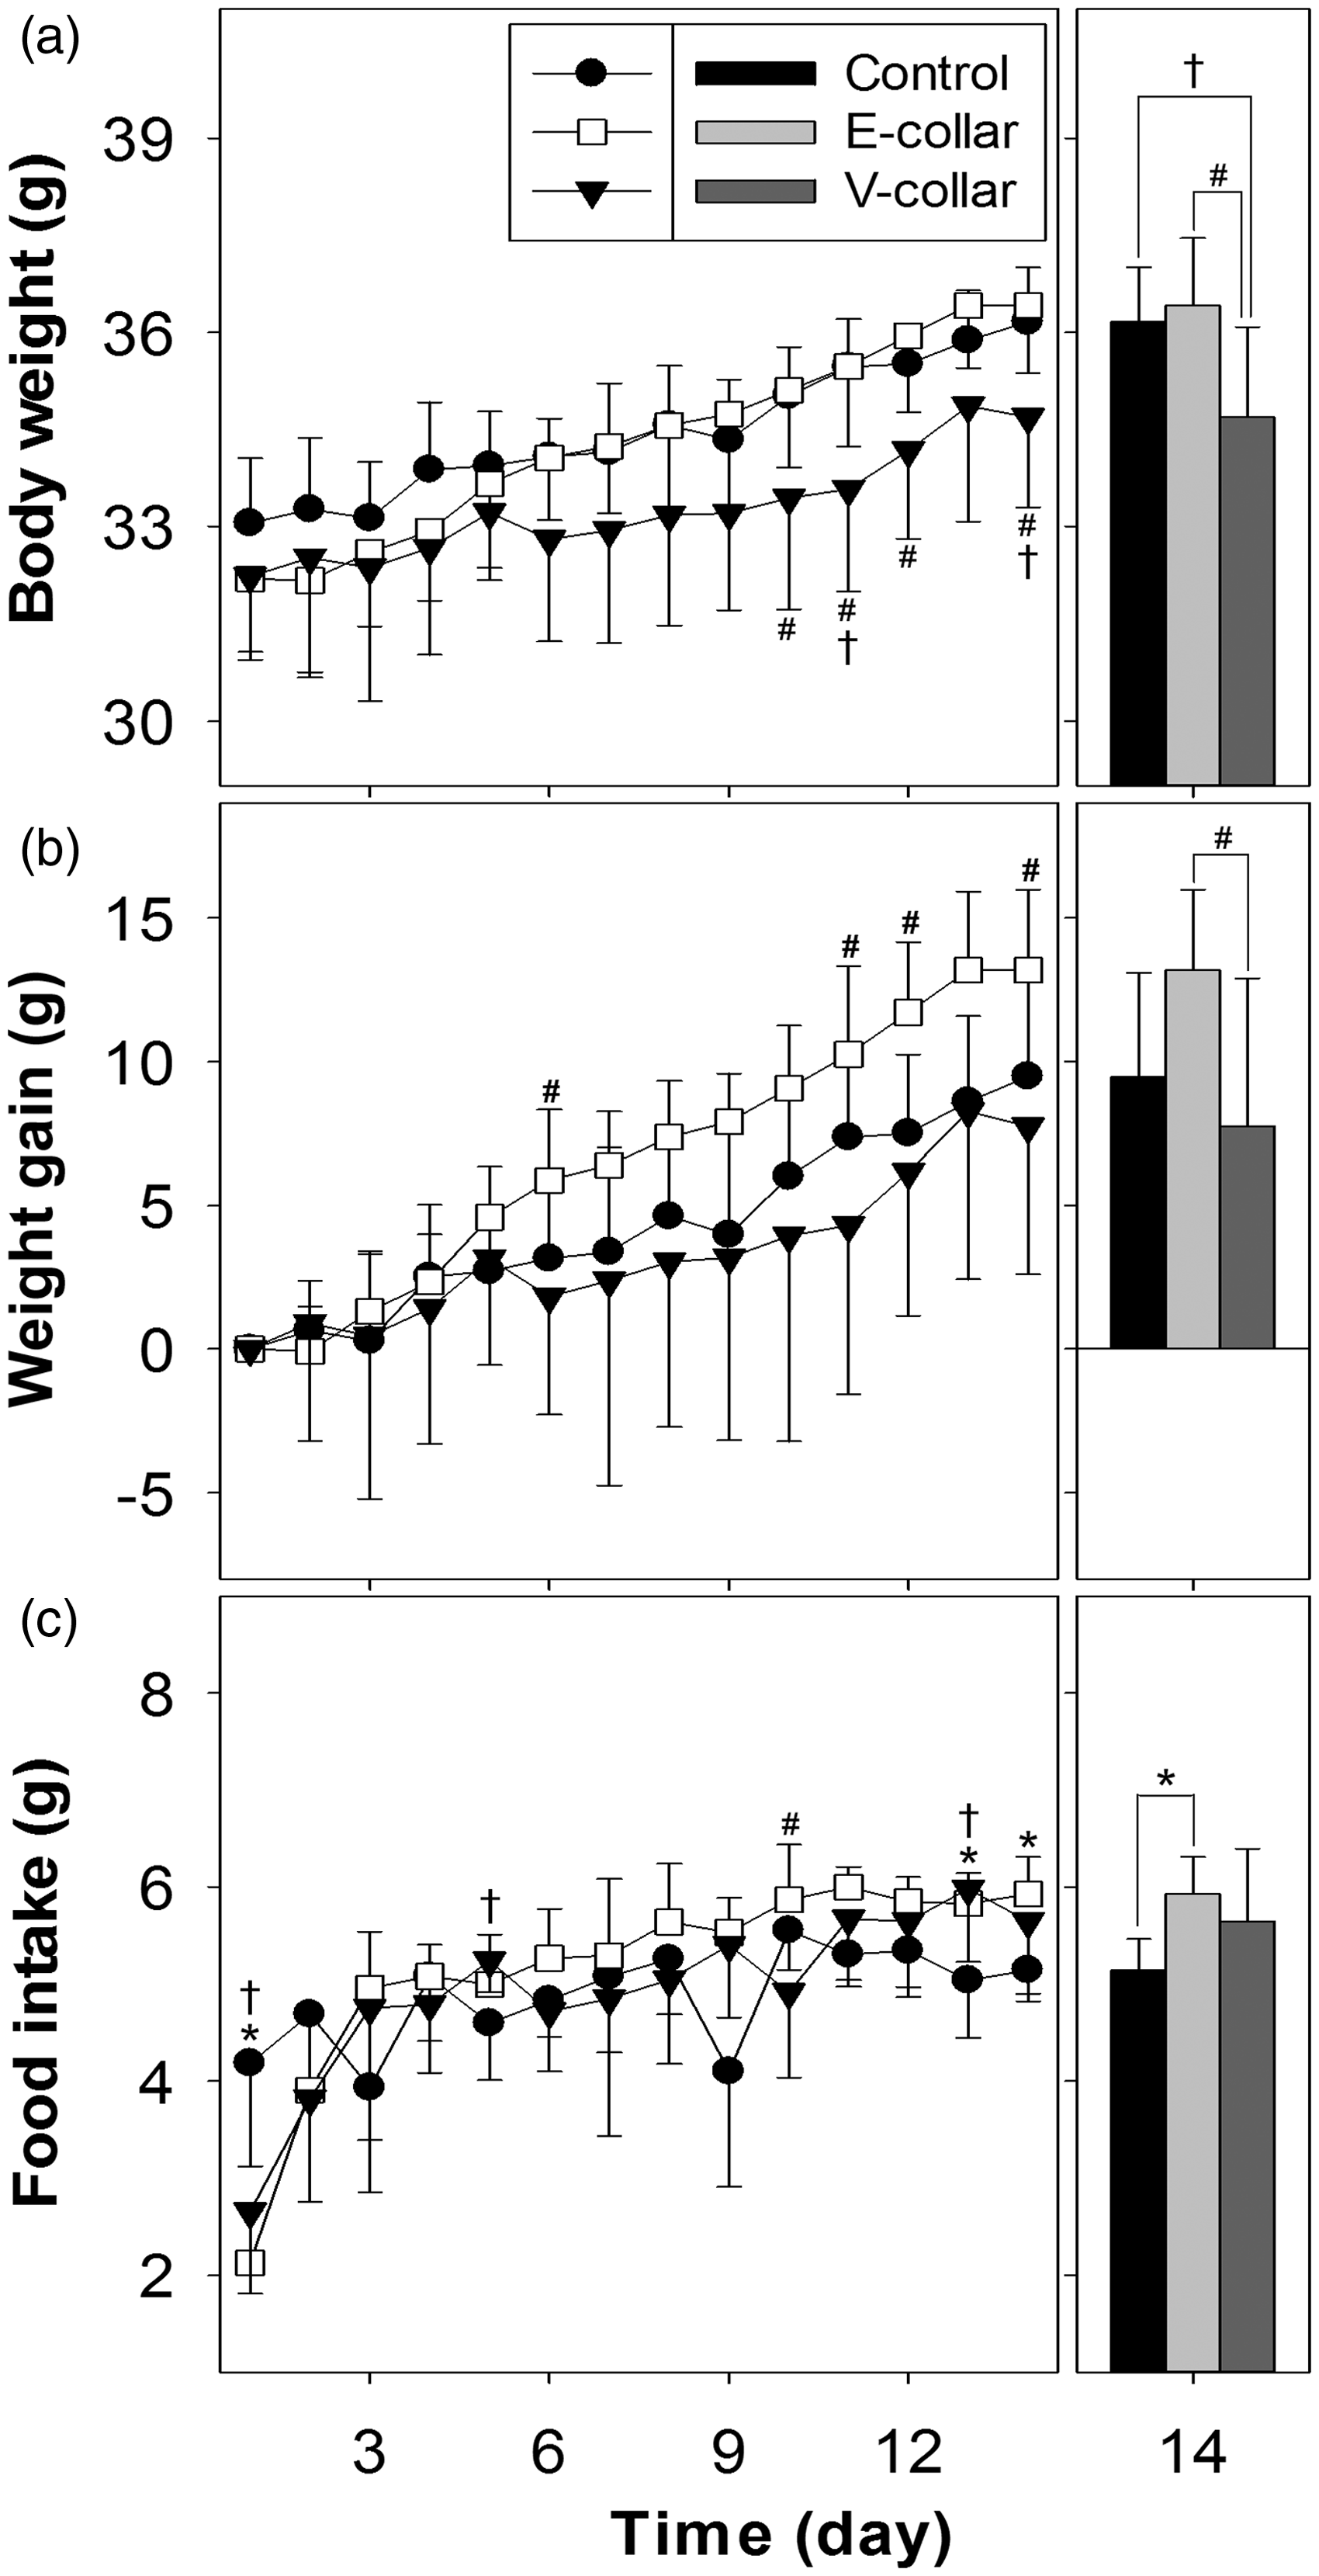
Tukey’s multiple comparison showed that the food intakes in the V-collar group were significantly different from those in the E-collar and control groups on day 10 and on days 1, 5 and 13, respectively, and those in the E-collar group were significantly different from those in the control group on days 1, 13 and 14 (P < 0.05). The food intakes in the E-collar and V-collar groups returned to normal from day 2. The total quantities of food intake in the control, E-collar and V-collar groups were 67.78 ± 4.65, 71.97 ± 4.96, and 68.56 ± 4.84 g, respectively, over 14 days (data not shown), with no significant differences among groups as determined by ANOVA.
Glucose levels
The non-fasting blood glucose concentrations at each time point are presented in Figure 3a. On the first day after wearing the collars, the concentrations in the control, E-collar, and V-collar groups were 167.3 ± 15.8, 184.9 ± 29.0, and 173.1 ± 28.2 mg/dL, respectively; whereas they were 188.8 ± 19.5, 183.6 ± 16.5, and 186.4 ± 23.8 mg/dL, respectively, on day 3; 187.6 ± 23.2, 180.1 ± 18.4, and 177.3 ± 37.1 mg/dL, respectively, on day 7; and 178.5 ± 26.6, 177.8 ± 18.9, and 164.5 ± 16.3 mg/dL, respectively, on day 14. One-way ANOVA showed no significant differences among the three groups on any day.
Non-fasting blood glucose (a) and plasma corticosterone (b) levels for male ICR mice in the control, E-collar and V-collar groups (n = 8).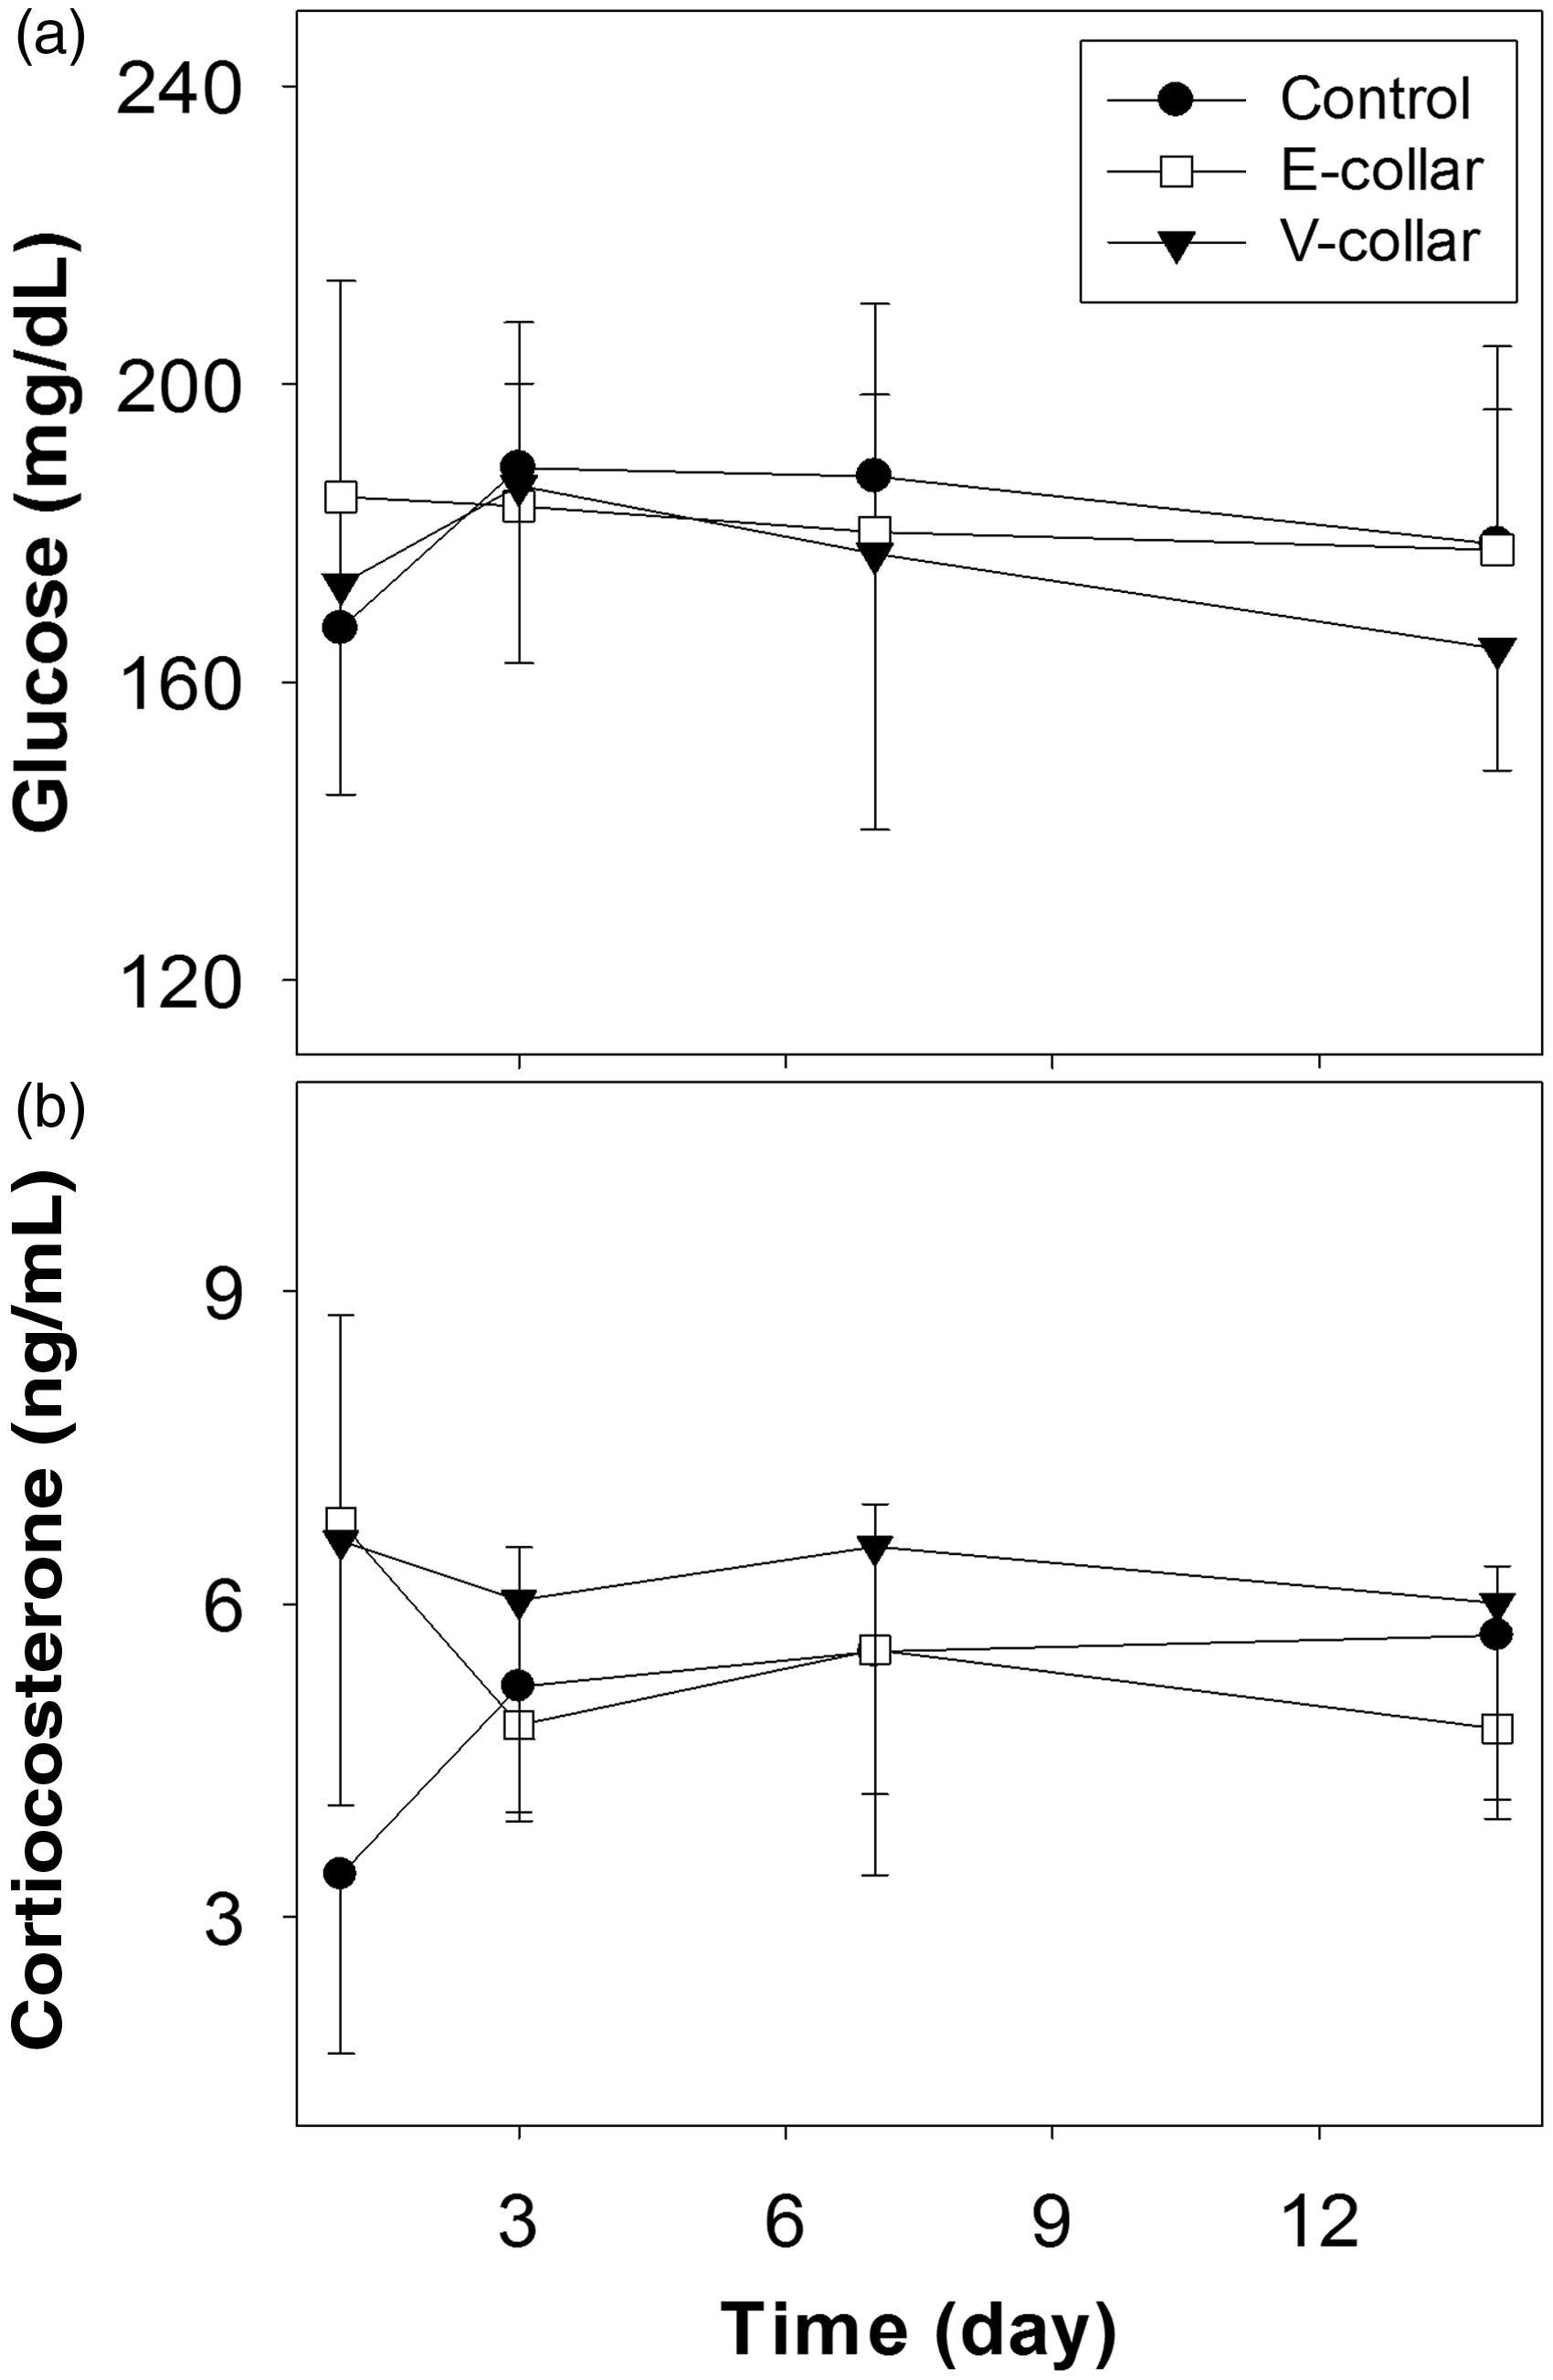
Plasma corticosterone levels
The plasma corticosterone levels at each time point are shown in Figure 3b. The levels in the control, E-collar, and V-collar groups were 3.41 ± 1.72, 6.78 ± 1.99, and 6.61 ± 2.53 ng/mL, respectively, on day 1; 5.21 ± 1.20, 4.84 ± 1.70, and 6.04 ± 2.12 ng/mL, respectively, on day 3; 5.55 ± 2.14, 5.56 ± 1.40, and 6.55 ± 2.37 ng/mL, respectively, on day 7; and 5.70 ± 1.57, 4.81 ± 1.56, and 6.01 ± 2.07 ng/mL, respectively, on day 14. Statistical analysis using the Mann–Whitney U-test indicated no significant differences among the three groups at each time point.22,23
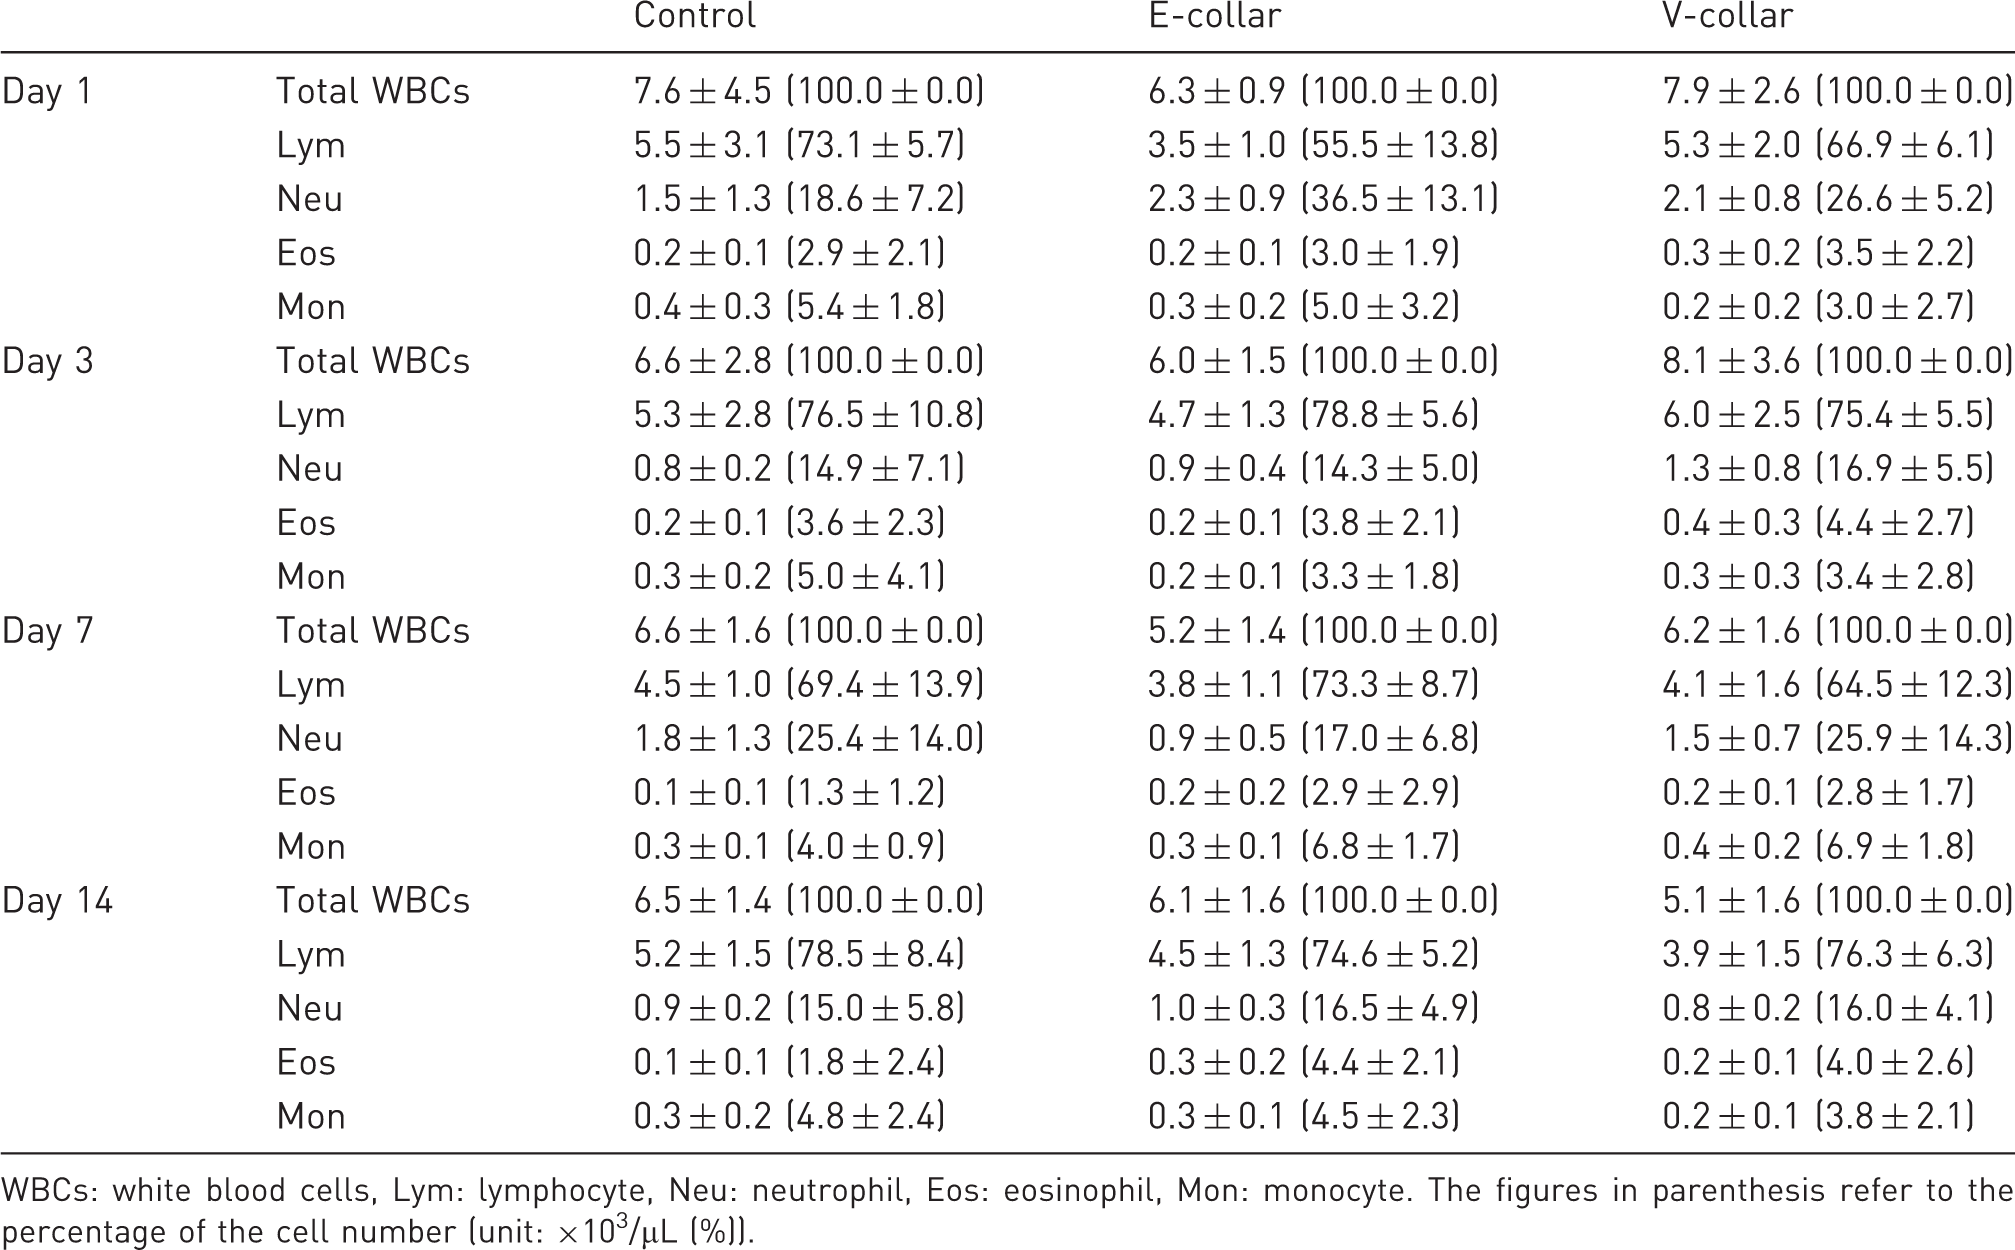
WBC counts
The WBC counts at each time point are shown in Figure 4. The left and right panels indicate the cell counts and percentage counts for each type. The Mann–Whitney U-test showed no significant differences at each time point among the three groups (Table 1). Moreover, the WBC counts were within the reference range, and they did not indicate a stress leukocyte profile until the last day.
24
White blood cell (WBC) counts for male ICR mice in the control, E-collar and V-collar groups. The left and the right panels represent the cell counts and the percentage count of each cell type, respectively (n = 8). Haematological data obtained for male ICR mice in the control, E-collar and V-collar groups (n = 8). WBCs: white blood cells, Lym: lymphocyte, Neu: neutrophil, Eos: eosinophil, Mon: monocyte. The figures in parenthesis refer to the percentage of the cell number (unit: ×103/µL (%)).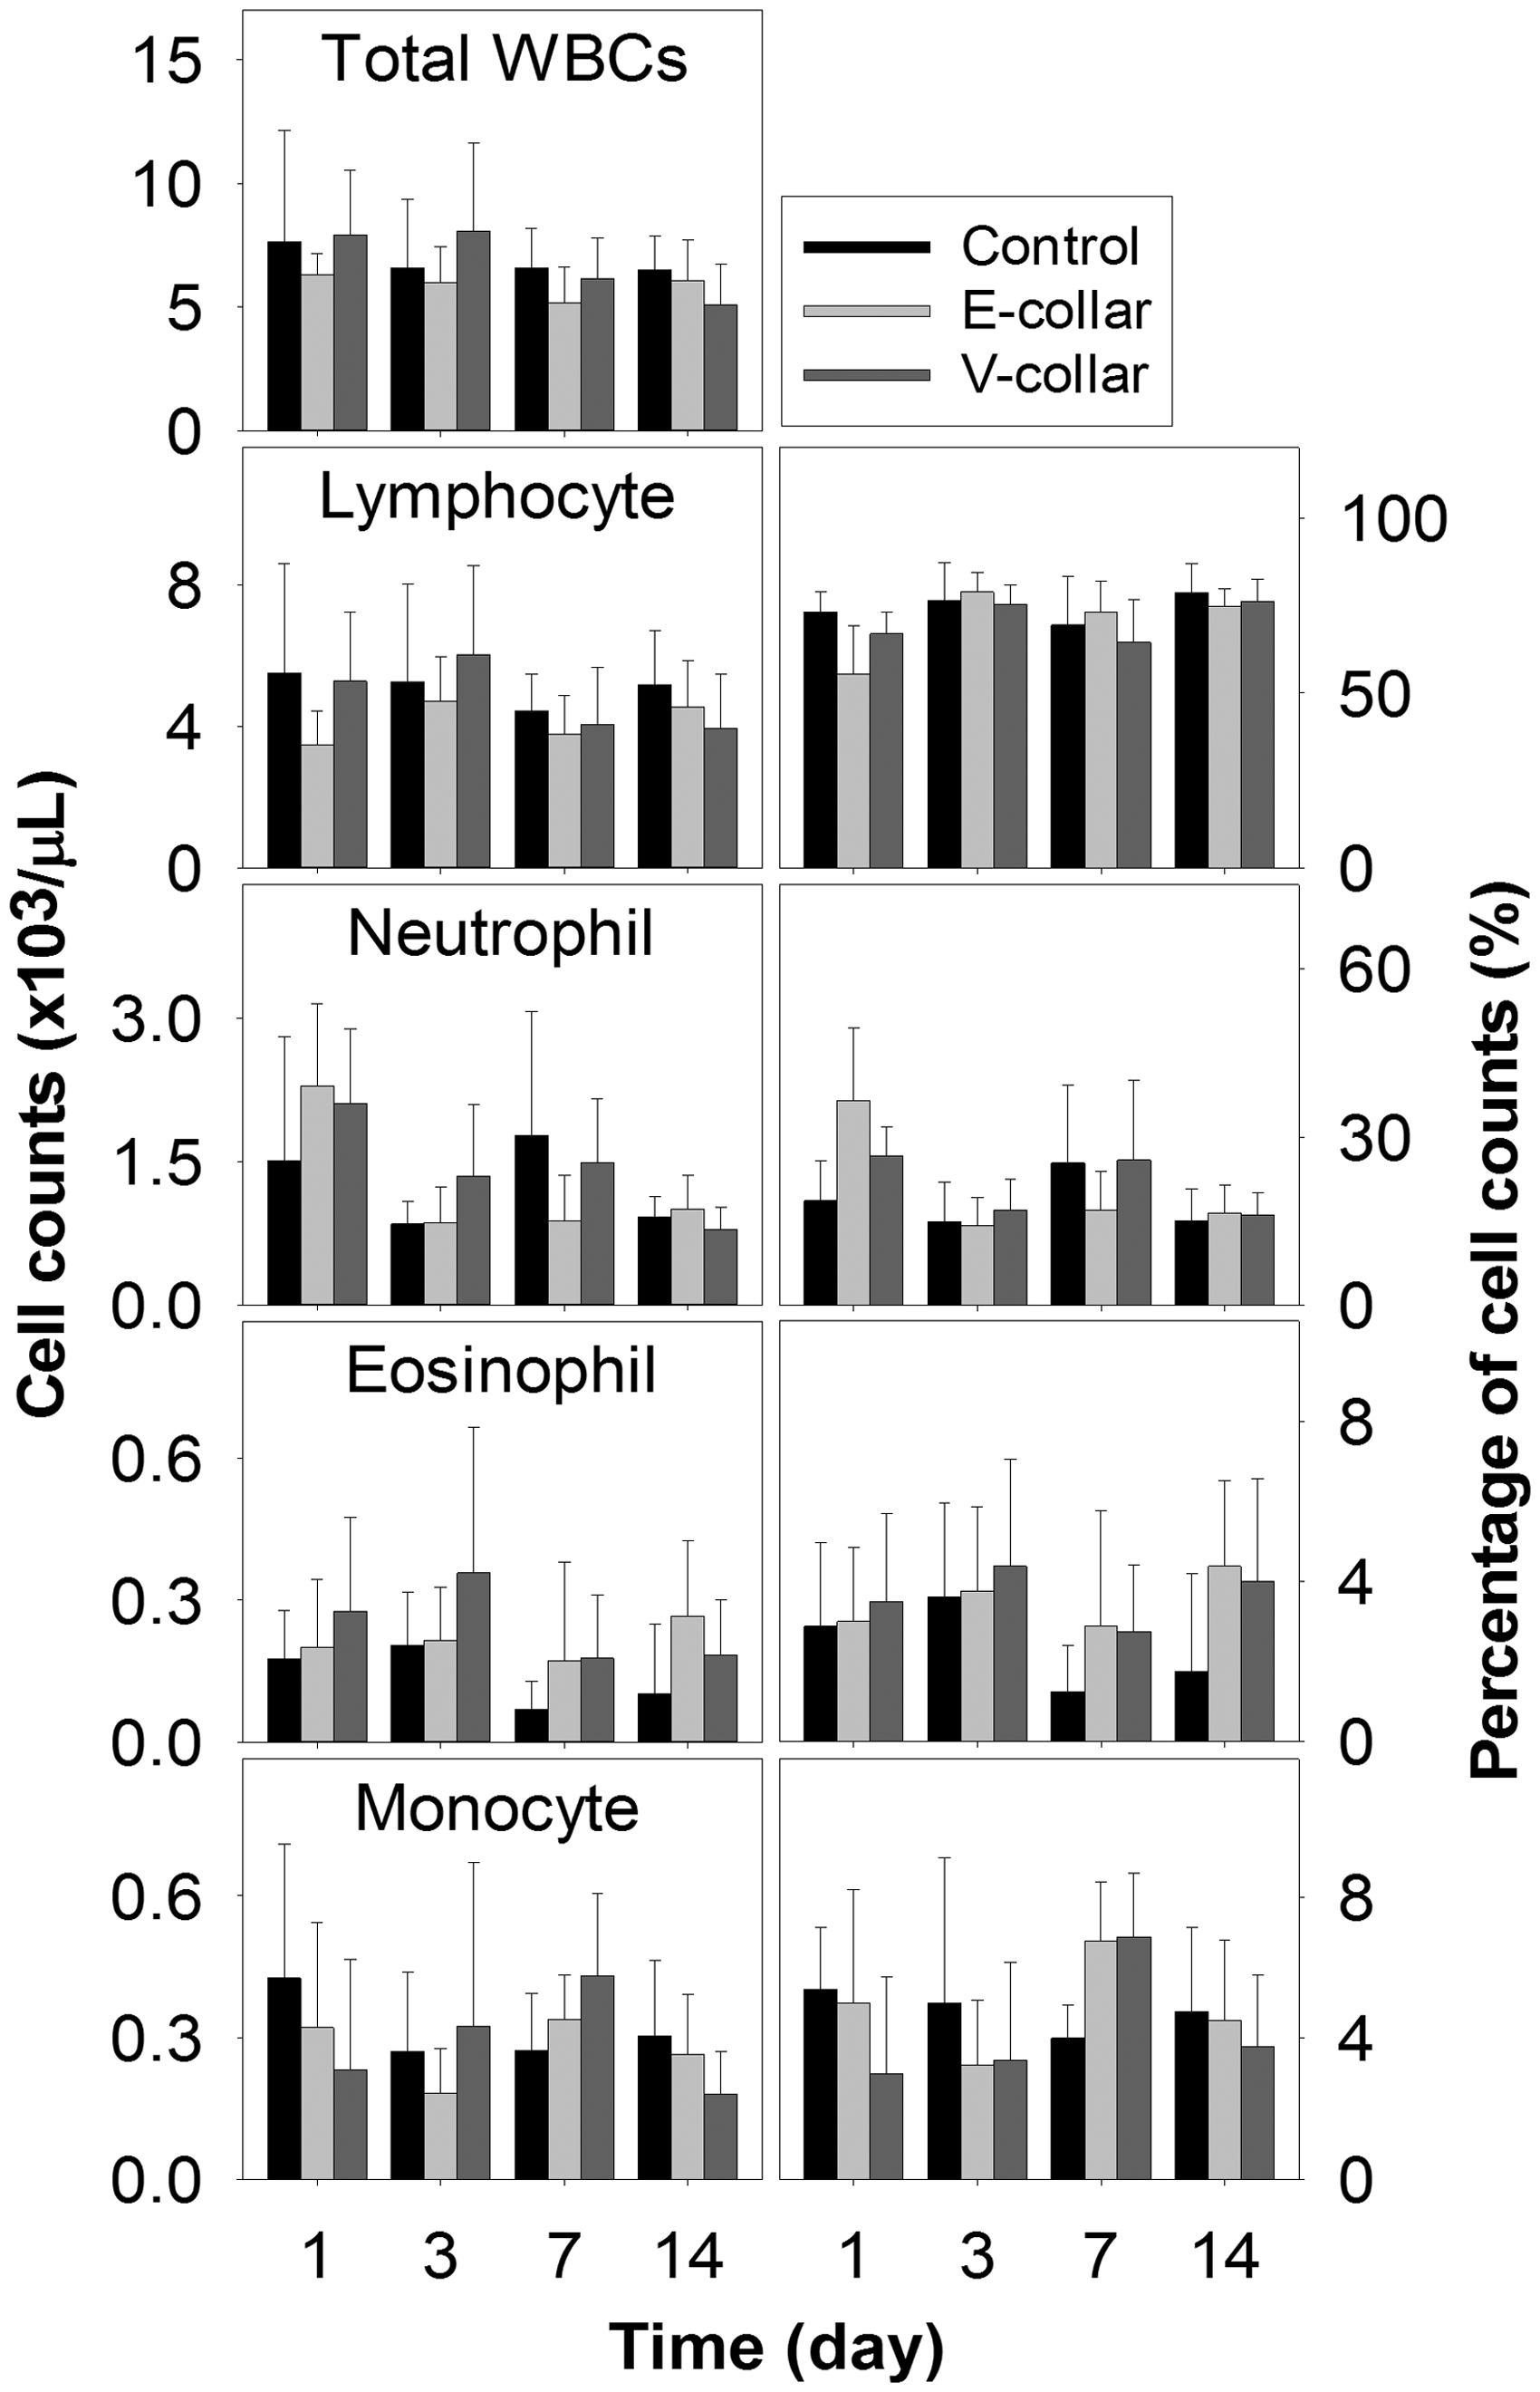
Histopathological findings
On macroscopic examination, six of the eight mice in the E-collar group showed injuries to their neck skin caused by the collar. Among the six mice, one mouse showed skin erosion, two mice showed ulcers, and three mice developed scars with skin ulcers as a result of chafing by the collar on the neck region. Two remaining mice showed severe skin redness. By contrast, four of the eight mice in the V-collar group showed only slight skin redness on the chest (data not shown).
On microscopic examination, the thickness of the epidermis in the control group was 8.55 ± 2.34 µm (Figure 5a). However, the thickness in the E-collar group was 35.02 ± 8.61 µm, with mild-to-moderate acanthosis (epidermal hyperplasia), including orthokeratotic hyperkeratosis in the stratum corneum (Figure 5b). The thickness of the epidermis in the V-collar group was 18.62 ± 5.68 µm, which was slightly higher than that in the control group (Figure 5c). There were significant differences between the control and E-collar groups (P < 0.0001), the control and V-collar groups (P < 0.0005), and the E-collar and V-collar groups (P < 0.001) (Figure 5d). In the E-collar group, moderate-to-severe infiltration by mononuclear inflammatory cells in the subepidermal dermis was observed, and neutrophil infiltration was present in some cases. However, the V-collar group did not show hyperkeratosis, although slight inflammatory cell infiltration was shown. The numbers of nucleated cells in the subdermal dermis from the control, E-collar, and V-collar groups were 68.04 ± 6.52, 234.4 ± 97.23, and 69.38 ± 10.60, respectively. Inflammatory cell infiltration was significantly more frequent in the E-collar group than in the control and V-collar groups (P < 0.0005) (Figure 5d).
Histology sections of the skin from the anterior neck and chest regions obtained from the control (a), E-collar (b) and V-collar (c) groups at day 14. Sections are stained with haematoxylin and eosin (H&E; magnification, left: 100×, right: 400×). The solid and open arrows indicate the epidermal and keratin layers, respectively. (d) Measurement of the epithelial thickness (upper panel) and the number of inflammatory cells (lower panel) (*P < 0.001, **P < 0.0005, ***P < 0.0001) (n = 8).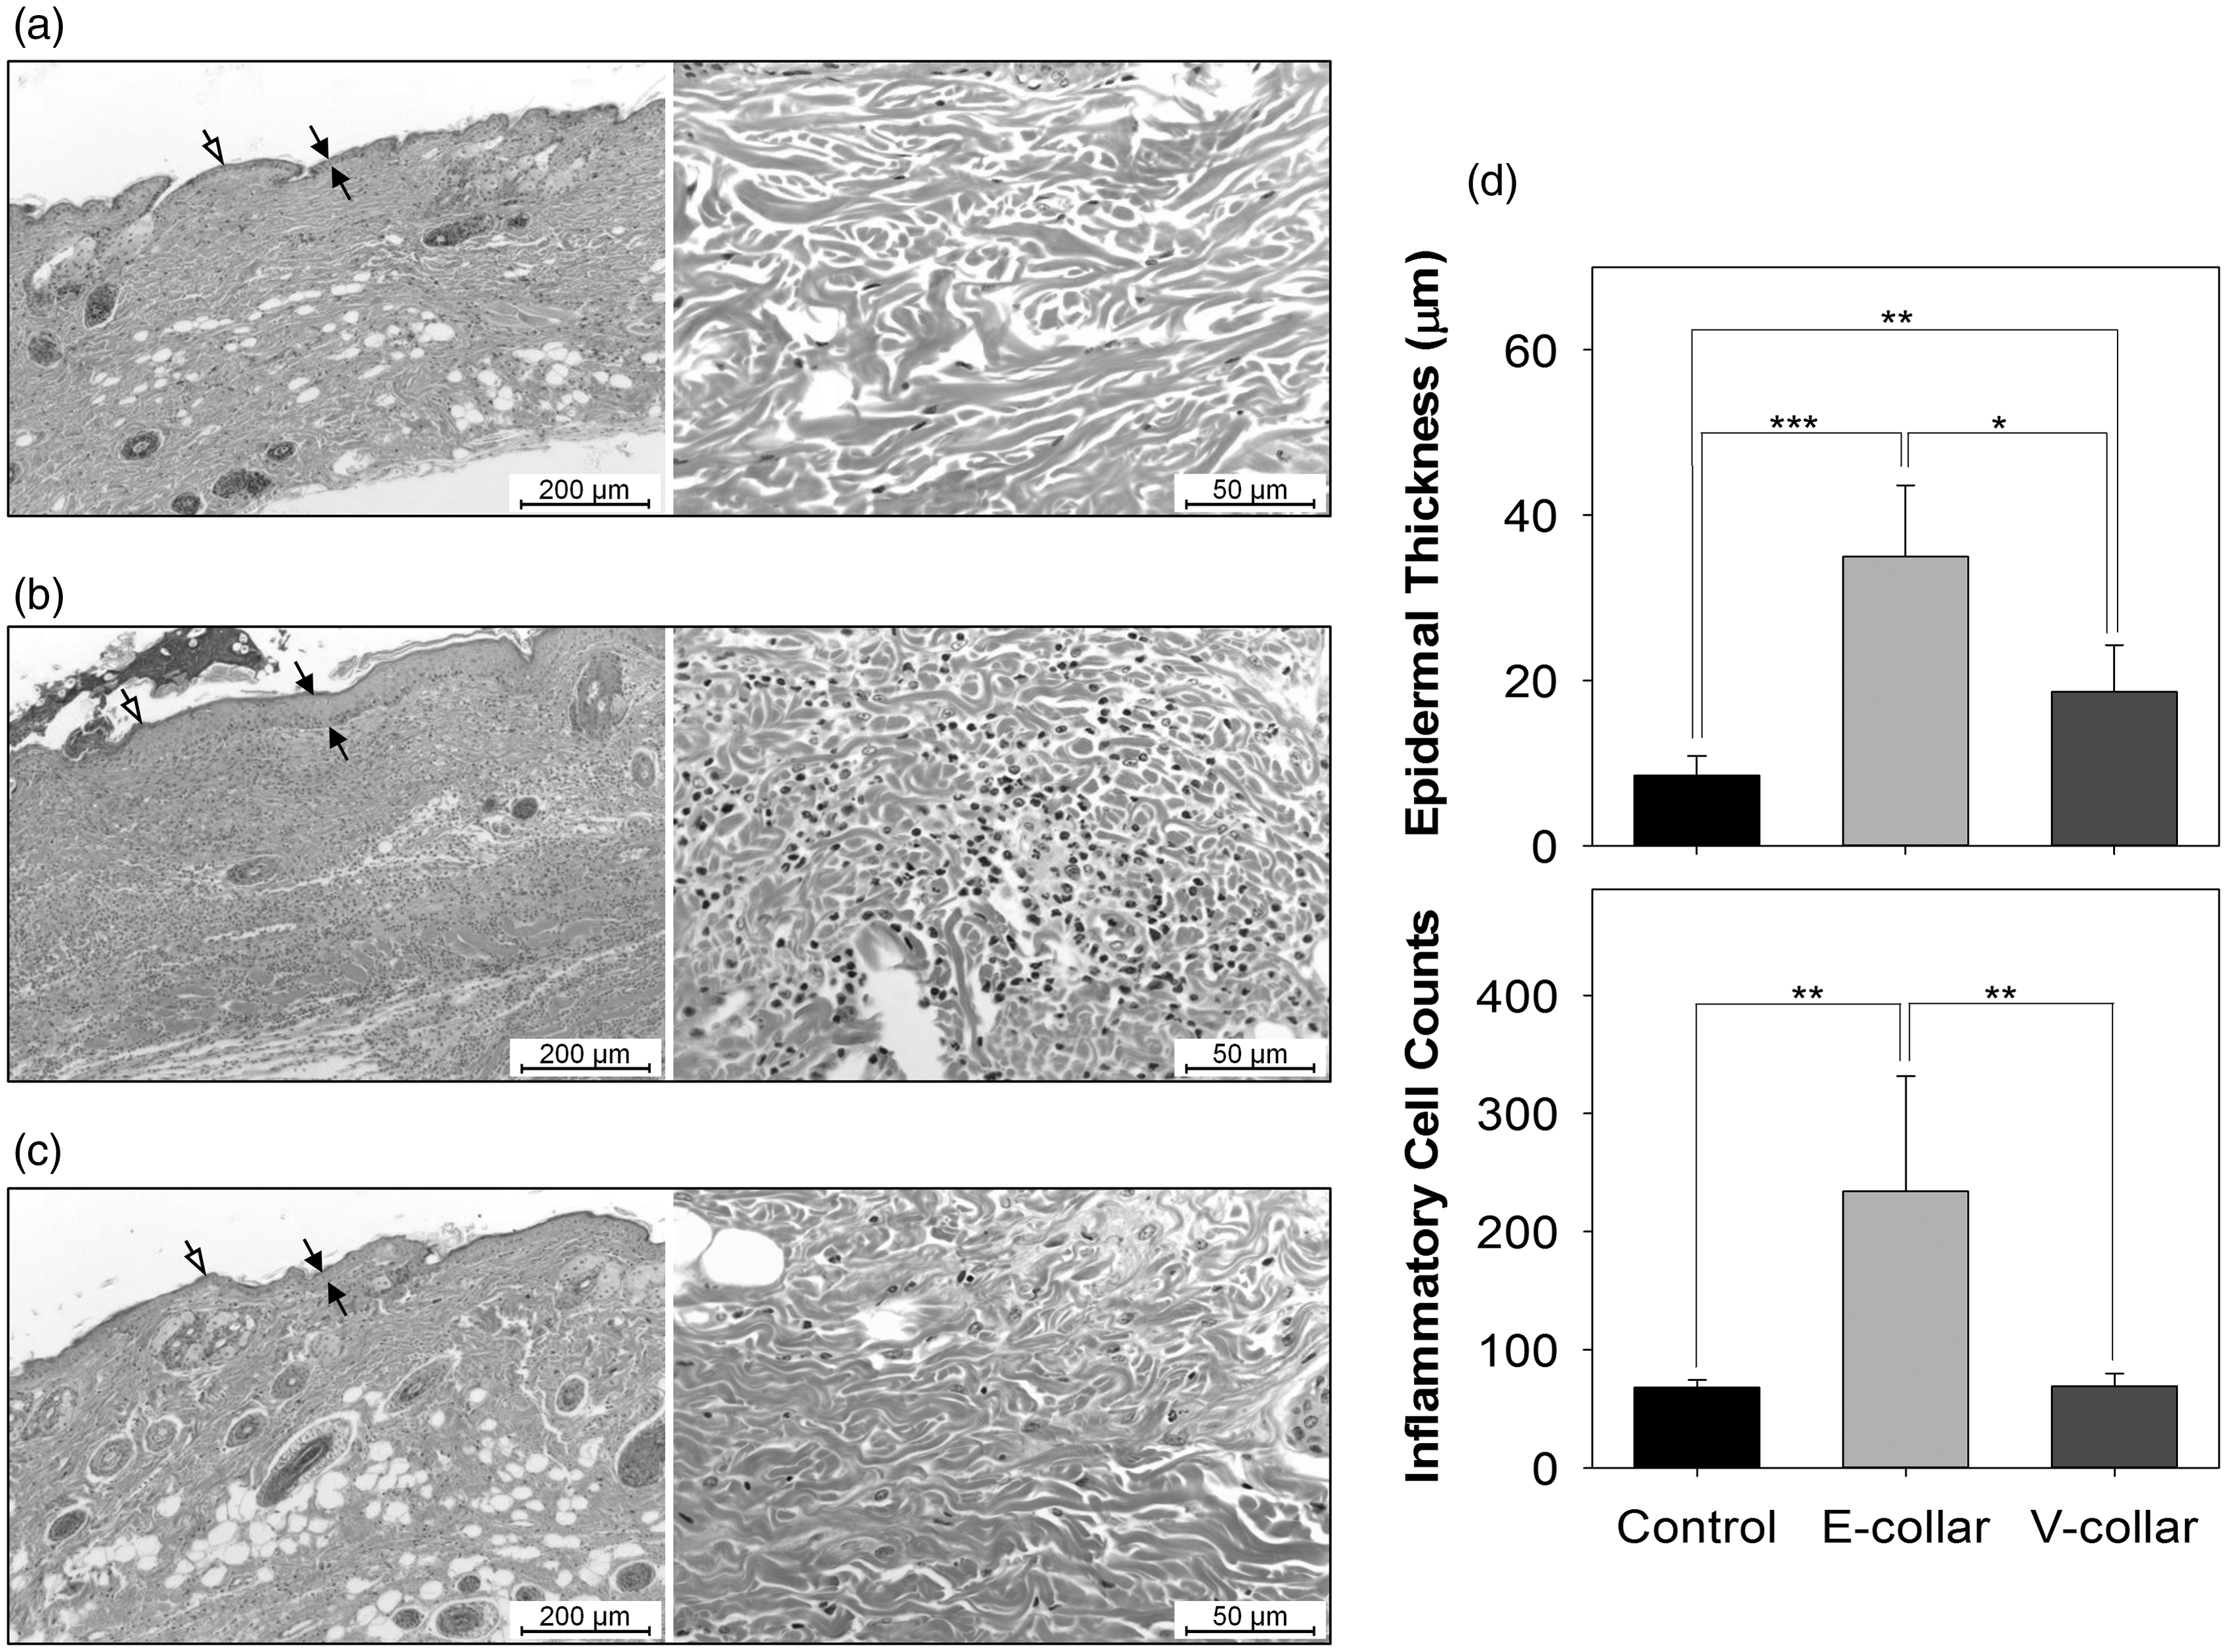
Discussion
When an animal restraint is required in animal experiments, investigators must ensure the safety of the animals and use restraints that cause minimal pain and distress. 25 Studies have reported that the mere placement of restraint collars on animals can induce considerable stress.26–29 The type of restraint collar used is also important. The right type of collar should be chosen for experimental animals, and adequate time must also be provided for the animals to adjust to the device. In addition, a collar should not be very difficult to wear and remove.1,2,5 The E-collar is the most commonly used device for various animals, including birds, cats, dogs, rabbits and rodents. 1 It is appropriate for dogs and cats with long and thin necks. However, placement of the E-collar on rodents is difficult because these animals have small heads and short necks. 2 In this study, despite its relatively short experimental duration, the skin on the necks of the animals showed gradual ulceration from the inner flange of the collar. Researchers should pay careful attention to animals wearing the E-collar. However, the mice wearing the V-collar, which was developed in our laboratory, showed no skin injury from decreased chafing.
Emotional changes in an animal caused by stress can influence its feeding behaviour and body weight.28,29 Figure 2c shows that the food intake in the E-collar and V-collar groups was significantly lower than that in the control group on day 1 (P < 0.0005). However, after adjustment for one day, the food intake became similar in all groups and did not show significant changes until the end of the experiment. A previous study showed significantly decreased food intake caused by restraint stress in animals, resulting in decreased body weight. 29 By contrast, other studies have reported that stress increases the intake of sweet food and enhances food-seeking behaviour in mice, resulting in overeating and increased body weight.28,30 However, the body weights of mice wearing either collar did not show significant changes during the experiment and were not significantly different when compared with those in the control group, except on days 10, 11, 12, and 14 (Figures 2a and b). The body weights of male ICR mice have been reported to be 30–35 g at seven weeks, 33–38 g at eight weeks and 34–39 g at nine weeks. 31 The weights at days 10, 11, 12, and 14 in our study were within the normal ranges.
The blood glucose concentrations showed no significant differences among the groups (Figure 3a). The energy requirements of small animals such as mice are high; therefore, such animals can be stressed by fasting. Fasting blood glucose measurements are usually not recommended, except for experiments with a special purpose.15,32 Therefore, non-fasting blood glucose concentrations were measured in this study. Normoglycaemia in a non-fasting condition is defined as a blood sugar level of less than 200 mg/dL. 18 Most mice were normoglycaemic in this study, although the glucose concentrations of some were slightly over 200 mg/dL. This may have resulted from a measurement error or individual characteristics. Corticosterone, a major stress hormone, can be directly measured in plasma or serum to quantify stress levels. 33 Stress hormone levels measured over time can confirm the adjustment period required for adapting to a collar. 1 In one study, the normal corticosterone level in mice was below 5 ng/mL, although it was over 15 ng/mL during stress. 33 In this study, the stress hormone levels showed no significant differences among groups (Figure 3b). We believe that the mice were not seriously stressed, because the mean corticosterone levels in all mice wearing the collars were measured and were less than 7 ng/mL, although they were over 8 or 9 ng/mL in some mice. In the control group in our study, the mean corticosterone levels at days 3, 7 and 14 were significantly higher than those at day 1 (P < 0.05), probably because the mice were stressed by the single housing and blood collection. Further long-term studies should investigate the stress response to collar wear, because the non-fasting blood glucose and corticosterone levels of the mice wearing the collar were slightly higher than those of the normal mice.
No stress-associated leukocyte profiles, including lymphocytopenia or neutrophilia, were observed in any group during the experiment period (Figure 4 and Table 1). On the first day after wearing the E-collar, the lymphocyte count appeared to be lower and the neutrophil count appeared to be higher, although this result was not significant because the values were within the normal range. Histopathological analysis revealed that the thickness of the epidermis in the E-collar group was four times higher than that in the control group and two times higher than that in the V-collar group. Moreover, the inflammatory cell counts in the E-collar group were approximately three times higher than those in the control and V-collar groups. The skin of the mice in the E-collar group also showed substantial epidermal acanthosis with dermal inflammatory cell infiltration. By contrast, the skin of mice in the V-collar group showed normal architecture and morphology, similar to those of the mice in the control group. The V-collar can irritate the skin because the thickness of the epidermis in the V-collar group was slightly higher than that in the control group. In future studies, we will improve the V-collar by changing its material to reduce irritation to the skin.
In conclusion, the V-collar did not cause any serious stress to the mice in this study, and the food intake, glucose and stress hormone measurements confirmed that one day was adequate for adjustment to the V-collar. Furthermore, the V-collar, in contrast the E-collar, did not cause skin injury. The V-collar is easy to place and remove by investigators. This comparative analysis of the effects of the V-collar and E-collar on health, behaviour and stress in mice shows that the V-collar is advantageous over the E-collar for rodents. Investigators can effectively use the V-collar to provide enhanced animal welfare during laboratory experiments.
Footnotes
Declaration of conflicting interests
The author(s) declared no potential conflicts of interest with respect to the research, authorship, and/or publication of this article.
Funding
The author(s) disclosed receipt of the following financial support for the research, authorship, and/or publication of this article: This study was supported by an intramural grant from the Korea Institute of Science and Technology (Grant No. 2E23870) and a grant from the Ministry of Trade, Industry and Energy in Korea (Grant No. 10011352).