
Abstract
During the last two decades, measurement of faecal Cortisol or corticosterone metabolites (FCM) has become one of the most important tools to non-invasively monitor stress in animals. However, to reliably assess an animal's adrenocortical activity, a careful validation of this technique for each species and sex investigated is obligatory. Usually results in these validation studies and in subsequent applications are expressed as concentration (FCMconc). Nevertheless, some authors express their results as absolute amounts (FCMabs) and claim this to be more accurate. A physiological validation to prove this assumption, however, is still missing as well as information about the influence of the intervals set for faecal sampling, although the chosen intervals might play an important role. Since FCMconc and FCMabs may differ and therefore lead to different conclusions, our study aimed to gain fundamental and scientifically valid information about these parameters by re-analysing a set of data obtained in a study on laboratory rats. The data basis used was derived from four validation experiments performed in male and female rats: an adrenocorticotrophic hormone challenge test, a dexamethasone (Dex) suppression test, an investigation of the diurnal variation (DV) of glucocorticoids and the stress response in reaction to the injection procedure itself (for details see Lepschy et al. Non-invasive measurement of adrenocortical activity in male and female rats. Lab Anim 2007;41:372–87). Faecal samples were collected in short time intervals and the exact amount of faeces voided during each sampling interval was documented. Throughout all performed tests strong positive correlations between FCMconc and FCMabs were found (median of rs > 0.72). In males, for all calculated sampling intervals (4, 8 and 12 h) pharmacological stimulation, suppression and the DV of adrenocortical activity were reflected accurately using both FCMconc and FCMabs. In females, suppression of FCM by Dex was also clearly reflected in both systems. However, pharmacological stimulation was only reflected accurately by means of FCMconc, which clearly limits the usability of FCMabs. Thus, using the data of physiological validation experiments, we clearly demonstrate for the first time advantages and disadvantages of presenting results as FCMconc or FCMabs. Based on our findings in laboratory animals such as rats, giving results as FCMconc seems to be more appropriate and FCMabs - if at all - might only be used as an addition.
During the last two decades measurement of glucocorticoid metabolites (GCM) in the faeces has become one of the most important tools to non-invasively monitor adrenocortical activity during stressful situations, illness and other challenging situations in many different species.1,2 Especially the integrated measure of hormones over an extended period of time and its non-invasiveness (no blood samples are needed) make this method a powerful tool in many research fields.3,4
Measurement of faecal GCM helps to improve the experimental usage and to reduce the number of laboratory animals needed and eliminates unavoidable effects associated with the blood sampling procedure itself.5-9 Nevertheless, the proper and reliable measurement of this parameter is not straightforward and has certain requirements, making a sound validation (mostly achieved by a pharmacological stimulation via adrenocorticotrophic hormone [ACTH] and suppression via dexamethasone [Dex] of adrenocortical activity) of the used methods mandatory.4,10–12 Native glucocorticoids are extensively metabolized in the liver and virtually absent in faecal samples. Therefore, new group-specific antibodies, which are able to measure a broad range of GCM, have been developed and successfully applied to monitor adrenocortical activity of a species (for a review see Tourna and Palme 4 ).
In addition, there is some discussion about how to express the gained results. Most researchers - working on laboratory, domestic, zoo and wildlife animals - present their results as concentrations (ng/g or nmol/kg faeces). However, some authors (e.g. Carlsson et al., 13 Cavigelli et al., 14 Royo et al. 15 ) claim that concentrations might not be reliable and sensitive enough to mirror the precise condition of the animal's endocrine status, while total amounts of excreted GCM improve the validity. This can be performed relatively easily in laboratory animals, as the collection of all voided faeces is possible. In domestic animals or in wild animals kept in zoological institutions the collection of all faeces is laborious and complicated, and in free living wild animals would be even impossible. Nevertheless, a sound validation to reliably prove whether this method is better suited for evaluating adrenocortical activity is still missing up to now. Furthermore, the chosen sampling intervals represent - although commonly disregarded - another important influencing factor of such non-invasive methods. Especially in animals with a pronounced diurnal variation (DV) of GCM, a rather long sampling interval might mask the presence of variations of adrenocortical activity. Here, again a clarifying study based on proper validation experiments is missing up to now.
The laboratory rat is commonly used in biomedical research, e.g. as animal model for human disorders. Detailed information about the excretion and metabolism of stress hormones in both sexes is available16,17 and therefore this species was chosen for further investigation. The validation process of a 5α-pregnane-3β,11β,21-triol-20-one EIA for the measurement of faecal corticosterone metabolites (FCM) in rats has already been described. 16 Data in that study were given in μmol/kg faeces, but the total amounts of excreted faeces were also recorded.
Therefore the aim of the present investigation was to compare the total excretion and the concentrations of FCM based on the data of already published experiments and to evaluate the influence of different sampling intervals on the final results. Thus, this study represents a sound basis for the comparison of both methods of expressing the results, i.e. absolute amounts versus concentrations. Based on these physiological validation experiments, for the first time, a clear judgement will be possible, if excreted amounts of FCM (FCMabs) represent an improvement compared with the traditional FCM concentrations (FCMconc).
Materials and Methods
Physiological validation experiments
The data to compare FCMconc and FCMabs were gained in four already published validation experiments. 16 Briefly, in the study by Lepschy et al., 16 to validate a 5α-pregnane-3β,11β,21-triol-20-one EIA (first developed for mice 18 ) in laboratory rats, the DV of glucocorticoids as well as the effects of the injection procedure itself by performing an isotonic saline injection (SI) were investigated. Furthermore, an ACTH challenge and Dex suppression test, using six male and six female rats each, were conducted. The animal housing room was maintained under standard laboratory conditions (light–dark cycle: 12:12 h, lights on at 06:00 h; temperature: 21 ± 1°C; relative humidity: 50 ± 10%). To enable individual sampling and quantitative collection of all voided faeces, without the need to handle the animal, the rats were housed singly in stainless steel wire cages, which were placed in standard Makrolon cages type IV. The rats were habituated to this housing system for four days before starting the experiment. Throughout all experiments commercial rat diet and bottled tap water were available ad libitum (for more details see Lepschy et al. 16 ). Male rats weighed 338 ± 13 g and female rats 249 ± 9 g. Faecal samples were collected and the exact amounts of faeces voided during each sampling interval were recorded. Total mass of faeces produced throughout the first 24 h of the performed experiments was compared between the four experiments. Sampling times were: 0, 2, 4, 6, 8, 10, 12, 14, 16, 20, 24, 30, 48, 72 and 96 h after administration. Results are expressed as concentrations of faecal corticosterone metabolites (FCMconc). Total amounts (nmol/h) of faecal corticosterone metabolites (FCMabs) were calculated by multiplying the FCMconc with the amount of voided faeces during a given sampling interval and divided by the number of hours in that interval.
To evaluate the influence of prolonged sampling intervals, FCMconc and FCMabs were calculated in 4, 8 and 12 h intervals. Afterwards, results of the ACTH stimulation and the Dex suppression experiment were statistically compared with results of the two control experiments (DV and SI).
Statistical analysis
Since parts of the obtained data were not normally distributed, the data were analysed by non-parametrical statistics. 19 All statistical tests were applied two-tailed using the software package SPSS (11.5.1, SPSS Inc, Chicago, IL, USA). Differences between more than two independent samples were calculated with an analysis of variance on ranks (synonym: Kruskal–Wallis H-test [KWH]). Differences were considered significant, if their probability of occurring by chance was less than 5%. Correlation between FCMconc and FCMabs was calculated using the Spearman's correlation coefficient (rs).
Results
Production of faeces
In males, there was no significant difference between the DV, SI, ACTH and Dex experiments regarding the amounts of produced faeces (KWH test, n1 = n2 = n3 = n4 = 6: H = 2.2, P = 0.593). The weight of the faeces collected during the first 24 h of each experiment was (mean ± SD) 11.73 ± 1.33 g, 11.30 ± 1.04 g; 10.89 ± 1.07 g and 12.00 ± 1.87 g, respectively.
Overall, females produced less faeces than males. However, during the first 24 h in the Dex experiment significantly higher amounts were voided than in the control (DV and SI) experiments (KWH test, n1 = n2 = n3 = n4 = 6: H = 11.5, P = 0.009). The mean faecal output of female rats in the DV, SI, ACTH and Dex experiments was (mean ± SD) 7.61 ± 0.67 g, 7.74 ± 1.12 g, 8.96 ± 0.97 g and 9.73 ± 1.28 g, respectively.
Correlation between FCMconc and FCMabs
Throughout all performed tests, rather high and positive correlation coefficients were found in males (median of rs ≥ 0.711) and females (median of rs ≥ 0.718; Figure 1). Differences between the experiments were not statistically significant, neither in males (KWH test n = 6 for each group, H = 1.27, df = 3, P = 0.736) nor in females (KWH test n = 6 for each group, H = 5.40, df = 3, P = 0.145).
Correlation coefficients (Spearman rs) of FCMconc and FCMabs in male rats (upper panel) and female rats (lower panel) of the four different validation experiments. Data are given as box plots (medians: lines in the boxes; 25% and 75% quartiles: boxes; 10% and 90% percentiles: whiskers). DV: diurnal variation, SI: saline injection, ACTH: adrenocorticotrophic hormone, Dex: dexamethasone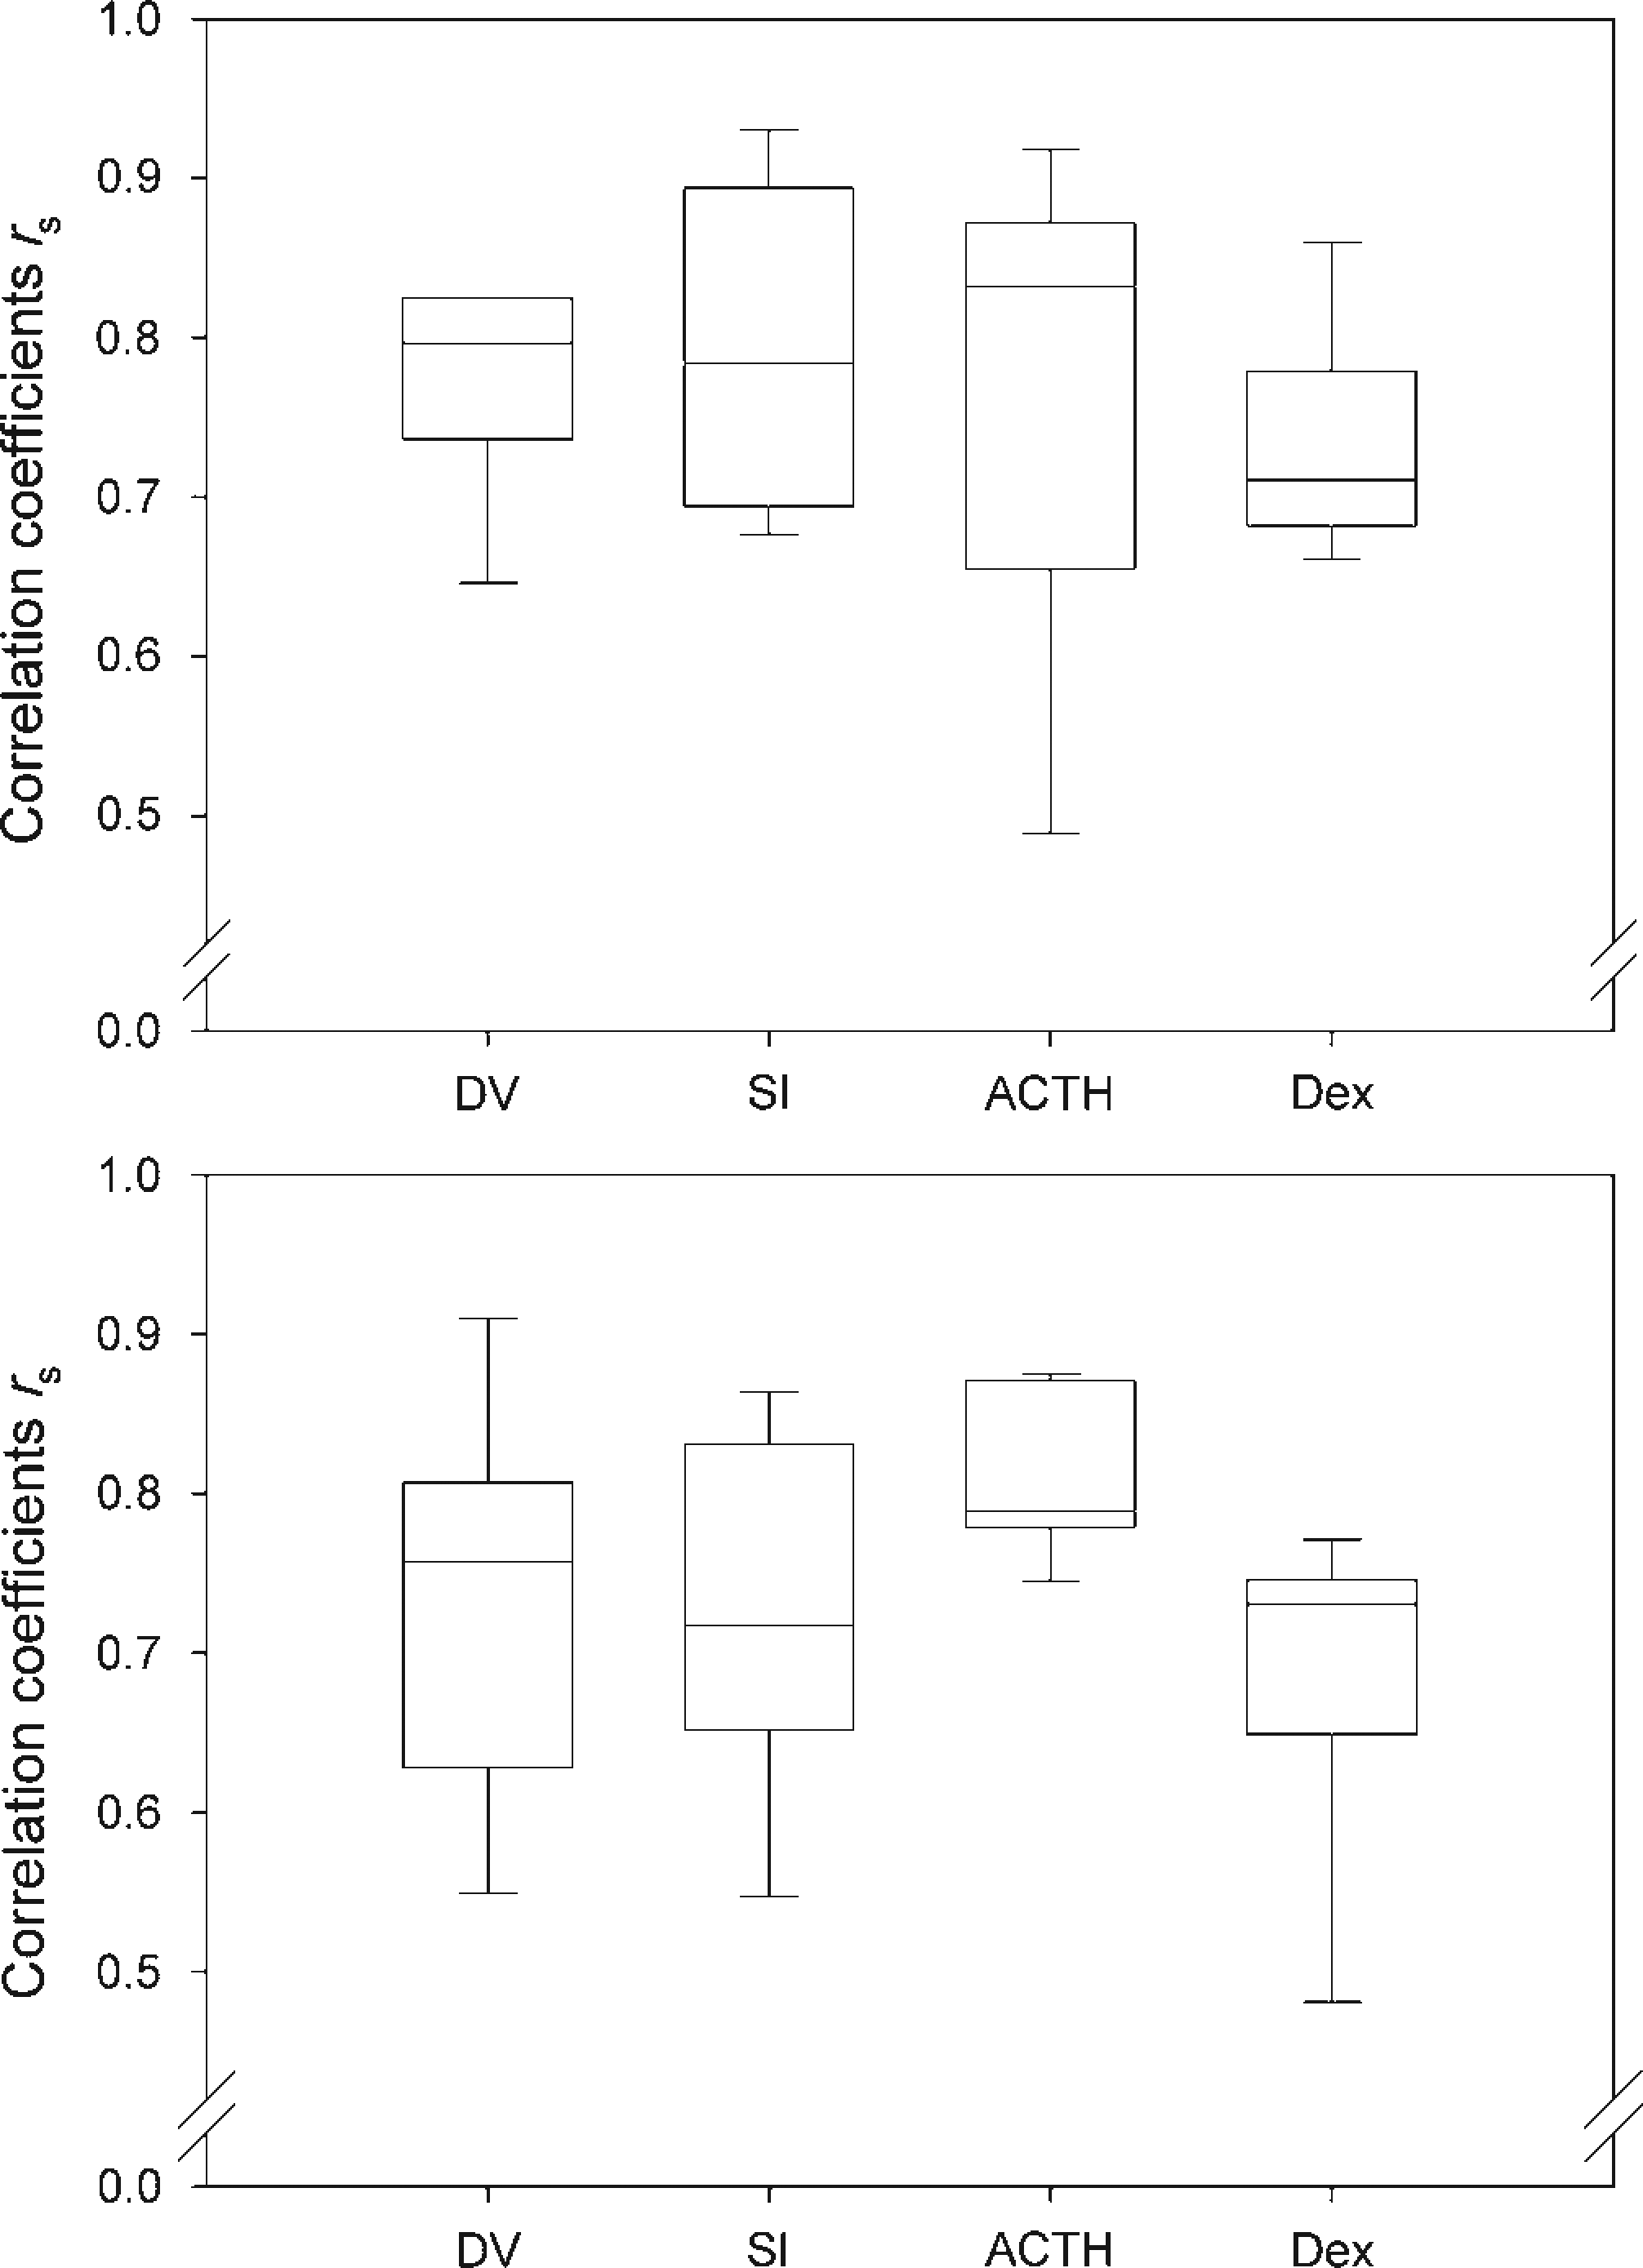
Influence of the sampling intervals on results expressed in both dimensions (FCMconc versus FCMabs)
ACTH challenge test
In males, comparing the control experiments (DV, SI) with the ACTH experiment using FCMconc and FCMabs led to almost identical results. Significantly elevated FCMconc as well as FCMabs were observed in the ACTH experiment using the 4 (Figure 2), 8 and 12 h sampling intervals (KWH test, n1 = n2 = n3 = 6: H = 7.5–12.1, 0.001 < P < 0.05; see Figure 3 for details).
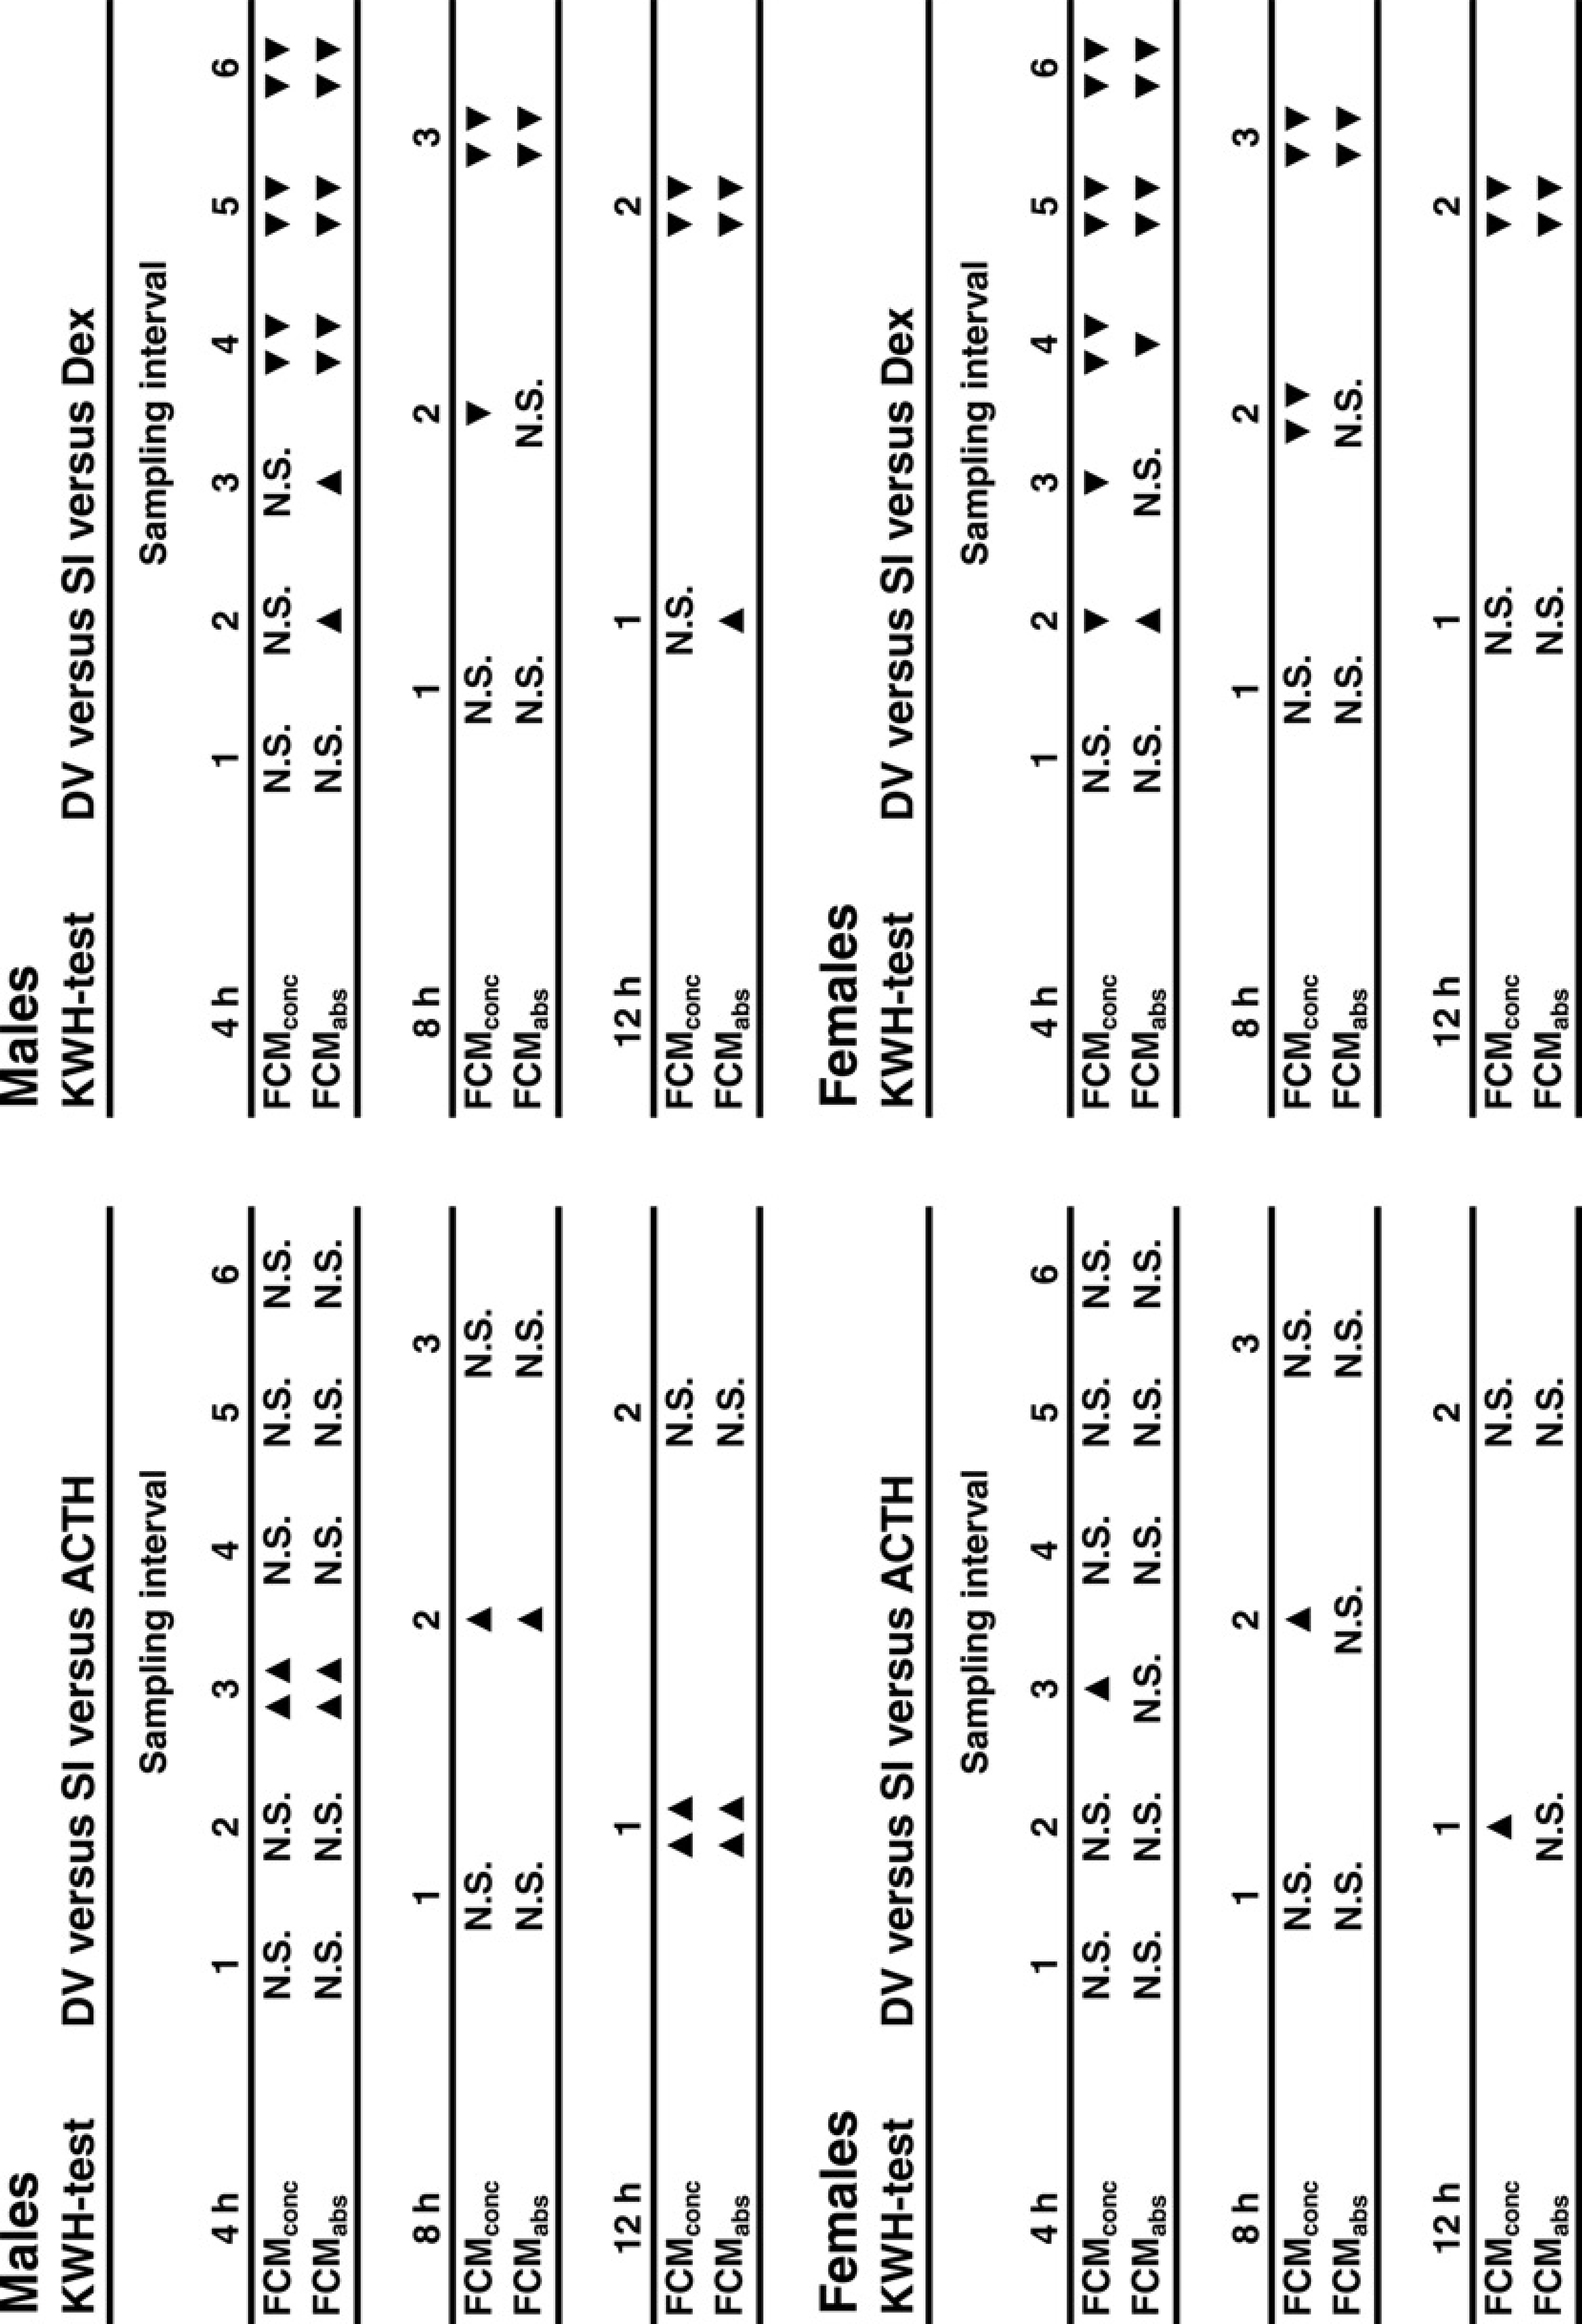
Corticosterone metabolites (CM), measured with the 5α-pregnane-3β,11β,21-triol-20-one EIA (upper panel: FCMconc, middle panel: FCMabs), in faecal samples (amounts of faeces produced: lower panel) of male rats (n = 6) treated with ACTH (grey) and dexamethasone (white), respectively. Data are given as box plots (cf. Figure 1). The dark phase (horizontal bars) is indicated at the top of each panel. Significant differences (*P < 0.05; **P < 0.01) between the ACTH challenge and the two control experiments ‘diurnal variation’ (medians given as circles) and ‘saline injection’ (medians given as diamonds; values are connected with a dotted line for ease of traceability) are marked with asterisks, placed on top of the boxes. Significant differences between the dexamethasone suppression and the two control experiments are marked with asterisks, placed below the boxes Defined time intervals (4, 8 and 12 h) and significant differences between the ACTH challenge or the dexamethasone suppression test and the two control experiments (DV, SI). Triangles (P< 0.05: one triangle, P < 0.01: two triangles) represent significantly higher (peak points up) or lower (peak points down) differences than the control experiments (DV and SI). KWH-test: Kruskal–Wallis H test, DV = diurnal variation, SI = saline injection, ACTH: adrenocorticotrophic hormone, N.S.: not significant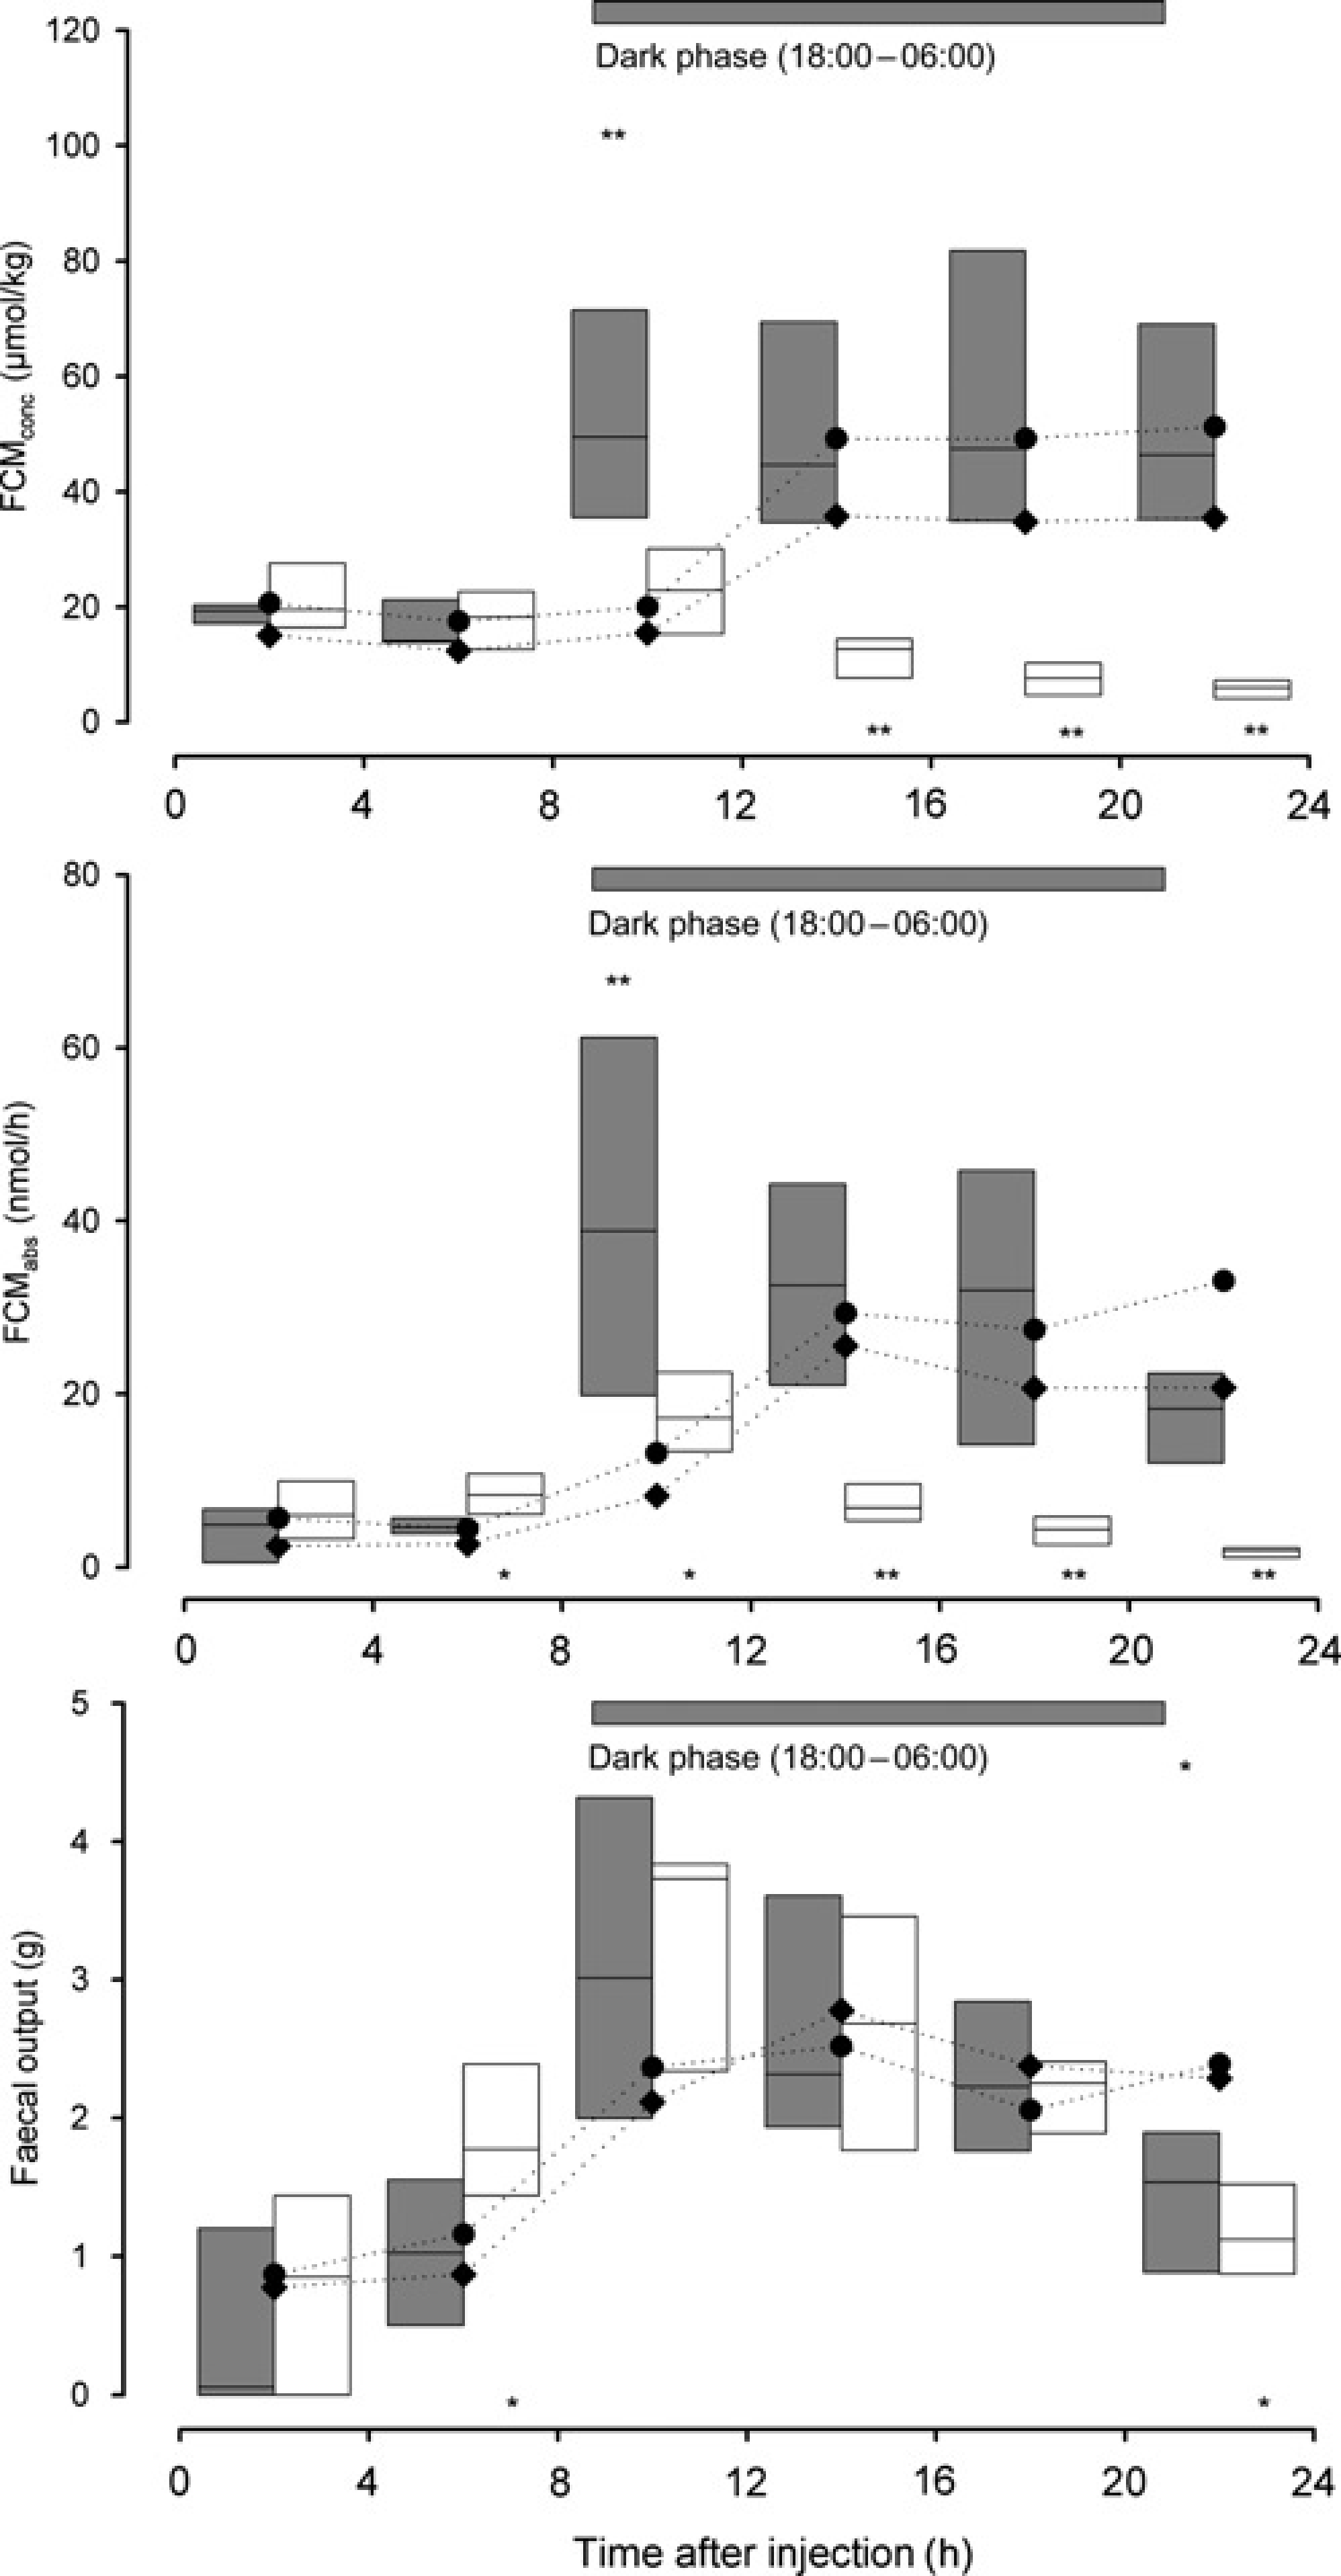
In females, only FCMconc showed significantly higher values in the ACTH experiment: In the 4 h intervals (Figure 4) from 8 to 12 h postinjection (KWH test, n1 = n2 = n3 = 6: H = 8.4, P = 0.015), in the 8 h intervals from 8 to 16 h postinjection (KWH test, n1 = n2 = n3 = 6: H = 6.2, P = 0.045) and in the 12 h sampling intervals from 12 to 24 h post-treatment (KWH test, n1 = n2 = n3 = 6: H = 6.3, P = 0.042; see Figure 3 for details).
Corticosterone metabolites (CM), measured with the 5α-pregnane-3β,11β,21-triol-20-one EIA (upper panel: FCMconc, middle panel: FCMabs), in faecal samples (amounts of faeces produced: lower panel) of female rats (n = 6) treated with ACTH (grey) and dexamethasone (white), respectively. For further details see the legend of Figure 2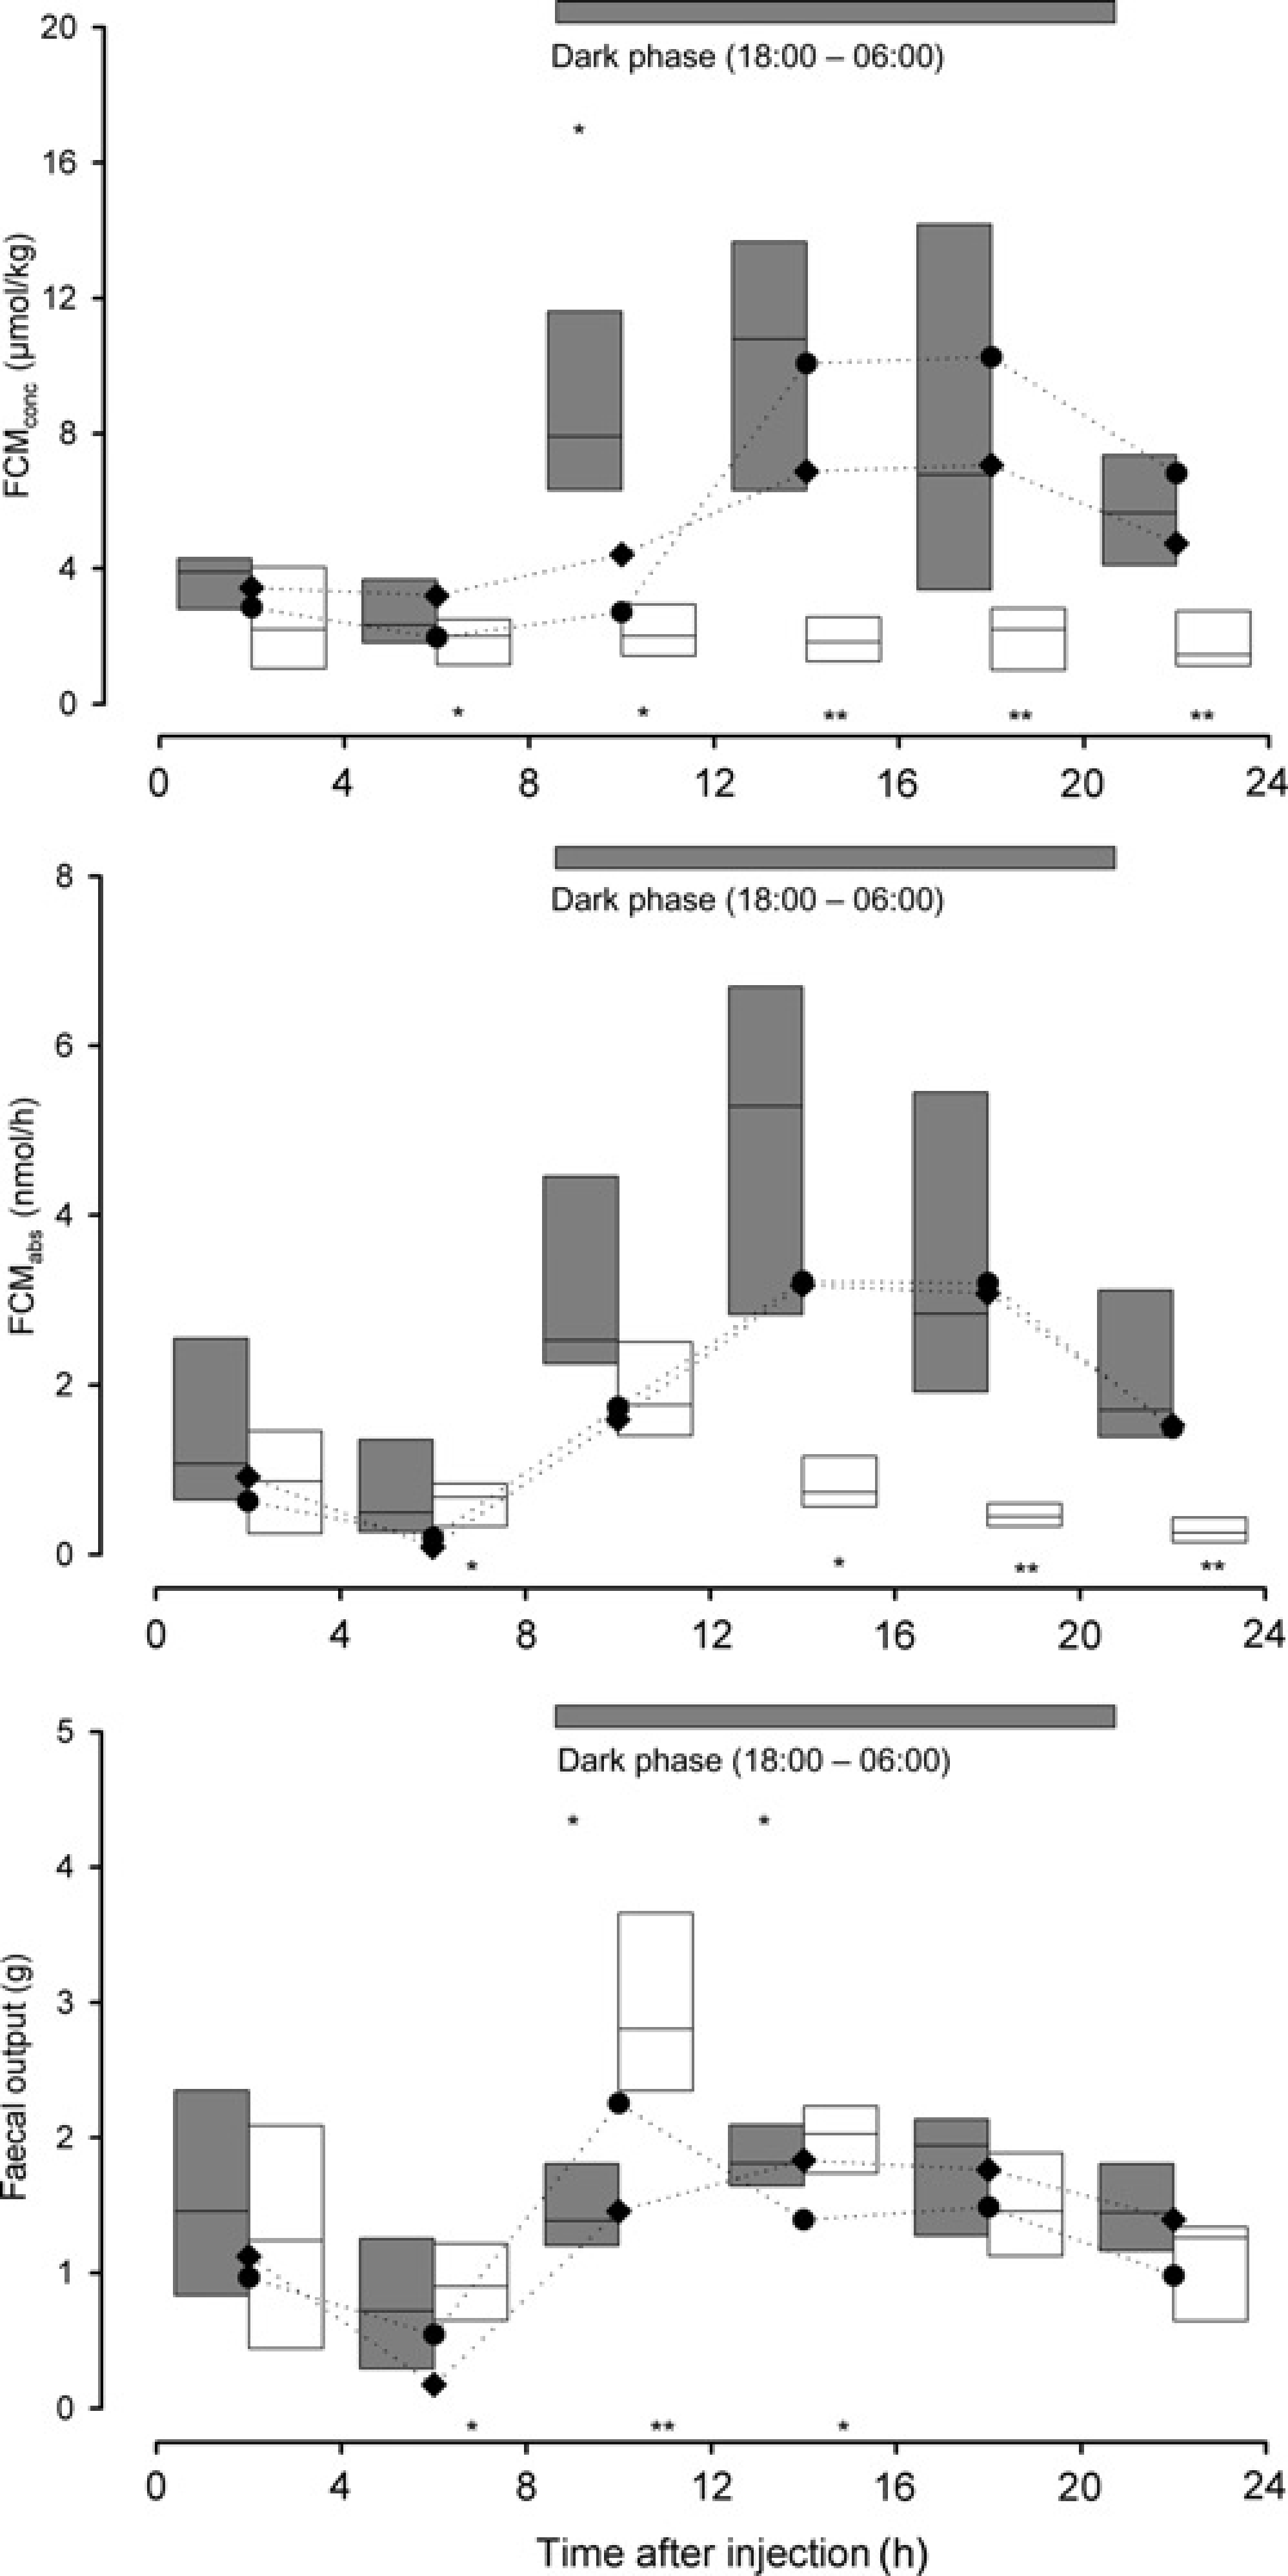
Dex suppression test
In males significantly higher values from 4 to 12 h postinjection (4 h intervals; KWH test, n1 = n2 = n3 = 6: H = 8.4–8.5, P < 0.05) were found using FCMabs. No significant differences during this time were found using FCMconc. From 12 h postinjection onwards, significantly lower values (FCMconc and FCMabs) were found compared with the control experiments (KWH test, n1 = n2 = n3 = 6: H = 10.4–12.1, P < 0.005). Using the 8 h sampling interval the Dex group showed significantly lower values in the 8–16 h interval using FCMconc (KWH test, n1 = n2 = n3 = 6: H = 6.0, P = 0.05), while no significant differences in this time period were found using FCMabs. Between 16 and 24 h postinjection, Dex, SI and DV differed significantly using FCMconc and FCMabs (KWH test, n1 = n2 = n3 = 6: H = 11.9 and 11.4, P < 0.005).
In the 12 h sampling intervals (FCMconc and FCMabs) significantly lower values from 12 to 24 h postinjection were found (KWH test, n1 = n2 = n3 = 6: H = 12.3 and 11.9, P < 0.005). In addition, FCMabs were significantly elevated after the Dex injection compared with the control experiments 0 to 12 h post-treatment (KWH test, n1 = n2 = n3 = 6: H = 8.5, P = 0.014; see Figure 3 for details).
In females, significantly lower FCMconc values were found from 4 to 24 h post-Dex injection in the 4 h intervals (Figure 4; KWH test, n1 = n2 = n3 = 6: H = 6.2–11.9, 0.001 < P < 0.05), from 8 to 24 h in the 8 h interval (KWH test, n1 = n2 = n3 = 6: H =10.4 and 11.7, P < 0.005) and from 12 to 24 h in the 12 h interval (KWH test, n1 = n2 = n3 = 6: H = 11.7, P = 0.003).
Significantly higher FCMabs values were found 4 to 8 h post-Dex injection and significantly lower values were found from 12 to 24 h postinjection (KWH test, n1 = n2 = n3 = 6: H = 10.4–11.7, 0.001 < P < 0.05). In the 8 h interval, lower values from 16 to 24 h postinjection (KWH test, n1 = n2 = n3 = 6: H = 11.6, P = 0.003) and in the 12 h interval from 12 to 24 h postinjection (KWH-test, n1 = n2 = n3 = 6: H = 11.4, P = 0.003; see Figure 3 for details) were observed.
Discussion
Measuring faecal GCM levels to assess an animal's adrenocortical activity has been established during the last decades in an increasing number of species (for a review see Tourna and Palme 4 ). Although many papers deal with different aspects of FCM excretion and measurement (for a review see Möstl and Palme, 1 Tourna and Palme, 4 Palme 10 ), the question of the best way to display the results (amount versus concentration) remains unanswered. Gained results in experiments often differ largely between concentrations and absolute amounts. In such cases it is hard to decide, which values to rely on, without knowing the corresponding values in the blood. Therefore a sound physiological validation of both possibilities to express results is highly necessary. Thus, the goal of this study was to compare FCMconc and FCMabs in rats as model animals and to point out the advantages and disadvantages of both systems. The influence of the sampling intervals of collection of faeces was investigated too. In many studies the decision to use a certain sampling interval often seems to be arbitrary, although the chosen interval might have a great impact on the results. To achieve these goals, the detailed data of a set of already published physiological validation experiments in rats were used. 16 The frequent sampling intervals and the consequent homogenization of all collected faecal samples within an interval provided a high temporal resolution. Therefore the collected data represent a prerequisite basis for this study.
Our findings revealed that FCMconc and FCMabs were highly correlated (medians above 0.71 for both sexes and all performed tests). This is in accordance with the results of Pihl and Hau 20 and Royo et al., 15 who also found similar positive correlations. Nevertheless various studies claimed that especially in cases of varying defecation rates caused by illness or other reasons, FCMabs renders changes of corticosterone concentration in the blood better.13,14,21 Striking argument is the changing volume of voided faeces within and between days. GCM are supposed to enter the small intestine through the bile duct, independent of the produced faecal mass, food intake or other factors.14,21,22 The argument follows that a changing defecation rate necessarily leads to changing FCMconc, while concentrations of GC in the blood and FCMabs stay unaffected and have to be favoured. At least in cattle the contrary has been proven: Rabiee et al. 23 compared blood levels of progesterone as well as concentrations and total mass of faecal progesterone metabolites in two groups of cows fed with different dry matter content. Steroid concentrations in the blood as well as in the faeces showed no significant differences between the two groups. But faecal output and absolute amounts of excreted metabolites were both significantly higher in cows fed with higher dry matter content. They concluded that daily excretion rates of progesterone metabolites are more closely related to daily faecal output than concentrations of faecal progesterone metabolites are. As the study was carried out in cattle no direct conclusions about the correlation of food intake and FCM in rats can be drawn because of differences between ruminants and monogastrics. However, steroid metabolites are excreted into the duodenum via the bile. Therefore, their fate from the duodenum until the rectum is not that different. Hence the results presented by Rabiee and colleagues still strongly support the hypothesis that production of FCM in rats is also influenced by food intake and faecal output. In our study, excretion of faecal matter in the females’ ACTH experiment and the control experiments was similar and did not differ significantly. However, only FCMconc led to the expected significant differences, while FCMabs resulted in no significant differences, regardless of the used sampling intervals. Thus, in our study measuring FCMconc proved to be clearly superior to FCMabs.
In general, females produced less faeces than males, which is clearly attributable to the lower body weight compared with male rats of the same age. In female rats, the amounts of produced faeces in the Dex experiment were significantly higher than in the two control experiments. This might explain why FCMabs in the Dex experiment were partially even significantly higher in some intervals (4–8 h postinjection) than values of the control experiments, while FCMconc were similar or significantly lower (see Figure 3). Results of Rabiee et al. 23 and our study suggest, in contrast to former assumptions, that also in rats corticosterone enters the small intestine not constantly but depending upon faecal production caused by varying blood flow to the liver. In males, we could not observe any changes in the defecation rates between the treatment groups. Therefore in males no such conclusion can be made concerning this point. In general these results show that comparison of groups with significantly different defecation rates is complicated and fault-prone and interpretation of data has to be done carefully and with caution.
An additional drawback of the measurement of FCMabs is that it requires the collection of all faeces excreted over time. In many animal species an entire collection is simply not possible. Albeit this method is applicable in domestic livestock and laboratory animals; nonetheless a strict and laborious sampling regime is obligatory. Small rodents like laboratory rats or mice show a clear and rather strong diurnal rhythm of the faecal GCM excretion. Therefore frequent sampling is necessary to detect for example short disturbances of the diurnal rhythm of GC monitored in mice.6,8,9,12,18,24,25 Additionally, this is supported by data of Bamberg et al. 26 who found no significant differences between an ACTH stimulation test and the DV in male rats. They concluded that the relatively long sampling interval after injection of ACTH (14 h) masked the elevation of CM caused by the ACTH stimulation test. The necessity to use short sampling intervals is linked with another shortcoming of displaying results as FCMabs. The loss of any faecal material necessarily leads to a lower amount of FCMabs. This is less pronounced, when sampling is performed over a longer period of time and the volume of collected faecal matter is relatively high compared with the loss of a single faecal pellet, but is expressed in cases of short sampling intervals and therefore small collected faecal amounts. In our experiments, setting longer sampling intervals did not necessarily lead to diminished differences (see Figure 3). Significantly, higher concentrations in the ACTH test and lower concentrations in the Dex test were detectable, even when using long time intervals (e.g. 12 h). Reasons for this might be the relatively long lasting and rather strong pharmacological stimulation or suppression of the adrenocortical activity.
The expressed DV in rats16,14,26 also makes it strongly advisable to compare faecal CM excretion of an experiment at the same points of time with the circadian rhythm, regardless of the chosen calculation method, in order to facilitate the detection of minor changes in adrenocortical activity and to avoid the coverage or artificial amplification of elevated or depressed CM levels.
Taken together, based on physiological validation experiments, in this paper, for the first time clear advantages and disadvantages of expressing results of FCM analyses as total amounts (FCMabs) or concentrations (FCMconc) could be presented. According to our findings in laboratory rats, giving results as FCMconc is suggested to be the method of choice for displaying results of glucocorticoid metabolite measurements.